OPTIMIZATION OF EFFICIENCY, REGULATION AND
SPECIFIC ABSORPTION RATE OF A TRANSCUTANEOUS
ENERGY TRANSMITTER WITH RESONANT CAPACITOR
Daniela Wolter Ferreira and Luiz Lebensztajn
Laboratório de Eletromagnetismo Aplicado, Escola Politécnica da Universidade de São Paulo,
Av. Prof. Luciano Gualberto, Travessa 3, 158, Cidade Universitária, São Paulo, Brazil
Keywords: Specific absorption rate, Induced current density, Transcutaneous energy transmitter, Resonant capacitor.
Abstract: The induced current density and Specific Absorption Rate (SAR) in the skin around a Transcutaneous
Energy Transmitter (TET) was analyzed. The considered TET was projected with serial resonant capacitor
and had its efficiency, regulation and SAR optimized by a multi-objective genetic algorithm (MGA),
considering a range of TET parameters. A surrogate approach (Kriging) was also used to model the
objective functions and support the optimization with less computational cost.
1 INTRODUCTION
The main problem of the artificial organs mostly or
completely implanted inside the body is the power
supply. For this reason, several researchers
(Dissanavake et al., 2009, Joung and Cho, 1996 and
Ghahary and Cho, 1992) have studied a way to
transfer electric energy to the internal artificial
devices without the need for direct electrical
connectivity, thus decreasing the chances of
infections, allowing more comfort and offering more
flexibility to the patient’s daily activities. This is
called Transcutaneous Energy Transmission
technology, or TET, and it is normally achieved by
means of electromagnetic fields, similar to a
transformer with skin between primary and
secondary windings. This however, creates high
values of regulation, low coupling and considerable
induced currents, requiring higher voltage from the
battery at low efficiency.
In order to increase the efficiency and decrease
the regulation, some researchers such as Joung and
Cho, (1996) and Ghahary and Cho (1992) use
resonant capacitors to compensate the leakage
inductance of the windings of the TET.
This paper studies the behavior of the induced
current density and Specific Absorption Rate (SAR),
proposed by Johson (1975), generated by a TET
with associated series resonant capacitors that was
projected to optimize efficiency, regulation and SAR
by changing the frequency, core geometry and wire
turns while maintaining the necessary power to the
artificial organ.
In order to simulate the magnetic effects, a finite
element method software (Flux-2D) was used with
several different configurations to generate a set of
data, which was then used by a Kriging model
(Lebensztajn et al., 2004) to perform data
interpolation.
2 PRINCIPLES
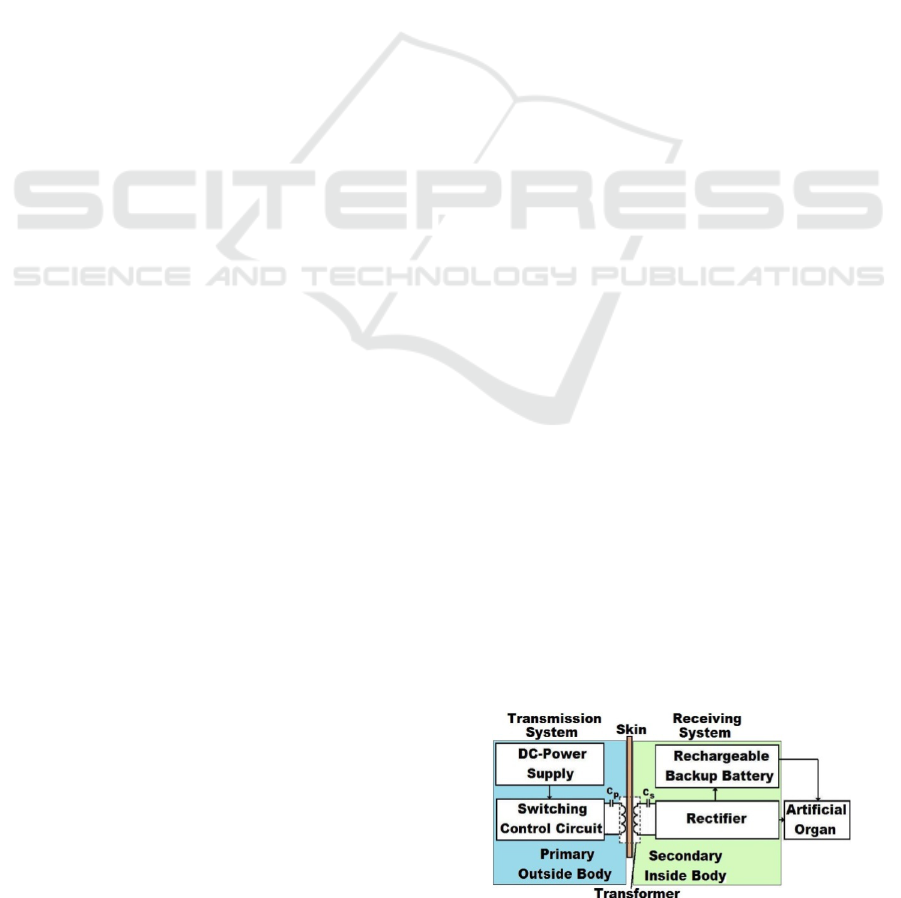
Fundamentally, the TET has one external part
(transmission system) and one subcutaneous internal
part (receiving system) as shown in Figure 1.
Figure 1: TET’s block diagram.
The TET works as a very thin transformer in
which the process of transmission is composed of an
external battery connected to the input of an
224
Wolter Ferreira D. and Lebensztajn L..
OPTIMIZATION OF EFFICIENCY, REGULATION AND SPECIFIC ABSORPTION RATE OF A TRANSCUTANEOUS ENERGY TRANSMITTER WITH
RESONANT CAPACITOR.
DOI: 10.5220/0003787102240229
In Proceedings of the International Conference on Biomedical Electronics and Devices (BIODEVICES-2012), pages 224-229
ISBN: 978-989-8425-91-1
Copyright
c
2012 SCITEPRESS (Science and Technology Publications, Lda.)
oscillation circuit that transforms the DC voltage to
high frequency AC voltage at the output to which an
external coil (primary) is connected. The receiving
system has an internal coil (secondary) that receives
the alternating magnetic field and transforms it to
AC voltage. A rectifier circuit is then used to supply
DC power to the artificial organ and the internal
backup battery. In this paper, capacitors, calculated
to compensate the leakage inductance of the primary
and secondary coils, are connected in series to each
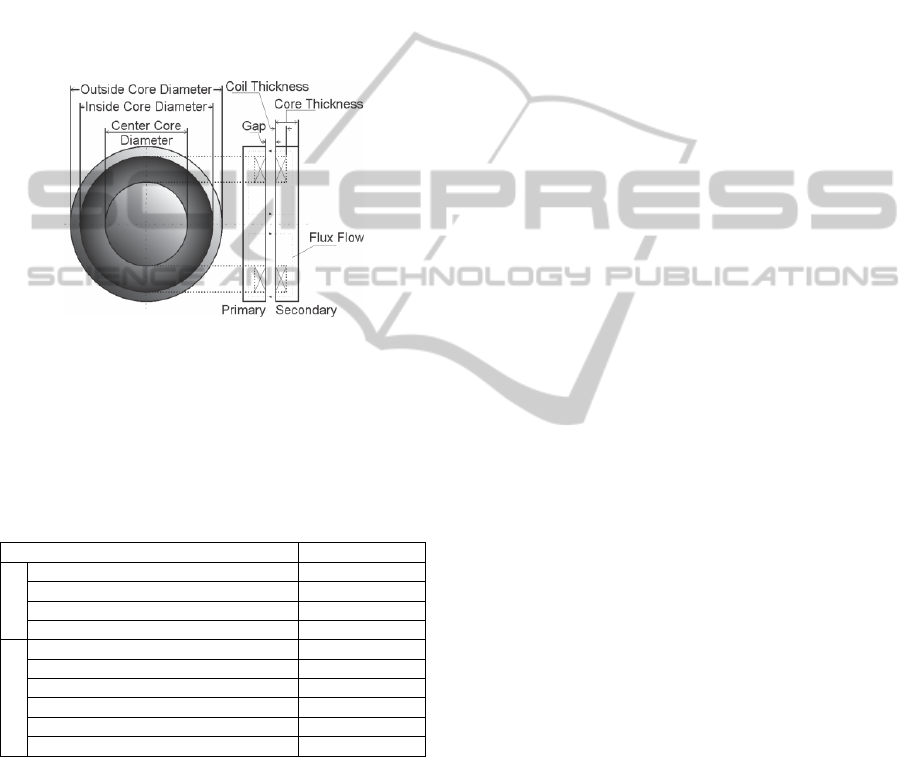
winding. The geometry of the transformer is
optimized in a cylindrical shape of ferrite cores and
copper coils as shown in Figure 2.
Figure 2: Geometry of the considered transformer - Top
and Cross View.
This geometry was simulated in Flux-2D with
different configurations keeping some parameters
fixed while varying other parameters as depicted in
Table 1.
Table 1: Design parameters of the transformer.
Parameters Values
Fixed
Gap between primary and secondary 5 mm
Core Thickness 5 mm
Outside Core Diameter 50 mm
Inside Core Diameter 40 mm
Variable
Center Core Diameter [8 24] mm
Coil Thickness [1 4] mm
Primary wire Turns [23 45] mm
Secondary wire Turns [23 45] mm
Source Voltage [16 30] V
Frequency [100 300] kHz
As this geometry can be modelled by the
transformer’s complete model, capacitors were
added in series with the primary and secondary
windings to compensate the leakage inductance. In
this way, those capacitors could be calculated by:
C=1/ω
2
.L
d
(1)
In this equation, ω=2.
π
.f, whereas f is the
considered frequency and L
d
is the leakage
inductance of the considered configuration.
2.1 Optimization
A multi-objective genetic algorithm (MGA) method
was used with three different objective functions:
1. Maximize efficiency.
2. Minimize regulation.
3. Minimize SAR.
In addition, two kinds of constraints were
considered:
1. The load power is greater than a specified
value.
2. The reserved areas for the coils have enough
space for the number of wire turns.
As a typical multi model optimization, the MGA
solution cannot be improved with respect to any
objective function without worsening at least one
other objective function. Hence, a set with more than
one optimal solution, which differs from each other
by the evaluation of each objective function, can be
found. This means that each configuration cannot be
dominated by any other on the set and thus it is
called non-dominated set.
However, it is too time consuming for the MGA
to run a new simulation in Flux-2D for every new
configuration that the optimization requests for
achieving the better data. Hence, in order to support
the optimization method with less computational
cost, the Universal Kriging (Lebensztajn et al.,
2004) was employed to create a model which could
be used by MGA at any moment without the need of
simulating a new configuration in Flux-2D.
The Kriging uses: 1) a set of polynomials (p(x))
which is intended to follow the general tendency of
the function to be modelled, and 2) a set of
Gaussians (h(x)) that makes it possible to follow the
fluctuations around the general tendency. Therefore,
the model can be written by:
y(x) = w
T
.h(x) + c
T
.p(x) (2)
w
T
and c
T
are the weights for each Gaussian and
polynomial respectively, which could be determined
through the set of data. The Universal Kriging
assumes that a trend (c
T
p(x)) can be written as a
linear combination of known functions, determined
by the physics of the problem being dealt with and is
performed by a second-order polynomial (full
quadratic model, for example). Subsequently, the
stochastic portion of (2) (w
T
h(x)) was calculated.
OPTIMIZATION OF EFFICIENCY, REGULATION AND SPECIFIC ABSORPTION RATE OF A
TRANSCUTANEOUS ENERGY TRANSMITTER WITH RESONANT CAPACITOR
225
3 METHODOLOGY
3.1 The TET and its Electromagnetic
Effects on Biological Tissues
In Flux-2D, the transformer was designed with the
core geometry shown in Figure 2. The properties of
the materials utilized in this software to construct
this geometry were the properties of ferrite for the
cores and copper for the coils, as well as the wet
skin electrical properties (electrical conductivity and
the relative permittivity) as defined by the Institute
for Applied Physics Nello Carrara, even considering
the differences for each simulated frequency of
Table 1.
Moreover, utilizing the electrical circuit and
magnetic geometry coupling capability of this
software, the DC-power supply and switching
control circuit were implemented as a sinusoidal AC
power source. The receiving system after the
internal coil (rectifier and other blocks shown on the
secondary of Figure 1) was simulated through a load
resistance that absorbs at least 12 W.
Virtual short and open circuit tests were also
performed by running the software with resistance
value 10
-10
Ω and 10
+10
Ω, respectively. After these
tests were conducted with each of the configurations
of Table 1, electric current, voltage and power were
collected on the primary and secondary circuit,
allowing the attainment of the complete model of the
transformer and, subsequently, the series resonant
capacitors as mentioned on equation 1.
Thus, all the configurations were again simulated
with the series resonant capacitor as shown in Figure
1, collecting once more the electric current, voltage
and power in the load and in the sinusoidal power
source to calculate the efficiency and regulation
from the source to the load, and the SAR and
induced current density in the skin.
3.2 Optimization
From the last simulations executed with all the
configurations shown on Table 1 while using serial
resonant capacitors, a pool of data was collected for
the use by the surrogate approach (Kriging model).
Results from random configurations from this
pool data was chosen and inserted into RSTool from
Matlab to obtain a full quadratic model for the
efficiency, regulation, SAR, and load power,
represented by c
T
and p(x) of equation 2. Since six
variables were used (the variable data on Table 1) to
create each model, the polynomials of equation 2 are
written by a constant term, six linear terms, 15
interaction terms (pair-wise products of the
variables), and six squared terms of each variable.
The weight c of each term is the vector of
coefficients calculated by RSTool.
In addition, the residuals from RSTool were used
to obtain the Gaussian tendency parameters, w
T
and
h(x). This means that the coefficients of w were
evaluated by using maximum likelihood estimation
as described in Lebensztajn et al. (2004) on the set
of residuals.
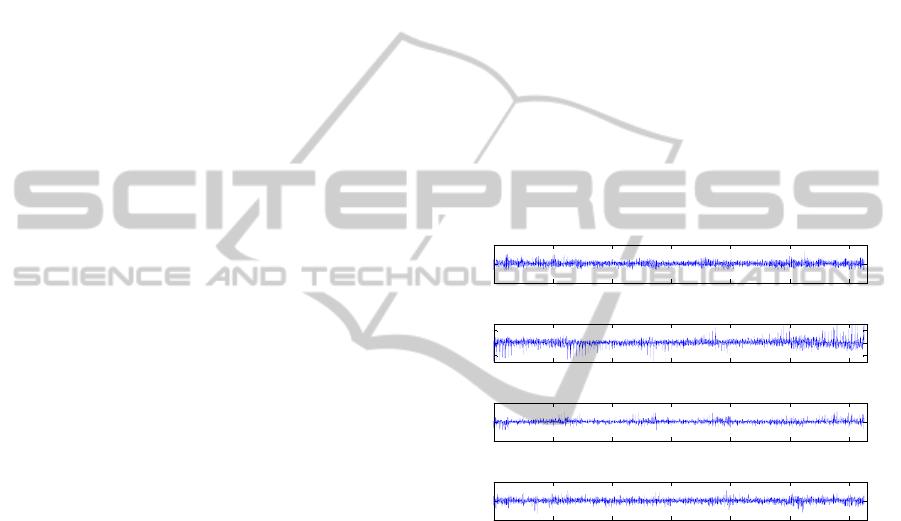
In order to ascertain the attained model, the
efficiency, regulation, SAR, and load power were
estimated through this pattern for all the simulated
configurations and compared with the other values
in the data pool, as shown in Figure 3, resulting in
errors smaller than 15 %. This means that the
Kriging model is consistent and can be used to
support the objective function in the optimization
process.
Figure 3: Percentual error of the kriging model compared
to the simulation with Flux-2D for efficiency, regulation,
SAR and load power. Each point on x axis means each
configuration combining parameters according to Table 1.
Hence, the MGA technique of optmintool from
Matlab was applied to maximize the efficiency while
minimizing regulation and SAR, considering the
mentioned constraints, which were implemented as
penalty functions as in Vieira et al. (2004).
4 RESULTS
The MGA resulted in a set of 32 different
configurations (the non-dominated set), which were
simulated again by Flux-2D.
Figure 4 presents the value of efficiency,
regulation, and SAR obtained from the Kriging
model and the Flux software, indicating that the
0 2000 4000 6000 8000 10000 12000
-1
0
1
Efficiency error for TET with capacitor (%)
0 2000 4000 6000 8000 10000 12000
-10
0
10
Regulation error for TET with capacitor (%)
0 2000 4000 6000 8000 10000 12000
-10
0
10
SAR error for TET with capacitor (%)
0 2000 4000 6000 8000 10000 12000
-10
0
10
Load Power error for TET with capacitor (%)
BIODEVICES 2012 - International Conference on Biomedical Electronics and Devices
226
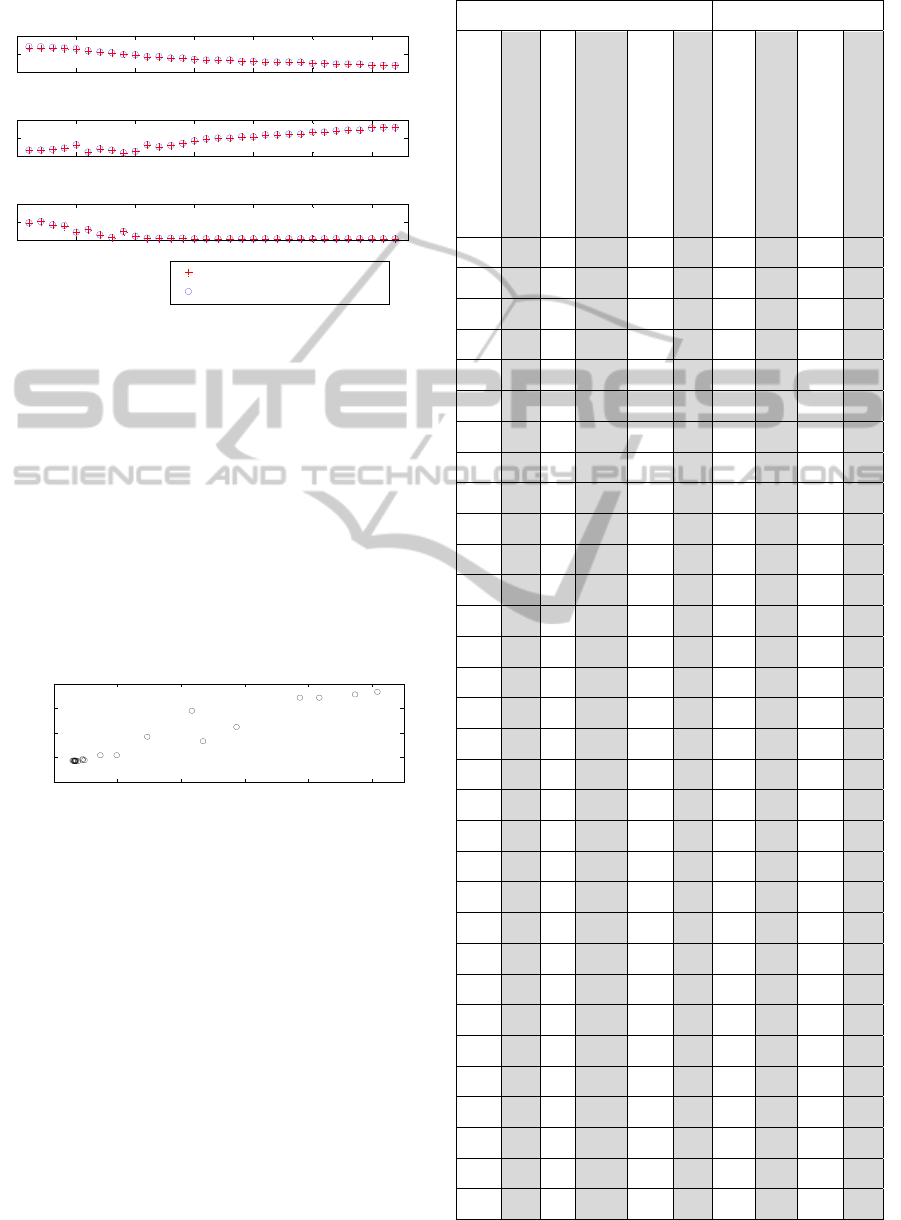
Kriging model has very good reliability.
Figure 4: SAR, efficiency and regulation - Comparison
between data calculated in Flux and estimated from
Kriging model. Each point on x axis means each
configuration on the non-dominated set, selected by MGA.
Figure 5 shows that, from all the configurations
chosen by MGA, the worst value of SAR is also the
highest value of the maximum current density, e.g.,
10.2 mW/kg and 1.8 A/m
2
. However, the worst
current density compared to the limit of ICNIRP was
0.83 A/m
2
at 107.3 kHz, which is equal to 77 % of
the maximum current density for this frequency. For
all other configurations, the current density is always
lower than 77 % of the maximum current density
(ICNIRP, 1998).
Figure 5: Values of maximum current density and SAR for
each configuration resulted from MGA.
From Figures 4 and 5, the efficiency improves
together with regulation (efficiency increase as
regulation decreases) and the SAR improves
together with the induced current density (both
decreases together), but each pair improves with the
depreciation of the other. This behaviour can also be
seen on Table 2, which also shows that all chosen
configurations are possible to be constructed
mechanically. The induced values of SAR and
current density are also within the limits proposed
by ICNIRP (1998), i.e., 10 W/kg and frequency
divided by 100, respectively.
Table 2: Selected configurations from MGA and results.
Configurations Results
Frequency [kHz]
Primary Wire Turns
Secondary Wire Turns
Voltage [V]
Center Core Diameter
[mm]
Coil Thickness [mm]
Efficiency [%]
Regulation [%]
SAR [mW/m
2
]
Induced Current Density
[
A/m
2
]
289.1 5 23 29.99 8.10 2.27 96.7 6.4 9.49 1.77
284.8 43 23 29.91 8.24 2.22 96.6 6.3 10.17 1.83
279.6 44 23 29.81 10.99 2.27 96.5 7.1 8.35 1.71
277.2 43 23 29.70 13.05 2.43 96.4 8.2 7.74 1.71
277.9 45 23 26.88 18.66 2.36 96.3 12.3 4.34 1.44
161.2 44 24 27.79 8.26 2.31 95.9 4.4 5.75 1.11
153.7 38 24 23.53 19.11 2.68 95.5 7.8 2.94 0.92
111.4 38 24 19.20 19.05 2.83 95.2 6.1 1.46 0.54
107.3 44 23 29.93 8.13 2.22 94.8 3.3 4.69 0.83
104.2 44 28 20.45 9.59 2.32 94.7 5.0 1.98 0.54
108.2 45 30 19.55 21.38 2.94 94.2 12.1 0.92 0.47
104.5 44 31 18.03 18.07 2.93 94.1 9.9 0.97 0.45
103.1 44 32 18.05 18.93 3.06 93.9 11.6 0.91 0.44
101.5 44 31 18.56 22.47 2.87 93.8 13.5 0.77 0.43
101.5 44 33 17.95 22.44 3.01 93.3 16.6 0.71 0.43
101.4 44 33 18.42 23.55 2.98 93.2 18.6 0.70 0.43
100.9 44 33 18.38 23.64 3.16 93.2 19.3 0.68 0.43
101.2 44 33 18.33 23.77 3.10 93.2 19.5 0.67 0.43
101.0 44 34 18.10 23.55 3.17 92.9 20.9 0.67 0.43
101.1 44 34 18.07 23.60 3.18 92.9 21.3 0.66 0.43
100.9 44 35 17.97 23.72 3.18 92.7 23.3 0.65 0.43
100.8 44 35 17.94 23.73 3.19 92.7 23.5 0.64 0.43
100.9 44 35 17.96 23.81 3.23 92.7 24.0 0.64 0.43
101.0 44 35 17.93 23.84 3.22 92.6 23.9 0.64 0.43
100.8 44 36 17.79 23.84 3.24 92.4 26.1 0.62 0.43
101.0 44 36 17.82 23.92 3.24 92.4 26.4 0.62 0.43
100.9 44 37 17.65 23.81 3.18 92.1 28.0 0.62 0.44
100.8 44 37 17.69 23.92 3.24 92.1 28.5 0.61 0.44
100.8 44 37 17.67 23.92 3.24 92.1 28.5 0.61 0.44
100.6 44 38 17.63 23.92 3.25 91.8 31.2 0.60 0.44
100.8 44 38 17.61 23.94 3.25 91.8 31.2 0.60 0.44
100.6 44 38 17.61 23.94 3.25 91.8 31.2 0.60 0.44
0 5 10 15 20 25 30
90
95
100
Efficiency (%)
0 5 10 15 20 25 30
0
20
40
Regulation (%)
0 5 10 15 20 25 30
0
10
20
SAR (mW/kg)
Calculated by Flux-2D
Calculated by Kriging model
0 2 4 6 8 10
0
0.5
1
1.5
2
Current Density
(A/m
2
)
SAR (mW/kg)
OPTIMIZATION OF EFFICIENCY, REGULATION AND SPECIFIC ABSORPTION RATE OF A
TRANSCUTANEOUS ENERGY TRANSMITTER WITH RESONANT CAPACITOR
227
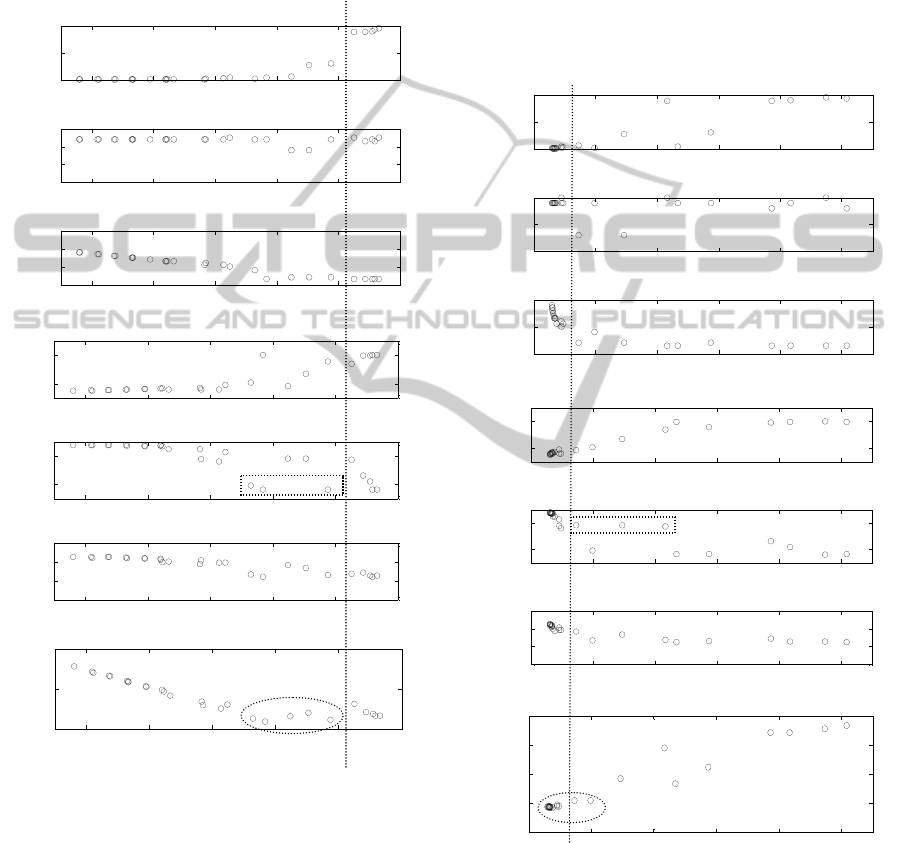
The best obtained efficiency is 96.7 % when
regulation is 6.4 %, SAR is 9.5 mW/kg and
maximum current density is 1.77 A/m
2
, but the best
SAR value is 0.6 mW/kg when efficiency is 91.8 %,
regulation is 31.2 % and current density is 0.44
A/m
2
. Figures 6 and 7 help to analyze the
configurations that entail the best values of
efficiency, regulation, SAR and current density.
Figure 6: Value of efficiency for all the resulting
configurations from MGA.
The vertical line on Figure 6 shows that the
configurations on the right results in the best values
of efficiency and regulation, though there are some
better values of regulation on the left side, as in
circled. According to this figure, for the non-
dominated set of configurations, the best values of
efficiency and regulation coincide when:
The frequency is high (about 280 kHz),
though the improvement of efficiency and
regulation with respect to the frequency is
small after 110 kHz.
The secondary coil has less than 28 turns.
The source voltage is about 30 V.
The center core diameter is smaller than
20 mm, though there are combinations with
center core less than 10 mm that entail lower
efficiency even with better regulation.
The coil thickness is about 2.3 mm, though the
MGA selected configurations with coil
thickness between 2.22 and 3.25 mm.
Figure 7: Value of SAR for all the resulting configurations
from MGA.
Similarly, the vertical line on Figure 7 shows that
the configurations on the left imply in the best
values of SAR and current density. Different than
for efficiency and regulation, the best values of SAR
and current density coincide when:
92 93 94 95 96 97
100
200
300
Frequency
(kHz)
Efficiency (%)
92 93 94 95 96 97
20
30
40
50
Primary
Wire Turns
Efficiency (%)
92 93 94 95 96 97
20
30
40
50
Secondary
Wire Turns
Efficiency (%)
92 93 94 95 96 97
20
30
Source
Voltage (V)
Efficiency (%)
92 93 94 95 96 97
10
20
Center Core
Diam. (mm)
Efficiency (%)
92 93 94 95 96 97
1
2
3
4
Coil Thick.
(mm)
Efficiency (%)
92 93 94 95 96 97
0
20
40
Regulation
(%)
Efficiency (%)
0 2 4 6 8 10
100
200
300
Frequency
(kHz)
SAR (mW/kg)
0 2 4 6 8 10
35
40
45
Primary
Wire Turns
SAR (mW/kg)
0 2 4 6 8 10
20
30
40
Secondary
Wire Turns
SAR (mW/kg)
0 2 4 6 8 10
20
30
Source
Voltage (V)
SAR (mW/kg)
0 2 4 6 8 10
10
20
Center Core
Diam. (mm)
SAR (mW/kg)
0 2 4 6 8 10
1
2
3
4
Coil Thick.
(mm)
SAR (mW/kg)
0 2 4 6 8 10
0
0.5
1
1.5
2
Current Density
(A/m
2
)
SAR (mW/kg)
BIODEVICES 2012 - International Conference on Biomedical Electronics and Devices
228

The frequency is about 100 kHz.
The secondary coil has more than 30 turns.
The source voltage is around 18 V.
The center core diameter is bigger than
18 mm, though there are combinations with
center core around 19 mm that presents higher
values of SAR and current density, as shown
in the square.
The coil thickness is more than 2.8 mm.
The selected primary coil selected by MGA has
between 38 and 45 turns. This parameter affects the
efficiency, regulation, SAR and current density
depending of the combination with the other
parameters, as it can be seen on Figure 6 and 7,
which show that same number of turns for the
primary coil can entail good and bad values of these
observed functions.
These analyses are very important at the moment
of the choice of the configuration to use since the
MGA returns a set with more than one non-
dominated configurations. It is also important to
note that even though a penalty function was added
to limit the distance between the center and inside
cores to make sure that the coil fits the allocated
area, this might not be enough, since in the real life,
it may be necessary to decrease the core center
diameter even more to increase the size of the area
to better allocate the coils.
5 CONCLUSIONS
A reliable model for efficiency, regulation, SAR and
load power as a function of center core diameter,
coil thickness, primary and secondary coil number
of turns, and source voltage and frequency was
created by a Kriging model that used a set of TET
system configurations simulated virtually through a
Flux-2D. Though the Kriging models were not
supplied with the information of using serial
resonant capacitors, they were acceptable with errors
smaller than 15 % when compared with the finite
element method calculations.
This model was used by the MGA to find a set of
32 good configurations (non-dominated set) that
result in high efficiency at lower regulation and SAR
with less computational cost than when using the
finite element method. All the attained
configurations generated tolerable values of SAR
and induced current density with efficiencies
between 92 and 97 % and regulations between 3.4
and 31.2 %.
An analysis of the efficiency, regulation, SAR and
current density versus each of the parameters for the
resulting configurations from MGA was also
performed, indicating that SAR and current density
follow a similar trend. Thus, even though the current
density was not taken into account in the
optimization process, the minimization of SAR is a
kind of indirect minimization of the current density.
The efficiency and regulation also follow the
same trend, but they are contradictory to SAR and
current density.
Since the resulting SAR and current density from
all the configurations of the non-dominated set
presented suitable values within the ICNIRP limits,
the selection of better efficiency and regulation may
prevail at the final choice for implementation.
REFERENCES
Dissanavake, T. D., Hu, A. P., Malpas, S., Bennet, L.,
Taberner, A., Booth, L., Budgett D., 2009.
Experimental Study of a TET System for Implantable
Biomedical Devices. IEEE Trans. on Biomedical
Circuits and Systems, vol. 3, no. 6.
Joung, G. B., Cho, B. H., 1996. An Energy Transmission
System for an Artificial Heart Using Leakage
Inductance Compensation of Transcutaneous
Transformer. Power Electronics Specialists
Conference, vol.1, IEEE, pp. 898-904.
Ghahary, A., Cho, B. H., 1992. Design of a Tanscutaneous
Energy Transmission System using a series resonant
Converter. IEEE Transaction on Power electronics,
pp. 261-269.
Johnson, C. C., 1975. Recommendations for specifying
EM wave irradiation conditions in bioeffects research.
J. Microwave Power, vol. 10, pp. 249-250.
Lebensztajn, L., Marretto, C. A. R., Costa, M. C.,
Coulomb, J. L., 2004. Kriging: a useful tool to
electromagnetic devices optimization. IEEE Trans. on
Magnetics, v. 40, no. 2, pp. 1196-1199.
Institute for Applied Physics Nello Carrara. An Internet
resource for the calculation of the dielectric properties
of the body tissues in the frequency range 10 Hz–100
GHz. Available at: URL:http://niremf.ifac.cnr.it/
tissprop/.
Vieira, D. A. G., Adriano, R. L. S., Vasconcelos, J. A.,
Krahenbuhl, L., 2004. Treating Constraints as
Objectives in Multiobjective Optimization Problems
using Niched Pareto Genetic Algorithm. IEEE Trans.
On Magnetics, v40, no. 2, pp. 1188-1191.
ICNIRP (International Commission on Non-Ionizing
Radiation Protection), 1998 Guidelines for Limiting
Exposure to Time-Varying Electric, Magnetic, and
Electromagnetic Fields (up to 300 GHz). Health Phys.,
vol. 74, no. 4, pp. 494–522.
OPTIMIZATION OF EFFICIENCY, REGULATION AND SPECIFIC ABSORPTION RATE OF A
TRANSCUTANEOUS ENERGY TRANSMITTER WITH RESONANT CAPACITOR
229
