
IMPROVEMENTS TO A MULTIPLE PROTEIN SEQUENCE
ALIGNMENT TOOL
André Atanasio M. Almeida and Zanoni Dias
Institute of Computing, University of Campinas, Campinas-SP, Brazil
Keywords:
Multiple sequence alignment, K-mer count method, Compressed alphabet.
Abstract:
Sequence alignment is the most common task in the bioinformatics field. It is a required method for the ex-
ecution of a wide range of procedures such as the search for homologue sequences in a database or protein
structure prediction. The main goal of the experiments in this work was to improve on the accuracy of the
multiple sequence alignments. Our experiments concentrated on the MUMMALS multiple aligner, experi-
menting with three distinct modifications to the algorithm. Our first experiment was to modify the substring
length of the k-mer count method. The second experiment we attempted was to substitute the commonly used
Dayhoff(6) with alternative compressed alphabets. The third experiment was to modify the distance matrix
computation and the guide tree construction. Each of the experiments showed a gain in result accuracy.
1 INTRODUCTION
Sequence alignment is undoubtedlythe most common
task in the bioinformatics field (Notredame, 2002).
Many procedures require sequence comparison, rang-
ing from database searches (Altschul et al., 1990) to
protein structure prediction (Rost et al., 1994). Se-
quences can be compared in pairs in a scan for homo-
logue sequences in a database or they can be simul-
taneously aligned, constructing the so called MSA
(Multiple Sequence Alignment), which can be used to
view the effect of evolution throughout a whole pro-
tein family. MSAs can also be used for phylogenetic
tree construction, conserved motifs identification and
prediction of secondary and tertiary protein structure.
A classical method used for MSA construc-
tion is progressive alignment (Feng and Doolittle,
1987; Hogeweg and Hesper, 1984), as performed by
ClustalW (Thompson et al., 1994) using a tree or
a dendrogram as a guide in order to perform a se-
ries of pairwise alignments between “neighbor” se-
quences (or pre-aligned sequences groups). A known
drawback to this approach is the absence of error
correction committed in previous iterations. More-
over it is known that as the similarity between se-
quences diminishes the alignment quality also drops,
a known cause for this is the use of general sub-
stitution matrices. Two approaches are applied to
solve or ease this problem. The first one is the use
of iterative refinement after the progressive align-
ment (Notredame, 2002; Thompson et al., 1999). The
other approach is to compute a consistency measure
over a set of pairwise alignments before the progres-
sive alignment is performed, as initially applied by
T-COFFEE (Notredame et al., 2000).
The most common techniques for pairwise align-
ment use substitution matrices, such as PAM (Day-
hoff et al., 1978) or BLOSUM (Henikoff and
Henikoff, 1992), with a dynamic programming al-
gorithm and gap penalty (Needleman and Wunsch,
1970). Another technique for building pairwise align-
ments is to use hidden Markovmodels (HMM), which
offers the possibility of defining a consistency mea-
sure, as performed by ProbCons (Do et al., 2005).
Although it is possible to generalize the classical pair-
wise alignment algorithm (Needleman and Wunsch,
1970) to a greater number of sequences, the algo-
rithm’s complexity becomes a problem (Just, 2001;
Lipman et al., 1989) thus making heuristics common
in MSA construction.
MUMMALS (Pei and Grishin, 2006) is a high
quality tool for MSA construction which uses a prob-
abilistic consistency measure along with a HMM for
pairwise alignment. As noted by Pei and Grishin (Pei
and Grishin, 2006), alignments produced by MUM-
MALS surpass in quality the alignments generated
by tools such as ClustalW (Thompson et al., 1994),
MUSCLE (Edgar, 2004b) and ProbCons (Do et al.,
2005). MUMMALS hidden Markov model imple-
ments multiple states to match, describing the lo-
226
Atanasio M. Almeida A. and Dias Z..
IMPROVEMENTS TO A MULTIPLE PROTEIN SEQUENCE ALIGNMENT TOOL.
DOI: 10.5220/0003789202260233
In Proceedings of the International Conference on Bioinformatics Models, Methods and Algorithms (BIOINFORMATICS-2012), pages 226-233
ISBN: 978-989-8425-90-4
Copyright
c
2012 SCITEPRESS (Science and Technology Publications, Lda.)

cal structure information without an explicit structure
prediction. In order to estimate the HMM parame-
ters to be used, a supervised learning method is ap-
plied using a large set of structural alignments built
by DaliLite (Holm and Sander, 1996) from divergent
domain pairs from SCOP (Murzin et al., 1995).
In this study we evaluated some changes in the
MUMMALS algorithm. The aim was higher quality
alignments. In Section 2 the MUMMALS algorithm
is presented and we show the implemented changes
in Section 3. In Section 4 the results are shown and
finally we present the conclusion and future works in
Section 5.
2 MUMMALS ALGORITHM
The standard HMM for pairwise alignment has three
states emitting residues: a single match state ‘M’
emitting residue pairs, an ‘X’ state emitting residues
in the first sequence and a ‘Y’ state emitting residues
in the second sequence (Durbin et al., 1998). This
model is named HMM_1_1_0. In MUMMALS mod-
els new match states based on structural alignments
are introduced. Aligned residue pairs in a core block
are modeled by the match state ‘M’. A core block is
a sequence region where there is a structural align-
ment. In case the aligned residue pair is in another
region, it is modeled by the match state ‘U’. This
model is named HMM_1_1_1. Figure 1 compares the
standard HMM model for pairwise sequence align-
ment and those proposed in MUMMALS (Pei and
Grishin, 2006). Notice in subfigure (a) the identifica-
tion of core blocks and how their states vary from one
model to another. Subfigures (b) and (c) respectively
represent the structures of the HMM_1_1_0 and the
HMM_1_1_1 with their states and transitions.
There are even more complex models in MUM-
MALS. HMM_1_3_1 is one of them where match
states are created according to secondary structure
types. In this model the match state ‘M’ is removed
and three other states are inserted: ‘H’ (helix), ‘S’
(strand) and ‘C’ (coil). For example: if a residue
pair occurs in a helix region, the associated match
state will be ‘H’, as detailed in Figure 1. Similarly,
in the HMM_3_1_1 model, multiple match states are
introduced based on several solvent accessibility cat-
egories. The most complex model is HMM_3_3_1,
which combines the last two models. A supervised
learning method applied on a set of structural align-
ments is used to estimate the parameters for the
model, these values are transition and emission prob-
abilities.
The progressive alignment method using a score
function based on probabilistic consistency similar to
ProbCons (Do et al., 2005) is used to build the MSA.
First a distance matrix is constructed based on the k-
mer count method (Edgar, 2004b), then a tree is built
using the UPGMA method (Sneath and Sokal, 1973).
The next step is the probabilistic consistency mea-
sure computation and finally the sequences are pro-
gressively aligned guided by the tree using the con-
sistency based score function. To properly balance
alignment speed and accuracy, a two-stage alignment
strategy similar to the one used in the PCMA (Pei
et al., 2003) is applied. In a first stage highly simi-
lar sequences are progressively aligned quickly with-
out consistency scoring. The scoring function in this
stage is a weighted sum-of-pairs measure using BLO-
SUM62 scores. During the second alignment stage
the sequences (or pre-aligned groups) are subject to
the more time-consuming probabilistic consistency
measure.
The diverse hidden Markov models were evalu-
ated (Pei and Grishin, 2006) and showed good perfor-
mance when compared to ProbCons (Do et al., 2005),
MAFFT (Katoh et al., 2005) with several options,
MUSCLE (Edgar, 2004b) and ClustalW (Thompson
et al., 1994). HMM_1_3_1 and HMM_3_3_1 are
highlighted among the diverse MUMMALS models.
Among the test sets with identity ranges below 20%,
MUMMALS outperformedall other aligners. In other
cases, MAFFT with options [lg]insi usually gives the
best performance. Among the two best MUMMALS
models, HMM_1_3_1 is the best option, it is able to
build alignments almost as accurate as HMM_3_3_1,
but running about three times faster. This motivated
us to use HMM_1_3_1 as a reference for our study.
This model was also the choice of the MUMMALS
developer team.
The k-mer count method as applied to MUM-
MALS converts the input sequences according to a
compressed alphabet, in this case Dayhoff(6) was
used with value of k = 6. The alphabets used in this
study are shown in Table 1. This method allows the
conversion of sequences composed of an alphabet of
20 residues (an amino acid sequence) into sequences
composed of an alphabet of six classes, where classes
are defined by groups of amino acids with similar
properties. Then a structure is constructed from each
sequence of 20 residues converted to a sequence of 6
classes, mapping the substrings occurrences. The dis-
tance between a pair of sequences is calculated based
on differences in their structures or, in other words,
the difference in the sequence composition by sub-
strings of fixed length k.
The following is an example of a sequence of
amino acids, which is converted according to Day-
IMPROVEMENTS TO A MULTIPLE PROTEIN SEQUENCE ALIGNMENT TOOL
227
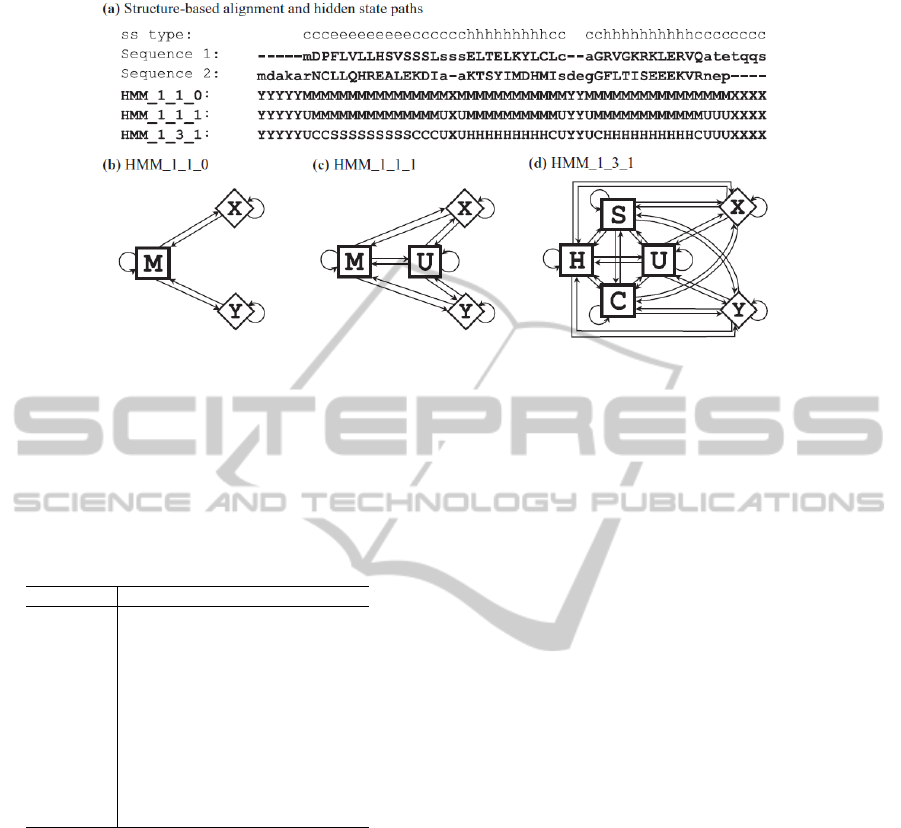
Figure 1: (a) Is an illustration of structure-based sequence alignment and hidden state paths. In Sequences 1 and 2, the
uppercase and lowercase letters, respectively represent aligned core blocks and unaligned regions. Secondary structure (ss)
types (helix, ‘h’; strand, ‘e’; coil, ‘c’) are shown for Sequence 1. The hidden state paths for three models are shown below
the amino acid sequences. (b) Model structure of HMM_1_1_0. (c) Model structure of HMM_1_1_1. (d) Model structure of
HMM_1_3_1. This illustration was taken from the work of Pei and Grishin (Pei and Grishin, 2006).
Table 1: Compressed alphabets evaluated in this study. The
first column is the alphabet name. The number at the end of
the name indicates the number of classes for the alphabet.
In the second column are the classes or, in other words, as
the amino acids are grouped on the alphabet.
Alphabet Classes
Dayhoff(6) AGPST,C,DENQ,FWY,HKR,ILMV
SE-B(6) AST,CP,DEHKNQR,FWY,G,ILMV
SE-B(8) AST,C,DHN,EKQR,FWY,G,ILMV,P
Li-A(10) AC,DE,FWY,G,HN,IV,KQR,LM,P,ST
Li-B(10) AST,C,DEQ,FWY,G,HN,IV,KR,LM,P
Murphy(10) A,C,DENQ,FWY,G,H,ILMV,KR,P,ST
SE-B(10) AST,C,DN,EQ,FY,G,HW,ILMV,KR,P
SE-V(10) AST,C,DEN,FY,G,H,ILMV,KQR,P,W
Solis-D(10) AM,C,DNS,EKQR,F,GP,HT,IV,LY,W
Solis-G(10) AEFIKLMQRVW,C,D,G,H,N,P,S,T,Y
SE-B(14) A,C,D,EQ,FY,G,H,IV,KR,LM,N,P,ST,W
hoff(6). Note the classes are named from A to F in
the order presented in the Table 1. For example the
amino acid M was converted to class F, D to class C
and P to class A.
Original: MDPFLVLLHSVSSSLSSSELTELKYLCL
Converted: FCADFFFFEAFAAAFAAACFACFEDFBF
In this example, the first substring (with k = 6) is
FCADFF and the second is CADFFF.
3 IMPLEMENTED CHANGES
The MUMMALS’ algorithm core is based on Prob-
Cons (Do et al., 2005) and its probabilistic consis-
tency measure. The first one defines more com-
plex and sophisticated hidden Markov models and
employs a k-mer count method similar to MUS-
CLE (Edgar,2004b) and MAFFT (Katoh et al., 2005).
In these works, it is unclear how the parameters were
chosen. Therefore, in our work, we made a systematic
evaluation for k-mer count method parameters. We
performed three distinct evaluations changing some
aspects in the original MUMMALS algorithm. In
two of them, we evaluated different options for the
k-mer count method. In the third experiment, we eval-
uated the algorithm applying a standard distance ma-
trix computation aiming to compare against the k-mer
count method.
During the planning phase of the test some ques-
tions arose, such as: “Would a change in k lead to con-
siderable variation in the MSA score?” or “Would a
change in k affect the runtime of the algorithm?”. Ini-
tially we evaluated a version with the k value ranging
between 3 and 14, the inferior limit of 3 was chosen
because substrings under this value are of no signif-
icance and the upper limit of 14 was considered due
to the time/result ratio. The objective was to visual-
ize the effect of altering the length of the substrings.
As we will see in Section 4, the answer to both initial
questions were positive.
In the second experiment, we evaluate alterna-
tive compressed alphabets, such as: SE-B(6), SE-
B(8), Li-A(10), Li-B(10), Murphy(10), SE-B(10),
SE-V(10), Solis-D(10), Solis-G(10) and SE-B(14),
whose classes are shown in Table 1. In this experi-
ment we chose to range k from 6 to 10 because these
were the values that represented the best time / result
ratio in our previous experiment varying the alpha-
bet from 3 to 14. For more information about the al-
phabets consult the study by Robert C. Edgar (Edgar,
BIOINFORMATICS 2012 - International Conference on Bioinformatics Models, Methods and Algorithms
228

2004a).
For the last experiment, the initial part of the
progressive alignment algorithm was completely
changed. The methods for distance matrix compu-
tation and guide tree construction were redefined ac-
cording to a study performed by Almeida and col-
leagues (Almeida et al., 2010), where was evalu-
ated a series of methods applied in each step of pro-
gressive alignment. Amongst the evaluated meth-
ods, was compared a series of algorithms for dis-
tance matrix computation and algorithms used for
guide tree construction. In this third experiment we
implemented two new aligners, both using the PAM
method for which we introduced some normaliza-
tion tests for distance values produced. The first one
uses the PAM (Dayhoff et al., 1978) method (avail-
able by PHYLIP package (Felsenstein, 2011)) for dis-
tance matrix computation combined with Neighbor-
Joining (Saitou and Nei, 1987) (NJ) for guide tree
construction. The second one uses PAM for distance
matrix computation and UPGMA (Sneath and Sokal,
1973) instead NJ. UPGMA and NJ are classical and
the most known methods for guide tree construction
and thus were the chosen ones. For both aligners re-
gardless of the guide tree construction method, we
used thirteen different intervals for normalization al-
ways with the same upper limit of 1.0 but ranging
the lower limit from 0.0 to 0.9 in incrementations of
0.1, we also used values of 0.65, 0.75 and 0.85. The
three last values for inferior limit were used because
the best results were obtained when the inferior limit
was 0.6 or higher and then we decide to evaluate some
other values in that range.
The k-mer count method with a compressed al-
phabet for distance computation was used in the
MUMMALS algorithm in order to achieve a time
complexity reduction (Edgar, 2004a). However, theo-
retically that method does not have the same accuracy
when compared to classical methods. The third evalu-
ation aims to verify the possibility of gaining accuracy
if we use a classical method, moreover we will check
the additional cost.
Note that it is not possible to apply these experi-
ments in a combined way. In the first experiment we
ranged the k value. In the second one we ranged the k
value and also changed the compressed alphabet used.
Finally, in the last one the k-mer count method is re-
placed by a standard distance matrix computation.
4 RESULTS
The evaluation method applied to this study was BAl-
iBASE (Thompson et al., 2005), it is the most com-
monly used tool for large scale benchmarking by the
scientific community (Wallace et al., 2005) and has
the advantage of manual refinement and data set divi-
sion, which to us was a clear benefit when compared
to other benchmark tools. BAliBASE is based on
pre-compiled alignments, thus each alignment con-
structed by a new algorithm is evaluated by compar-
ison against a reference previously provided. Each
BAliBASE set aims to evaluate specific situations in
the MSA context.
During the evaluation all 218 data sets composed
by complete sequences provided by BAliBASE 3.0
were used. We used the SP - also known as Q-score
- and TC methods as alignment scoring, considering
only core blocks because they are the only reliable
portions of the alignments. The SP method is used to
compute the percent of residue pairs correctly aligned
or in other words equal to reference alignment. The
TC method is used to compute the fraction of identical
columns in both alignments (evaluated and reference).
In Table 2 we present the results for the first test,
where we ranged the k value and the MUMMALS
standard compressed alphabet was kept, Dayhoff(6).
Approximately 14 hours (50, 594s) were needed to
compute the 218 alignments, resulting in an average
SP score 85.54 and an average TC score 53.83 using
the original MUMMALS, in a 2.5GHz Dual Core pro-
cessor and 3GB of memory. In Table 2, the ∆t value is
the time variation when compared to original MUM-
MALS. For example, when k = 8 the time required
was 81, 017s (60.13% higher). The ∆SP and ∆TC val-
ues are the score variations and the ∆A column shows
the average between ∆SP and ∆TC. An alternative
way to view the performance gain is to concentrate on
the error variation. When we get a SP score 85.00, we
get a solution with a 15% rate of errors in the align-
ments when compared to the references. Thus if a
new algorithm gets a SP score 90.00, we get a solu-
tion with 33.33% less errors when compared to the
first one. The ∆SPe and ∆TCe columns show the er-
ror variation, using SP and TC score, respectively, and
the ∆Ae column shows the average between ∆SPe and
∆TCe. Observe the highest SP score occurred when
k = 13 or k = 14. When k = 8 it was achieved the best
TC score. Note the best ∆A value occurs when k = 8
and the best ∆Ae appears when k = 13. A perfor-
mance gain in the SP score has a higher significance
under an error variation perspective because original
MUMMALS has a higher SP score.
In Table 3 we show the results for the evaluationof
alternative compressed alphabets. Note the best val-
ues for SP and TC were achieved with SE-B(10) and
k = 7, which required 87, 692s to get a SP score of
86.70 and a TC score of 56.52.
IMPROVEMENTS TO A MULTIPLE PROTEIN SEQUENCE ALIGNMENT TOOL
229

Table 2: Results with Dayhoff(6) alphabet when the k parameter was varied. The first column is the alphabet name, k is the
substring length of the k-mer count method and ∆t is the runtime variation when compared to original MUMMALS. ∆SP and
∆TC are the score variation when compared to original MUMMALS and the ∆A column is the average between ∆SP and
∆TC. The three last columns are a diferent view for score variation, where we focus on error variation.
Alphabet k ∆t ∆SP ∆TC ∆A ∆SPe ∆TCe ∆Ae
Dayhoff(6) 3 -93.46 -30.05 -56.94 -43.50 177.83 66.40 122.11
Dayhoff(6) 4 -92.53 -25.32 -46.17 -35.74 149.85 53.83 101.84
Dayhoff(6) 5 -79.93 -9.31 -19.07 -14.19 55.07 22.24 38.65
Dayhoff(6) 6 0.00 0.00 0.00 0.00 0.00 0.00 0.00
Dayhoff(6) 7 38.73 1.08 2.82 1.95 -6.37 -3.29 -4.83
Dayhoff(6) 8 60.13 0.85 3.47 2.16 -5.05 -4.05 -4.55
Dayhoff(6) 9 75.60 0.94 3.00 1.97 -5.57 -3.50 -4.54
Dayhoff(6) 10 89.80 1.06 3.22 2.14 -6.30 -3.76 -5.03
Dayhoff(6) 11 98.92 1.23 2.52 1.87 -7.27 -2.94 -5.10
Dayhoff(6) 12 110.48 1.08 2.75 1.91 -6.39 -3.20 -4.80
Dayhoff(6) 13 120.64 1.36 1.86 1.61 -8.08 -2.17 -5.12
Dayhoff(6) 14 125.92 1.36 1.41 1.39 -8.07 -1.65 -4.86
Best 1.36 3.47 2.16 -8.08 -4.05 -5.12
Finally in Table 4 and in Table 5 we present the
results for the version with the changed distance ma-
trix computation and guide tree construction. We per-
formed tests using a range of normalization methods
for the distance values. Note when we use PAM + NJ
and the values are normalized between 0.7 and 1.0,
we get the best results in general for the third evalua-
tion. The PAM + UPGMA version showed an inferior
performance and it proved to be less sensitive to the
normalization method. Several versions had achieved
similar performance.
5 CONCLUSIONS AND FUTURE
WORKS
Meaningful improvements were achieved. All evalu-
ated changes improved the results accuracy. The best
aligner reduces alignment errors by 7.98% in SP scor-
ing and in 5.81% in accordance with TC scoring.
In the first test, whose results were presented in
Table 2, we achieved 8.08% error reduction when
evaluated by SP score and 4.05% less errors when we
compare the results using the TC method.
The second test, whose results were shown in Ta-
ble 3, extracted the best results. The aligner with com-
pressed alphabet SE-B(10) and k = 7 achieved 86.70
for SP measure and 56.52 for TC measure. In other
words, it reduces errors in 7.98% in a SP score eval-
uation and gets 5.81% less errors in a TC score per-
spective.
The last test, whose results were presented in Ta-
ble 4 and in Table 5, achieved 6.19% of error reduc-
tion when evaluated by SP score and 4.85% less errors
when we compare the results using the TC score, this
was achieved with the PAM + NJ version.
As we discussed earlier we systematically evalu-
ated the k-mer count method parameters. We evalu-
ated alternative compressed alphabets and we made
experiments ranging the k value (substring length).
The results presented in Tables 2 and 3 indicate qual-
ity ( ∆A and ∆Ae columns) improvementas the k value
increases. However, after reaching the peak, the qual-
ity decreases as the k value increases. Probabilisti-
cally speaking, as k increases the number of possi-
ble strings of size k increases, whereas the probabil-
ity to find similar substring occurrences decreases. In
short, the accuracy increases with the k value, but
there comes a point where no more similarities can
be found and the k-mer count results deteriorate.
Note the time is extremely affected according to
k value, compressed alphabet, distance matrix com-
putation method, guide tree construction procedure
and normalization method. The runtime varied from
3, 311s to 135, 967s. The original MUMMALS con-
sumes 50, 594s to deliver results with an SP score
of 85.54 and a TC score of 53.83. Our best aligner
requires 87, 692s to perform the 218 alignments or
in other words it is 73.33% slower than the original
MUMMALS. However it reduces errors in 7.98% in
the SP score evaluation and gets 5.81% less errors in
TC score perspective.
The results enable us to conclude that a k-mer
count method can be accurate enough to compute a
precise distance matrix in the progressive alignment
context. It is important to note that the use of pairwise
alignment through a complex hidden Markov model
like applied by MUMMALS helped us to achieved
these results, its complex HMM and the probabilistic
consistency measure had already shown a high accu-
racy for alignment with low similarity sequences.
We are considering as a future work the imple-
mentation of other classical methods in a similar con-
text to the third test, such as distance matrix compu-
BIOINFORMATICS 2012 - International Conference on Bioinformatics Models, Methods and Algorithms
230
Table 3: Results for the alternative compressed alphabets evaluation. The columns are similar to Table 2.
Alphabet k ∆t ∆SP ∆TC ∆A ∆SPe ∆TCe ∆Ae
SE-B(6) 6 -3.33 0.46 1.91 1.19 -2.73 -2.23 -2.48
SE-B(6) 7 30.89 0.65 3.08 1.86 -3.83 -3.59 -3.71
SE-B(6) 8 52.18 0.86 3.42 2.14 -5.08 -3.99 -4.53
SE-B(6) 9 68.08 1.02 4.27 2.65 -6.06 -4.98 -5.52
SE-B(6) 10 82.99 0.92 4.38 2.65 -5.46 -5.11 -5.29
SE-B(8) 6 33.47 0.89 4.76 2.83 -5.26 -5.55 -5.41
SE-B(8) 7 59.15 0.77 4.55 2.66 -4.53 -5.30 -4.92
SE-B(8) 8 76.88 1.19 4.57 2.88 -7.03 -5.33 -6.18
SE-B(8) 9 90.12 1.23 4.28 2.76 -7.28 -4.99 -6.14
SE-B(8) 10 102.52 1.30 3.04 2.17 -7.67 -3.55 -5.61
Li-A(10) 6 73.93 0.89 3.88 2.39 -5.28 -4.53 -4.90
Li-A(10) 7 94.16 1.21 3.55 2.38 -7.13 -4.14 -5.64
Li-A(10) 8 112.56 1.27 4.23 2.75 -7.52 -4.93 -6.23
Li-A(10) 9 124.15 1.01 2.24 1.62 -5.97 -2.61 -4.29
Li-A(10) 10 135.10 1.21 1.55 1.38 -7.15 -1.81 -4.48
Li-B(10) 6 63.69 0.66 3.14 1.90 -3.90 -3.67 -3.78
Li-B(10) 7 84.54 0.64 2.97 1.80 -3.80 -3.46 -3.63
Li-B(10) 8 99.84 1.03 3.39 2.21 -6.07 -3.95 -5.01
Li-B(10) 9 113.52 0.94 2.69 1.82 -5.58 -3.14 -4.36
Li-B(10) 10 123.42 0.91 0.48 0.70 -5.41 -0.56 -2.99
Murphy(10) 6 51.24 0.57 3.93 2.25 -3.35 -4.59 -3.97
Murphy(10) 7 74.06 0.67 4.09 2.38 -3.99 -4.77 -4.38
Murphy(10) 8 90.06 1.23 4.79 3.01 -7.28 -5.59 -6.43
Murphy(10) 9 103.29 1.13 3.19 2.16 -6.71 -3.72 -5.21
Murphy(10) 10 118.59 1.02 2.89 1.96 -6.05 -3.37 -4.71
SE-B(10) 6 49.35 0.94 3.76 2.35 -5.57 -4.39 -4.98
SE-B(10) 7 73.33 1.35 4.98 3.16 -7.98 -5.81 -6.89
SE-B(10) 8 89.51 1.12 4.28 2.70 -6.61 -4.99 -5.80
SE-B(10) 9 102.09 1.34 2.70 2.02 -7.94 -3.14 -5.54
SE-B(10) 10 116.11 1.12 2.37 1.74 -6.64 -2.76 -4.70
SE-V(10) 6 37.92 0.50 3.68 2.09 -2.97 -4.29 -3.63
SE-V(10) 7 61.58 1.00 4.25 2.63 -5.91 -4.96 -5.43
SE-V(10) 8 77.77 1.15 3.74 2.44 -6.80 -4.36 -5.58
SE-V(10) 9 92.03 1.12 2.81 1.97 -6.66 -3.28 -4.97
SE-V(10) 10 103.56 1.20 3.17 2.19 -7.12 -3.70 -5.41
Solis-D(10) 6 83.67 0.84 4.17 2.50 -4.97 -4.86 -4.92
Solis-D(10) 7 104.56 0.96 3.32 2.14 -5.65 -3.87 -4.76
Solis-D(10) 8 122.56 1.30 2.22 1.76 -7.70 -2.59 -5.14
Solis-D(10) 9 137.40 1.22 1.18 1.20 -7.21 -1.37 -4.29
Solis-D(10) 10 144.09 1.20 2.20 1.70 -7.12 -2.56 -4.84
Solis-G(10) 6 -57.23 -7.49 -17.83 -12.66 44.35 20.79 32.57
Solis-G(10) 7 14.62 -1.28 -3.07 -2.17 7.59 3.58 5.58
Solis-G(10) 8 59.45 0.27 1.76 1.01 -1.57 -2.06 -1.81
Solis-G(10) 9 89.64 0.22 2.08 1.15 -1.27 -2.42 -1.85
Solis-G(10) 10 108.24 0.28 1.29 0.78 -1.65 -1.50 -1.58
SE-B(14) 6 84.42 1.22 4.68 2.95 -7.19 -5.46 -6.33
SE-B(14) 7 103.52 1.01 3.41 2.21 -5.98 -3.98 -4.98
SE-B(14) 8 121.80 1.15 3.09 2.12 -6.83 -3.60 -5.21
SE-B(14) 9 136.18 0.92 1.17 1.04 -5.43 -1.36 -3.39
SE-B(14) 10 146.87 0.84 -0.11 0.36 -4.96 0.13 -2.42
Best 1.35 4.98 3.16 -7.98 -5.81 -6.89
tation and guide tree construction variations. Another
option would be to test different structural alignment
methods, we can also try to implement changes in the
hidden Markov model applied to pairwise alignments
along MSA construction.
ACKNOWLEDGEMENTS
This work was supported in part by FAPESP (PhD
scholarship 2007/08020-0). CNPq supported this
study also, through universal projects (483177/2009-
IMPROVEMENTS TO A MULTIPLE PROTEIN SEQUENCE ALIGNMENT TOOL
231

Table 4: Results when we changed the methods for distance matrix computation and guide tree construction to PAM and NJ.
The columns are similar to Table 2.
Normalization ∆t ∆SP ∆TC ∆A ∆SPe ∆TCe ∆Ae
none 18.94 -4.70 -15.81 -10.25 27.80 18.44 23.12
0.00 - 1.00 -78.67 -12.09 -22.35 -17.22 71.55 26.06 48.81
0.10 - 1.00 -75.88 -10.46 -18.45 -14.46 61.91 21.52 41.71
0.20 - 1.00 -69.49 -8.66 -14.09 -11.38 51.27 16.43 33.85
0.30 - 1.00 -46.86 -4.72 -8.11 -6.42 27.94 9.46 18.70
0.40 - 1.00 91.52 0.36 -0.11 0.13 -2.12 0.13 -1.00
0.50 - 1.00 168.60 0.97 3.74 2.35 -5.73 -4.36 -5.04
0.60 - 1.00 168.74 1.03 3.88 2.45 -6.07 -4.52 -5.30
0.65 - 1.00 168.69 1.05 3.97 2.51 -6.19 -4.63 -5.41
0.70 - 1.00 168.59 1.04 4.16 2.60 -6.13 -4.85 -5.49
0.75 - 1.00 168.64 1.01 4.10 2.56 -6.00 -4.78 -5.39
0.80 - 1.00 168.59 1.04 4.09 2.56 -6.14 -4.77 -5.45
0.85 - 1.00 168.70 0.99 3.91 2.45 -5.88 -4.56 -5.22
0.90 - 1.00 168.27 1.04 4.12 2.58 -6.14 -4.81 -5.47
Best 1.05 4.16 2.60 -6.19 -4.85 -5.49
Table 5: Results when we changed the methods for distance matrix computation and guide tree construction to PAM and
UPGMA. The columns are similar to Table 2.
Normalization ∆t ∆SP ∆TC ∆A ∆SPe ∆TCe ∆Ae
none 91.17 -1.27 -4.01 -2.64 7.53 4.68 6.10
0.00 - 1.00 -70.12 -6.13 -9.87 -8.00 36.26 11.51 23.89
0.10 - 1.00 -43.43 -4.13 -4.83 -4.48 24.46 5.63 15.05
0.20 - 1.00 168.52 0.85 3.27 2.06 -5.05 -3.81 -4.43
0.30 - 1.00 168.47 0.99 3.27 2.13 -5.88 -3.81 -4.84
0.40 - 1.00 144.76 1.00 3.27 2.14 -5.94 -3.81 -4.88
0.50 - 1.00 144.80 1.00 3.27 2.14 -5.94 -3.81 -4.88
0.60 - 1.00 145.04 1.00 3.27 2.14 -5.94 -3.81 -4.88
0.65 - 1.00 144.77 1.00 3.27 2.14 -5.94 -3.81 -4.88
0.70 - 1.00 144.90 1.00 3.27 2.14 -5.94 -3.81 -4.88
0.75 - 1.00 144.79 1.00 3.27 2.14 -5.94 -3.81 -4.88
0.80 - 1.00 144.82 1.00 3.27 2.14 -5.94 -3.81 -4.88
0.85 - 1.00 168.45 1.00 3.27 2.14 -5.94 -3.81 -4.88
0.90 - 1.00 144.85 1.00 3.26 2.13 -5.94 -3.80 -4.87
Best 1.00 3.27 2.14 -5.94 -3.81 -4.88
1 and 473867/2010-9) and a postdoctoral scholarship
(200815/2010-5). Thanks to Steve Doré for the revi-
sion of the English manuscript.
REFERENCES
Almeida, A., Souza, M., and Dias, Z. (2010). Progressive
multiple protein sequence alignment. In 6th Inter-
national Symposium on Bioinformatics Research and
Applications - Short Abstracts, pages 102–105, Storrs,
CT, USA. http://www.cs.gsu.edu/isbra10/.
Altschul, S., Gish, W., Miller, W., Myers, E., and Lipman,
D. (1990). Basic local alignment search tool. J Mol
Biol, 215(3):403–410.
Dayhoff, M., Schwartz, R., and Orcutt, B. (1978). A model
for evolutionary change in proteins. Atlas of Protein
Sequence and Structure, 5(3):345–352.
Do, C., Mahabhashyam, M., Brudno, M., and Batzoglou,
S. (2005). ProbCons: Probabilistic consistency-based
multiple sequence alignment. Genome Res., 15:330–
340.
Durbin, R., Eddy, S., Krogh, A., and Mitchison, G. (1998).
Biological sequence analysis. Cambridge University
Press, Cambridge, UK.
Edgar, R. (2004a). Local homology recognition and dis-
tance measures in linear time using compressed amino
acid alphabets. Nucleic Acids Res., 32:380–385.
Edgar, R. (2004b). MUSCLE: multiple sequence align-
ment with high accuracy and high throughput. Nucleic
Acids Res., 32:1792–1797.
Felsenstein, J. (2011). PHYLIP home page.
http://evolution.genetics.washington.edu/phylip.html.
Feng, D. and Doolittle, R. (1987). Progressive sequence
alignment as a prerequisite to correct phylogenetic
trees. J. Mol. Biol., 25:351–360.
Henikoff, S. and Henikoff, J. (1992). Amino acid substitu-
tion matrices from protein blocks. Proc. Natl. Acad.
Sci., 89(22):10915–10919.
Hogeweg, P. and Hesper, B. (1984). The alignment of sets
of sequences and the construction of phyletic trees:
An integrated method. J. Mol. Evol., 20:175–186.
BIOINFORMATICS 2012 - International Conference on Bioinformatics Models, Methods and Algorithms
232

Holm, L. and Sander, C. (1996). Mapping the protein uni-
verse. Science, 273:595–603.
Just, W. (2001). Computational complexity of multiple
sequence alignment with SP-score. J Comput Biol,
8(6):615–623.
Katoh, K., Kuma, K., Toh, H., and Miyata, T. (2005).
MAFFT version 5: improvement in accuracy of
multiple sequence alignment. Nucleic Acids Res,
33(2):511–518.
Lipman, D., Altschul, S., and Kececioglu, J. (1989). A tool
for multiple sequence alignment. Proc. Natl. Acad.
Sci., 86:4412–4415.
Murzin, A., Brenner, S., Hubbard, T., and Chothia, C.
(1995). SCOP: a structural classification of proteins
database for the investigation of sequences and struc-
tures. J. Mol. Biol., 247:536–540.
Needleman, S. and Wunsch, C. (1970). A general method
applicable to the search for similarities in the amino
acid sequence of two proteins. J. Mol. Biol., 48:443–
453.
Notredame, C. (2002). Recent progress in multiple se-
quence alignment: a survey. Pharmacogenomics,
3:131–144.
Notredame, C., Higgins, D., and Heringa, J. (2000). T-
COFFEE: A novel method for fast and accurate multi-
ple sequence alignment. J Mol Biol, 302(1):205–217.
Pei, J. and Grishin, N. (2006). MUMMALS: multiple se-
quence alignment improved by using hidden Markov
models with local structural information. Nucleic
Acids Res, 34:4364–4374.
Pei, J., Sadreyev, R., and Grishin, N. (2003). PCMA: fast
and accurate multiple sequence alignment based on
profile consistency. Bioinformatics, 19:427–428.
Rost, B., Sander, C., and Schneider, R. (1994). PHD - An
automatic server for protein secundary structure pre-
diction. CABIOS, 10:53–60.
Saitou, N. and Nei, M. (1987). The neighbor-joining
method: A new method for reconstructing phyloge-
netic trees. Mol. Biol. Evol., 4:406–425.
Sneath, P. and Sokal, R. (1973). Numerical Taxonomy.
Freeman, San Francisco.
Thompson, J., Higgins, D., and Gibson, T. (1994).
CLUSTAL W: improving the sensitivity of progres-
sive multiple sequence alignment through sequence
weighting, positions-specific gap penalties and weight
matrix choice. Nucl. Acid. Res., 22:4673–4680.
Thompson, J., Koehl, P., Ripp, R., and Poch, O. (2005).
BAliBASE 3.0: latest developments of the multiple
sequence alignment benchmark. Proteins, 61:127–
136.
Thompson, J., Plewniak, F., and Poch, O. (1999). A com-
prehensive comparison of multiple sequence align-
ment programs. Nucleic Acids Res., 27(13):2682–
2690.
Wallace, I., Blackshields, G., and Higgins, D. (2005). Mul-
tiple sequence alignments. Curr. Opin. Struct. Biol.,
15:261–266.
IMPROVEMENTS TO A MULTIPLE PROTEIN SEQUENCE ALIGNMENT TOOL
233
