
A COMPUTER AIDED DETECTION SYSTEM FOR
MICROCALCIFICATIONS IN BREAST PHANTOM IMAGES
Bruno Barufaldi
1
, Sarah Soares de Oliveira
1
, Leonardo Vidal Batista
1
, Homero Schiabel
2
and Manuella Santos Carneiro Almeida
3
1
Departamento de Informatica, Univerisdade Federal da Paraíba, João Pessoa, Brazil
2
Escola de Engenharia Elétrica, Universidade de São Paulo, São Carlos, Brazil
3
Agência Estadual de Vigilância Sanitária da Paraíba, Governo da Paraíba, João Pessoa, Brazil
Keywords: Breast cancer, Quality control, Visual perception, Breast phantom and Microcalcifications.
Abstract: Breast cancer control represents one of the greatest challenges that public health service faces nowadays. In
order to decrease the death rate from cancer in women, the AGEVISA-PB implemented a Mammography
Quality Control Programme to improve the performance of mammographic equipment in Paraiba - Brazil.
The evaluation method of these devices is accomplished through breast phantoms that simulate structures
found on a mammogram in order to assure the quality of radiographic images. Even so, evaluation by
technicians still suffers limitations caused by the visual inspections by individuals, such as long-time
benchmarking and subjectivity. The main purpose of this research is to develop a computerised system that
analyses radiological images of phantom MAMA-CDM and correlates with human visual perception. The
results indicate that the system developed can be used as a second opinion, thus becoming a tool of great
utility in aiding medical diagnosis.
1 INTRODUCTION
Breast cancer is a malignant tumour composed of
the abnormal development of breast cells. This kind
of cancer is most common both in Brazilian and
indeed women worldwide, representing 22% of the
new cancer cases per year (INCA, 2010). When the
disease is diagnosed early in the formation of the
tumour, it can be treated more effectively, increasing
the chances of cure. The most efficacious method for
early detection of this pathology is the mammogram,
and it consists of a radiological examination to
detect breast lesions, including non palpable lesions
(Roveda Junior, 2007).
The mammogram image quality is a constant
concern for organisations and experts who face the
challenge of early breast cancer detection, in order to
save lives and reduce the aggressiveness of
treatment (Medeiros and Elias, 2007). This is
directly related to the performance of
mammographic equipment. The handling and
maintenance of mammographic equipment interfere
in the medical evaluation quality and, when it is
performed incorrectly, it can produce radiographic
films that induce misdiagnosis.
Another factor that influences breast cancer
diagnosis is the subjectivity of human interpretation
of mammographic images. This subjectivity may
result in variations in the expert analysis, producing
different reports, according to differences of visual
perception. Issues such as eyestrain, ambient light,
low image quality and radiologist inexperience, may
influence the final diagnosis (Byng et al, 1997).
To ensure the quality of mammograms in Brazil,
the Brazilian Institute of Cancer (INCA), associated
with the Brazilian Radiology Association (CBR) and
Brazilian Agency of Sanitary Surveillance
(ANVISA), has plans for the foundation of a Quality
Programme in Mammograms that will be proposed
to the Ministry of Health for countrywide
deployment. The programme methodology requires,
among other points, the monthly evaluation of a
breast phantom imaged in the mammography
services (INCA, 2011).
A local Sanitary Surveillance Agency in the
Northeast region of the country (AGEVISA-PB)
maintains a quality control programme in
mammography, which is nationally known because
of its scientific technical and social impact. The
organisations that perform mammographic
414
Barufaldi B., Soares de Oliveira S., Vidal Batista L., Schiabel H. and Santos Carneiro Almeida M..
A COMPUTER AIDED DETECTION SYSTEM FOR MICROCALCIFICATIONS IN BREAST PHANTOM IMAGES.
DOI: 10.5220/0003789704140418
In Proceedings of the International Conference on Bio-inspired Systems and Signal Processing (BIOSIGNALS-2012), pages 414-418
ISBN: 978-989-8425-89-8
Copyright
c
2012 SCITEPRESS (Science and Technology Publications, Lda.)

examinations in the State of Paraiba send monthly a
phantom image to AGEVISA-PB, for the quality
evaluation of mammography services (Carvalho et
al, 2006). The procedure is arduous and time
consuming, with each phantom image carefully
analysed by experts for approximately 40 minutes.
These technicians classify each structure of interest
in the phantom by visibility criterion, producing
reports for quality image evaluations of the
mammographic equipment.
Computer Aided Detection (CAD) is used to
reduce the difficulties found in the identification of
structures in mammographic images by individuals,
providing a second opinion about the expert report.
These systems, when specific for mammographic
images, promote the integration between medicine
and technology to improve the detection in the
structures of interest (Porto, 2010).
Nevertheless, even using robust computerised
systems, detection of some structures of interest in
phantom images is still a difficult task. Because of
the smaller sizes in relation to other structures, high
contrast details can be confused as artefacts from the
revelation process of the radiographic film (Soares
and Lopes, 2001).
Artefacts in radiographic film can be related to
the processor rolls, the mammographic equipment
and the chemicals used for cleaning the equipment
or the film revelation. Mammographic images can
contain noises such as roller marks, spots,
fingerprints, silver deposits, etc.
In the adjustment activity of a radiographic film
some fixative solutions are used to dissolve the
silver deposits not removed by the reveller solution
in the previous step. These deposits are very soluble
in water and if not dissolved, can be sensitised by
the light, generating similar artefacts to the high
contrast detail on radiographic film.
This research aimed to develop a system that
automates most of the steps in the procedure of
quality control in mammographic equipment
currently adopted by AGEVISA-PB. This system
intends to detect and classify structures who
simulate microcalcifications of interest in breast
phantoms by visibility criterion, correlating with the
human visual system, in order to reduce the
subjectivity in image inspections in the phantom
MAMA-CDM (CBR, 2011).
2 MATERIALS AND METHODS
This system was developed using the Java
programming language along with the ImageJ, open
source software focused on the development of
image processing and analysis applications. The
algorithms developed were incorporated into ImageJ
through the use of plugins, and the system interface
was integrated with the system functionalities.
The system uses the Microtek scanner
ScanMaker i800 model to digitize the phantom
images in grayscale, 16 bits of contrast resolution
and 1200 x 1200 dpi of spatial resolution.
One of the approaches for visual inspection on
radiographic film is to determine the visibility of
structures of interest in the phantom MAMA-CDM
images. To detect these structures it is necessary that
the system defines different regions of search for
each phantom, due to the structure of interest
location which varies from one phantom to another
because of their handmade production.
2.1 Phantom MAMA-CDM
Breast phantoms are used to assess the quality
control of mammography services. The main
purpose of these phantoms is in the evaluation of
mammographic equipment, through the images that
contains structures which simulate the breast tissues.
The AGEVISA-PB developed a Programme of
Quality Control in Mammography, which uses the
phantom MAMA-CDM for the production of
radiological images from mammography equipment
in the State of Paraiba - Brazil. The use of this breast
phantom is recognised by the CBR (CBR, 2001). It
is interesting to know that these phantoms are
produced in a handmade mode, simulating a
compressed breast between 4 cm and 5 cm, with test
structures similar to the anatomical structures
present in the breast and a range of optical densities.
Figure 1 presents the breast phantom MAMA-
CDM, its radiographic image and the representation
of its structures. It is estimated on these images (A)
the background optical density, (B) the details of
low contrast (fibrous tissue), (C) the low contrast
thresholds (discs), (D) the high contrast details
(microcalcifications), (E) the structures who
simulate tumour masses and (F) the spatial
resolution (metal grids).
2.2 High Contrast Details
The images used have high resolution, which
eventually results in poor computer performance.
Therefore, areas of search were delimited for the
structure location in images of phantoms. From the
moment it receives an input image, the system
automatically adjusts its orientation through a
A COMPUTER AIDED DETECTION SYSTEM FOR MICROCALCIFICATIONS IN BREAST PHANTOM IMAGES
415
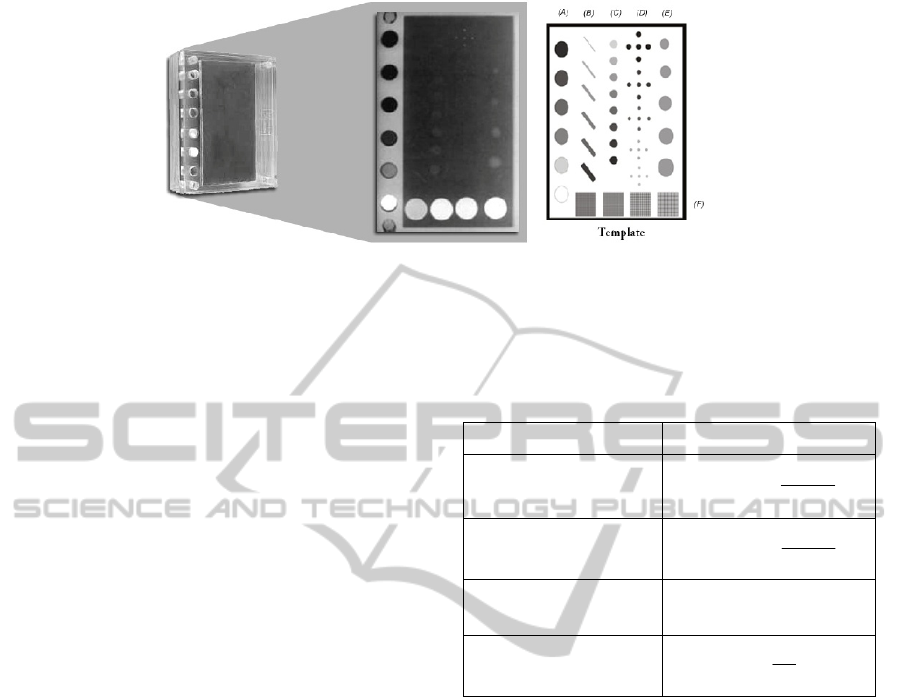
Figure 1: Breast phantom MAMA-CDM, its radiological image and the representation of its structures.
rotation based on the angle between the brightest
optical density and the darkest optical density. After
the adjusted image, is executed it looks for other
structures in the search regions by the correlation
matching method (Gonzales and Woods, 2002).
The visibility determination of each structure of
interest is assessed by a data mining tool called
WEKA, with the use of the J48 classifier. This
classifier will generate a model, where it is
necessary preselect some image attributes to execute
the training stage of the system (Martinez and
Sanjurjo, 2009).
In the production of each learning model, the J48
algorithm was used because of its simplicity and
satisfactory results. Moreover, in previous
researches, other algorithms have been tested to
develop the learning model, but the best results were
achieved by the J48 algorithm (Barufaldi et al,
2011).
The attributes such as average of pixel images,
variance, standard deviation, mode, average of
structure pixels, average of background pixels,
difference of structure and background averages, and
Weber Ratio were preselected for the production of
learning model. It is noteworthy that not all
attributes used in the training stage will be employed
for the classification of structures, since some of the
image characteristics are not considered relevant by
the algorithms, and they are automatically discarded
by WEKA tool. In order to define which attributes
will be used, an automatic selector
(AtributteSelection) was used, which is implemented
by the WEKA tool.
Table 1 represents the attributes extracted from
each structure also used in the training stage, where
p
e
(i,j) and p
b
(i,j) are the grayscale of pixels in the
inner region (structure) and outer (background) of
the filter with size w*h at position (i,j) of the image.
The filters used in the correlation operations are
composed of two parts, the inner and outer region,
illustrated in Figure 2. The inner region tries to
match the inside structure, while the outer region
tries to match the background.
Table 1: Attributes selected from the image after the
detection of the structures of interest.
Attribute Equation
Average of the structure
pixels
w
i
h
j
e
e
hw
jip
11
)*(
),(
Average of the background
pixels
w
i
h
j
b
b
hw
jip
11
)*(
),(
Difference of the average
grayscale of the structure
pixels and background
Δµ = µ
e
– µ
b
Weber Ratio
(GONZALES; WOODS,
2002)
e
W
A total of 100 clusters of high contrast detail
were extracted from these images for training
purposes. These structures were classified by experts
according to their visibility, i.e., if they are visible or
not. It is noteworthy that the image reports were
produced by two or more technicians, in order to
reduce the subjectivity of visual inspection,
increasing the system consistency.
In the training stage a file is created from the
default format of the WEKA (.ARFF), with all the
input data mentioned above. Then, the J48 algorithm
of the WEKA is used to generate the decision tree
for each structure of interest. To produce and test
the learning models, leave-one-out cross-validation
was used.
In the classification stage the decision trees are
implemented based on models obtained in the
training stage. One hundred images were used for
classification tests, with 500 clusters of high contrast
details analysed. It is important to note that the
images produced in the classification step are
distinct from those of training.
BIOSIGNALS 2012 - International Conference on Bio-inspired Systems and Signal Processing
416
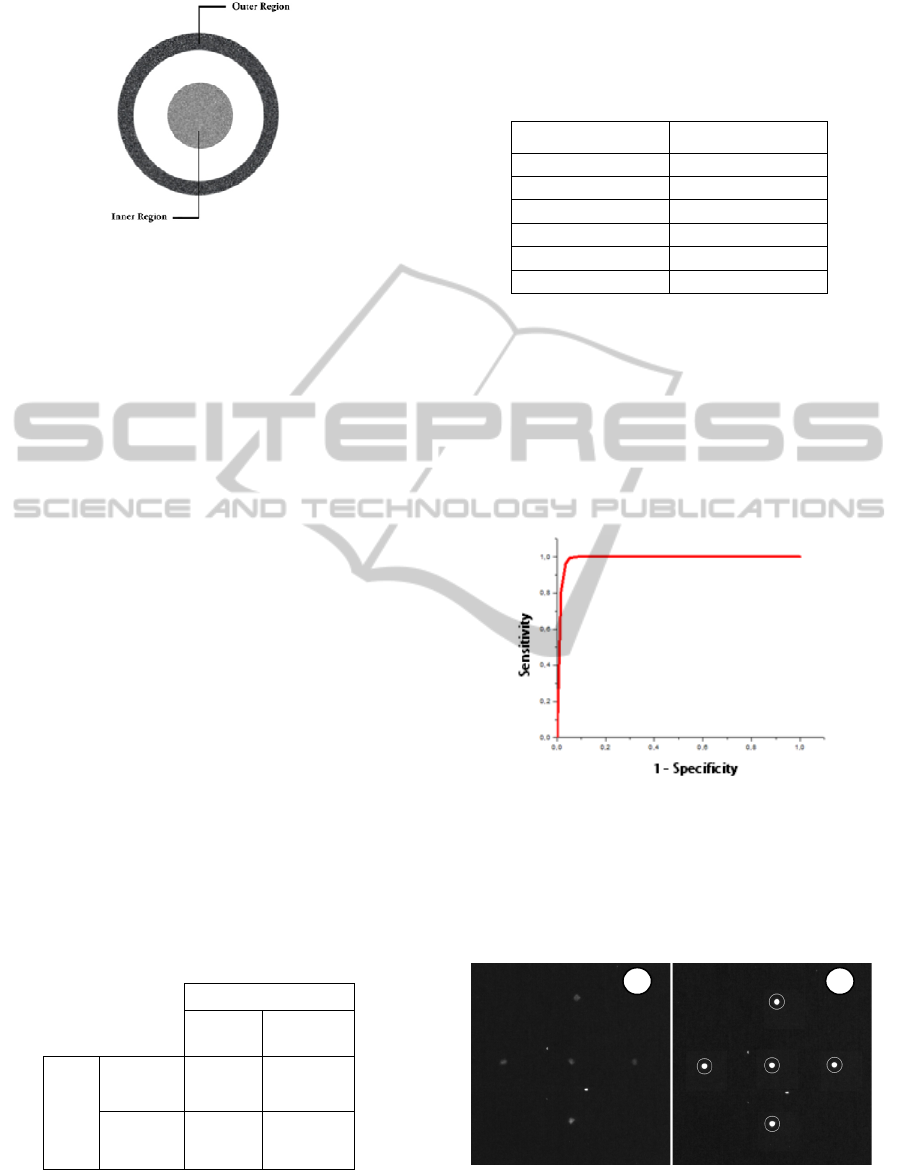
Figure 2: Example of the filter used for the detection and
the classification of a high contrast detail of the phantom
image.
From the classification of these structures and
the comparison between the expert reports and the
reports produced by software, it is possible to
determine statistical measures such as accuracy and
efficiency.
The software behaviour is evaluated using ROC
curves for each structure of interest, where the
sensitivity and specificity of the system are verified
(Zweig and Campbell, 1993). According to the
attribute automatic selector of the WEKA, Δμ is the
attribute that was always present in all models.
Because of this, in the development of the ROC
curves the attribute values of Δμ were varied ranges
[20,000; 50,000], since this was the most important
attribute in the training stage in all structures of
interest.
3 RESULTS
The classification results using the J48 algorithm
produced the misclassification tables for each kind
of structure of interest, indicating the accuracy rates
of the classification. These measures are presented
in Table 2.
Table 2: Misclassification table of the high contrast
details.
J48 Classification
Visible
Not
Visible
Expert
Classification
Visible 0.99 0.01
Not
Visible
0.00 1.00
Table 3 presents the rates of accuracy,
sensitivity, specificity, efficiency, positive prediction
and negative prediction, and Matthews coefficient to
the classification of each structure of interest.
Table 3: Effectiveness measures of the software to the
classification of the high contrast details using the J48
algorithm.
Measure Value
Accuracy 0.9906
Sensitivity 0.9882
Specificity 1.0000
Efficiency 0.9941
Positive Prediction 0.9882
Negative Prediction 1.0000
The sensitivity values were very close to the
positive predictions. This occurs because of the high
number of high contrast details compared to the low
rate of predictive errors (false positives and false
negatives). The same applies to the specificity and
negative prediction values.
Figure 3 allows observing the behaviour of the
system to the structures classification by ROC
curves.
Figure 3: ROC Curves to the classification of the high
contrast details (AUC = 0.98).
Figure 4 shows the marking of a high contrast
detail group detected correctly even with the
presence of the artefacts in a phantom image after
the processing by system.
Figure 4: (A) High contrast detail group with the presence
of the artefacts, before the processing and (B) the same
group detected after the image processing.
A
B
A COMPUTER AIDED DETECTION SYSTEM FOR MICROCALCIFICATIONS IN BREAST PHANTOM IMAGES
417

4 DISCUSSIONS AND
CONCLUSIONS
This research presents a method for localizing and
classifying, with high precision, high contrast details
clusters in phantom images. The next step of this
work consists of executing comparative tests
between the techniques presented here with
researches related to the theme.
Statistical measures of the software, which were
presented in the previous section, suggest that the
classification of the structures of interest closes with
the expert vision of the AGEVISA-PB.
Despite of the size of the structures which
simulate the microcalcifications and the possibility
of the confusion with noise, the classification of
these groups represented high success rate of the
system (99.41%). These results are due to the
reduction in size of search regions in the images in
each phantom, as well as the highest contrast of
these structures. With the well-defined boundaries of
the regions, the probability of artefacting the
artefacts and classification from the radiographic
film instead of structures of interest is reduced.
With the implementation of the system in the
AGEVISA-PB, planned for the coming months, it is
expected that the experts will learn how to use the
software and the reports generated by computer
analysis of the phantom images as an aid to the
visual inspection. Thus, part of the process for the
Quality Control in Mammography will be automated
and the subjectivity in the image evaluation may
well be reduced.
After usability tests with the experts and
improvements in the user interface, the system will
be introduced in the establishments which provide
mammography services, to execute their own quality
control in an efficient mode and with the appropriate
frequency.
ACKNOWLEDGEMENTS
CNPq, CAPES and SESU / MEC for the support in the
form of research scholarships and funding.
REFERENCES
Byng, J. W.,Yaffe, M. J., Lockwood, G. A., Little, L. E.,
Tritchler, D. L., Boyd, N. F., 1997. “Automated
analysis of mammographic densities and breast
carcinoma risk.” America Cancer Society. Cancer
80(1):66-74.
Barufaldi, B., Santana, E.F., Batista, L.V., Schiabel, H.,
2011. “Sistema para Controle de Qualidade de
Mamógrafos Através da Análise Computacional de
Imagens de Phantom Utilizando a Ferramenta
WEKA”. In Workshop de Visão Computacional,
Universidade Federal do Paraná, p.16-21.
Carvalho, J. F. G., Silva, M. F. M. P., Lins, M, F. B. P.,
Barbosa, H. T. L., Sousa, J. B., Silva, P. R., Caminha,
F. T., Bulcao, S. B., Morais, M. I., 2006. “AGEVISA-
PB – Relatório Anual de Atividades”.
CBR, 2001. Colégio Brasileiro de Radiologia. Boletim do
CBR nº 165, p. 21.
Gonzales, R. C., Woods, R. E., 2002. “Digital Image
Processing”, 2nd ed. Prentice Hall.
INCA, 2011. “Câncer de Mama: Controle de Qualidade
em Mamografia”. Avaiable em: <http://www2.inca.
gov.br/wps/wcm/connect/cancermama/site/home/contr
ole_qualidade_mamografia/>.
INCA, 2010. “Estimativa 2010: incidência de câncer no
Brasil / Instituto Nacional de Câncer”, ISBN 978-85-
7318-161-6 (98).
Martinez, E. H., Sanjurjo, R. L., 2009. “Minera de datos
aplicada a la detección de Cáncer de Mama”.
Universidad Carlos III de Madrid.
Medeiros, R. B., Elias, S., 2007. “Diagnóstico precoce e
mamografia digital”. Rev. imagem; 29(2): III-IV.
Porto, F. N., 2010 “Análise de Sensibilidade de um
Sistema CAD para Mamografia Digital”. Dissertação
de Mestrado, Universidade Federal de Minas Gerais.
Roveda Junior, D. et al. , 2007. Valores preditivos das
categorias 3, 4 e 5 do sistema BI-RADS em lesões
mamárias nodulares não-palpáveis avaliadas por
mamografia, ultra-sonografia e ressonância magnética.
Radiol Bras, São Paulo, v. 40, n. 2.
Soares, F. A. P., Lopes H. B. M., 2001. “Filme
Radiográfico e Processamento: Curso Técnico de
Radiologia”. Florianópolis: CEFET/SC.
Zweig, M. H.; Campbell, G., 1993. “Receiver-operating
Carachteristic (ROC) plots: a fundamental evaluation
tool in clinical medicine”. Clinical Chemistry, v.39,
n.4, p.361-577, 1993.
BIOSIGNALS 2012 - International Conference on Bio-inspired Systems and Signal Processing
418
