
NEUROPHYSIOLOGIC AND STATISTICAL ANALYSIS OF
FAILURES IN AUTOMATIC SLEEP STAGE CLASSIFICATION
Teresa Sousa, Dulce Oliveira, Sirvan Khalighi, Gabriel Pires and Urbano Nunes
Institute for Systems and Robotics (ISR-UC) and University of Coimbra, 3030-790, Coimbra, Portugal
Keywords: Automatic sleep stage classification, Failure analysis, Challenges in sleep staging.
Abstract: This paper analyses some of the challenges in automatic multiclass sleep stage classification. Six
electroencephalographic (EEG) and two electrooculographic (EOG) channels were used in this study. A set
of significant features are selected by a minimum-redundancy maximum-relevance (mRMR) criterion and
then classified using support vector machine (SVM). The system is tested on 14 subjects suspected of
having sleep apnea. The automatic sleep staging showed a 77.70% (±15.8) sensitivity and 95.49% (±2.68)
specificity. From the analysis comparing EEG records with visual and automatic classification, we found
that the main cause of failures are the similarities between adjacent phases of sleep, in particular in
discriminating N1 and N2. Based on the variation of the values of the features it is possible to implement
some thresholds and to apply some heuristic rules to improve the performance.
1 INTRODUCTION
Sleep is an active and regulated process with an
essential restorative function for physical and mental
health (Zoubek et al., 2007). Time courses of sleep
stages, based in polysomnography (PSG), are
commonly used to quantify sleep quality and
diagnose sleep-related disorders. The PSG signals
are segmented into epochs, and then
electroencephalographic (EEG) rhythms and other
parameters are estimated for each individual
segment. According to new criteria based on the
Rechtschaffen and Kales (R&K) rules, determined
by the American Academy of Sleep Medicine
(AASM) (Iber et al., 2007), sleep–wake cycle is
categorized into awake (W), non rapid eye
movement (NREM) and rapid eye movement (REM,
stage R) sleep stages. NREM sleep is further divided
into three stages: N1, N2 and N3.
Automated systems have emerged in the last
years to save time and to improve the agreement
levels of sleep scoring, (Zoubek et al., 2007;
Nicolaou and Georgiou, 2011). Some publications
can be found in the literature, describing problems
and challenges of the automatic sleep stage
classification (ASSC). In 2003, researchers
concluded that the strengths of the ASSC should be
the automatic removal of artifacts, a good
quantitative evaluation of delta waves, an automatic
analysis similar to visual analysis regarding
precision, reliability and reproducible results (Penzel
et al., 2003). Furthermore, the authors identified
main problems in ASSC: N1 and REM sleep are
difficult to distinguish due to similar EEG patterns
(EOG is indispensable); wakefulness and REM sleep
are difficult to distinguish because they depend
heavily of the electromyographic (EMG) signal; N2
may be difficult to define, if the person has only few
sleep spindles or if the spindle frequency is outside
the range of normal values (Penzel et al., 2003). Few
years later (Zoubek et al., 2007) reported that the
real challenge in automatic sleep analysis was to the
ability to discriminate accurately N1 from REM.
Recently, (Helland et al., 2010) concluded that fully
ASSC is achievable if ambiguities in the assignment
of sleep stages are solved. The authors verified that
removing sources of sleep stage ambiguity improves
classification considerably, in 10% overall, more
than the improvement achieved by including
features from the electrocardiogram (ECG) and
respiratory signal parameters.
Sleep Apnea Syndrome (SAS) is a sleep disorder
with a high prevalence which requires PSG for
diagnosis, starting therapy and subsequent treatment
initiation. Sometimes, first evaluations use also
continuous positive airway pressure (CPAP) and
multiple sleep latency test (MSLT). CPAP uses mild
423
Sousa T., Oliveira D., Khalighi S., Pires G. and Nunes U..
NEUROPHYSIOLOGIC AND STATISTICAL ANALYSIS OF FAILURES IN AUTOMATIC SLEEP STAGE CLASSIFICATION.
DOI: 10.5220/0003792304230428
In Proceedings of the International Conference on Bio-inspired Systems and Signal Processing (BIOSIGNALS-2012), pages 423-428
ISBN: 978-989-8425-89-8
Copyright
c
2012 SCITEPRESS (Science and Technology Publications, Lda.)
air pressure to keep the airways open while the
subject sleeps. MSLT is used in the assessment and
diagnosis of disorder of excessive somnolence and
to evaluate daytime sleepiness in relation to various
therapeutic or experimental manipulations
(Carskadon, 1986). SAS is clinically relevant when
the breath stops during more than 10 seconds and
occurs more than five times per hour of sleep,
causing arousal from sleep (AASM, 1999).
According to the American Sleep Disorders
Association (ASDA) an arousal is defined as “an
abrupt shift in EEG frequency, which may include
theta, alpha and/or frequencies greater than 16 Hz
but not spindles”. The arousal must last ≥3 seconds
and it must be accompanied by an increase in chin
EMG if it occurs during REM sleep (Bonnet et al.,
1992). Some aspects, such as rapid fluctuations of
sleep and drowsiness gain importance in ASSC of
apnea patients (Tsara et al., 2009; Penzel et al.,
2003).
In this paper the failures of an ASSC algorithm
were studied relating neurophysiologic patterns with
possible causes of machine pattern classification
failing, aiming to identify ways to improve ASSC.
The proposed classification algorithm uses temporal,
parametric and time-frequency features extracted
from six EEG and two EOG channels. A maximal
overlap discrete wavelet transform (MODWT) is
used to decompose EEG and EOG signals at
different resolutions. A support vector machine
(SVM) classifies transformed and normalized
features previously selected by a minimum-
redundancy maximum-relevance (mRMR) algorithm
(Peng et al., 2005). Furthermore, a median filter is
used to enhance the classification accuracies.
2 MATERIALS AND METHODS
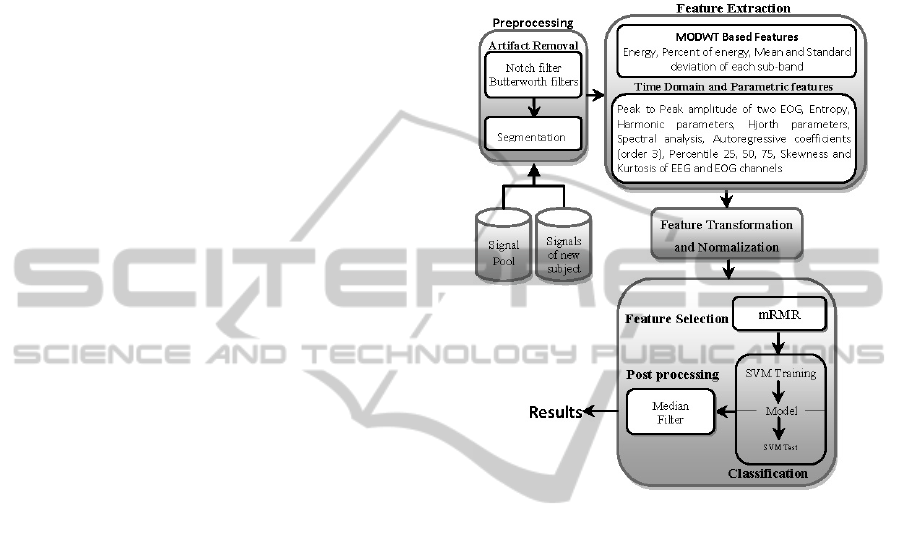
The proposed system consists of six consecutive
steps, as depicted in Figure 1 (Khalighi et al., 2011).
2.1 Data Acquisition and Preprocessing
A Laboratory of Sleep provided data from all-night
PSG records acquired by SomnoStar Pro (Viasys
SensorMedics), each with duration of almost 8
hours. Our dataset comprises data from fourteen
subjects with ages between 22 and 79 years old
(mean = 56 years; std = 17.11 years; four females).
The six EEG channels (F3-A2, C3-A2, O1-A2, F4
A1, C4-A1, O2-A1) and two electrooculographic
(EOG) channels (right EOG – R- EOG-A1; and left
EOG – L-EOG-A2) used in our evaluation were
recorded at a sampling frequency of 200 Hz. A
notch filter at 50 Hz and a bandpass Butterworth
filter with lower cutoff of 0.5 Hz and higher cutoff
of 45 Hz were used. The sampled EEG and EOG
signals are divided into segments of 30 seconds each
(epoch).
Figure 1: ASSC System Architecture.
From the 14 subjects, 9 are analyzed with PSG
basal, 3 with PSG CPAP and the last 2 with MSLT.
SAS has been diagnosed in 50% of the subjects.
2.2 Feature Processing, Classification
and Post Processing
After preprocessing, features are extracted using
several methods in the time-frequency, temporal and
frequency domain as illustrated in Figure 1. The
extracted features are transformed in order to change
the distribution of the features. Each feature of the
transformed matrix is independently normalized to
the [0, 1] range to avoid features in greater numeric
ranges dominating those in smaller numeric ranges,
and to avoid numerical issues during the
classification. Moreover, a reduction in the
dimension of the raw input variable is done by
mRMR algorithm (Peng et al., 2005). In our
algorithm the SVM (Burges, 1998) was adopted to
handle the classification process. Non-stationary
transients were eliminated by a post processing
median filter as described in (Doroshenkov et al.,
2007).
BIOSIGNALS 2012 - International Conference on Bio-inspired Systems and Signal Processing
424
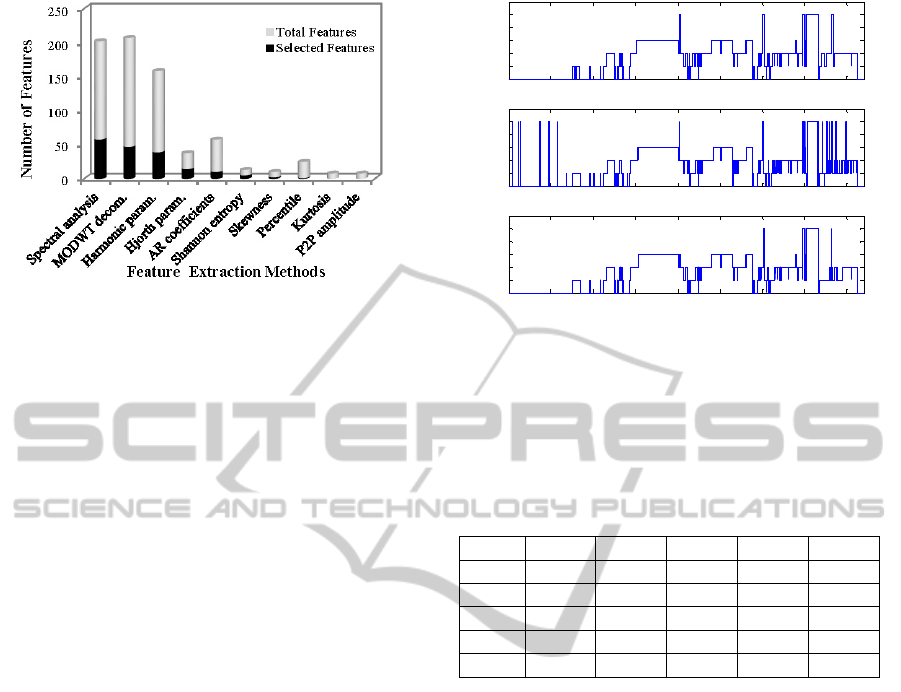
Figure 2: Selected features by mRMR. All features are
extracted from 6 EEG and 2 EOG channels except the
peak to peak (P2P) amplitude that was extracted only from
the EOG channels.
3 EXPERIMENTAL RESULTS
AND DISCUSSION
The performance of the algorithm was assessed
using the datasets of the fourteen-subjects mentioned
in section 2.1. In the experiments, a fourth-order
Daubechies with MODWT decomposition was
adopted. Libsvm toolbox (Chang and Lin, 2011)
with sigmoid kernel degree and C parameters were
set to 0.13 and 1.25 respectively, as they produced
the best empirical results. The classification
accuracy was determined by using Leave-One
subject-Out Cross-Validation (LOOCV). Extracted
features and respective number of selected features
by mRMR, are presented in Figure 2. The most
relevant features were extracted from spectral
analysis (58 selected features) and MODWT
decomposition (47 selected features); the least
effective ones were kurtosis and peak to peak
amplitude.
Figure 3.a shows the hypnogram of one subject
obtained from visual scoring (VS), and Figure 3.b
the hypnogram obtained from automatic scoring
(AS) through the optimal set of features and without
applying the median filter. After median filtering
(Figure 3.c), the hypnogram presents a percentage of
agreement with VS 12% higher than that achieved
without median filter. The confusion matrix obtained
for all datasets after filtering is presented in Table 1.
The columns (j) represent the stages classified by the
SVM classifier and the rows (i) represent the stages
determined by the experts. The misclassification
occurs essentially between adjacent stages, as
reported before by (Zoubek et al., 2007). In the
classification of stage REM, the errors were mainly
Figure 3: Hypnograms resulting from a) VS; b) AS
without median filter (MF) and c) AS with MF.
Table 1: Confusion matrix obtained with SVM classifier
after post processing using the optimal set of features.
Each case (i,j) corresponds to the number of examples
classified as i by experts and j by the ASSC algorithm,
expressed as a percentage of the examples classified as i
by the experts.
(i,j)% W N1 N2 N3 R
W 92.56 5.66 0.28 0.00 1.49
N1 11.59 53.01 26.47 0.00 8.92
N2 0.03 6.09 86.04 7.09 0.75
N3 0.85 0.12 13.44 85.59 0.00
R 8.78 11.74 6.93 1.27 71.28
due to a wrong assignment to N1 followed by stage
W. This observation can be explained by the
transitions between stages that commonly occur
during sleep (Kim et al., 2009). Figure 4 contains
the transition probabilities (
) from stage to
stage , extracted from a representative dataset,
calculated according to
=[
=
|
=]
(1)
The probability of transition from stage REM to N1
is higher (4.65%) than from REM to the other
stages. Therefore the misclassification of REM sleep
has a higher probability to be associated with a
wrong attribution of N1. Furthermore, from Table 1
it is verified that the method fails particularly in N1,
namely 46.98% of the epochs visually labelled as N1
were misclassified as N2 (26.47%) and as stage W
(11.59%), which leads to a very low sensitivity
(53%). This is due to the fact that, the classifier fails
in discriminating stages with similar
neurophysiologic patterns. For instance, stage W and
N1 can have both alpha rhythms.
0 100 200 300 400 500 600 700 800
W
N1
N2
N3
R
0 100 200 300 400 500 600 700 800
W
N1
N2
N3
R
0 100 200 300 400 500 600 700 800
W
N1
N2
N3
R
Epochs
a)
b)
c)
NEUROPHYSIOLOGIC AND STATISTICAL ANALYSIS OF FAILURES IN AUTOMATIC SLEEP STAGE
CLASSIFICATION
425
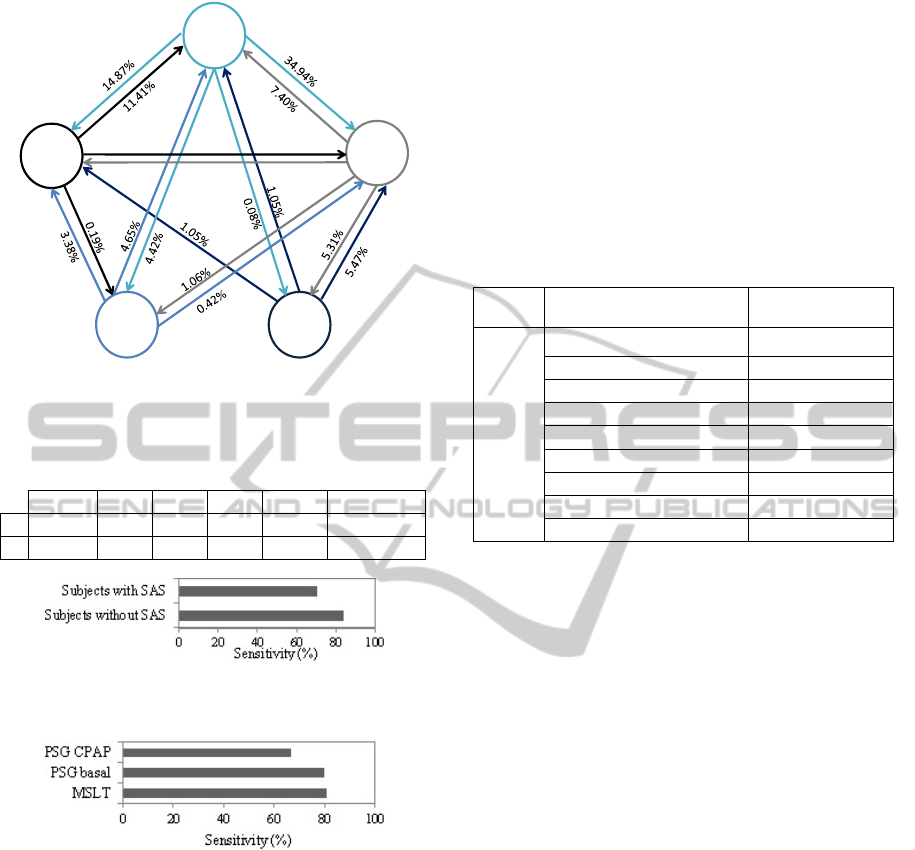
Figure 4: Sleep stages transitions probabilities for a
representative dataset.
Table 2: Statistic analysis results of multiclass sleep
classification (Se: sensitivity; Sp: specificity).
W N1
N2 N3 R Total
Se 92.56 53.01 86.04 85.59 71.28 77.70±15.8
Sp 96.75 94.81 90.59 97.10 98.19 95.49±2.68
Figure 5: Sensitivity of classification in subjects with and
without SAS.
Figure 6: Sensitivity of classification in subjects analyzed
with PSG CPAP, PSG basal and MSLT.
Table 2 shows that the best sensitivity value was
achieved in stage W. Specificityhas the highest and
lowest values for REM and N2 stages, respectively.
The percentage of time in N1 is about 10%. The
highest number of failures related to N1
classification is maybe due to the lower number of
existing epochs in this stage to train the classifier
(Doroshenkov et al., 2007). Regarding the high
number of epochs visually classified as W and N2
stages, the ASSC algorithm shows better
performance in the classification of W (92.56%) and
N2 epochs (86.04%).
Figure 5 shows the mean sensitivity of the sleep
classification in subjects with and without SAS. The
observed difference, almost 15%, is probably related
to a large number of muscular artifacts, repetitive
arousals, deep sleep fragmentation with rapid
changes of sleep stages, unclear slow wave sleep and
unclear REM sleep. Results in Fig. 6 show that the
classification algorithm loses sensitivity, about 15%,
when subjects are examined with PSG CPAP.
However, as mentioned before, only 3 subjects of
the dataset were analyzed with this technique,
therefore the results are not conclusive.
Table 3: Incidence of 428 misclassified epochs in ASSC.
Total Related sleep stages Incidence (%)
428
N1 and W 25.47
N2 and N3 23.13
N1 and N2 21.03
W and R 11.45
N1 and R 8.41
N2 and R 4.67
N2 and W 3.97
W and N3 1.17
N1 and N3 0.70
3.1 Failures in Classification
In order to find the relation between the failures of
ASSC and neurophysiologic patterns, we analysed in
detail four subjects of our database, namely those
presenting the best, medium and two worst values of
sensitivity. Based on the first 500 epochs of each
subject (2000 epochs), a total of 428 failures were
found. The possible misclassification causes occur
by the following order of frequency: problems
related to unclear differences in frequency; non-
detection of the slow activity rate; artifacts; non-
apparent cause; non-detection of specific patterns of
sleep (e.g., sleep spindles); arousals; complex
classification even in visual scoring. From the 428
analyzed epochs, the incidence of classification
failures in different groups of sleep stages is
described in Table 3. The misclassification of stage
W and N1 was, in 56.88% of the cases, due to
problems that should be solved through spectral
analysis. Moreover, between stages N2 and N3, the
main cause of failures (67.68%) is related to
problems that should be solved through analysis of
slow activity rate. Misclassification between N1 and
N2 is mainly related to two problems: cases with
non-apparent reasons or cases that are visually
classified based on sequence of activity (33.33%),
and cases in which the classifier is unable to detect
sleep spindles and K complexes (30%). The
problems in classification of stages W and REM
N1
45.69%
N2
82.48%
N3
92.42%
R
91.54%
W
87.43%
0.97%
3.74%
BIOSIGNALS 2012 - International Conference on Bio-inspired Systems and Signal Processing
426
(a)
(b)
(c)
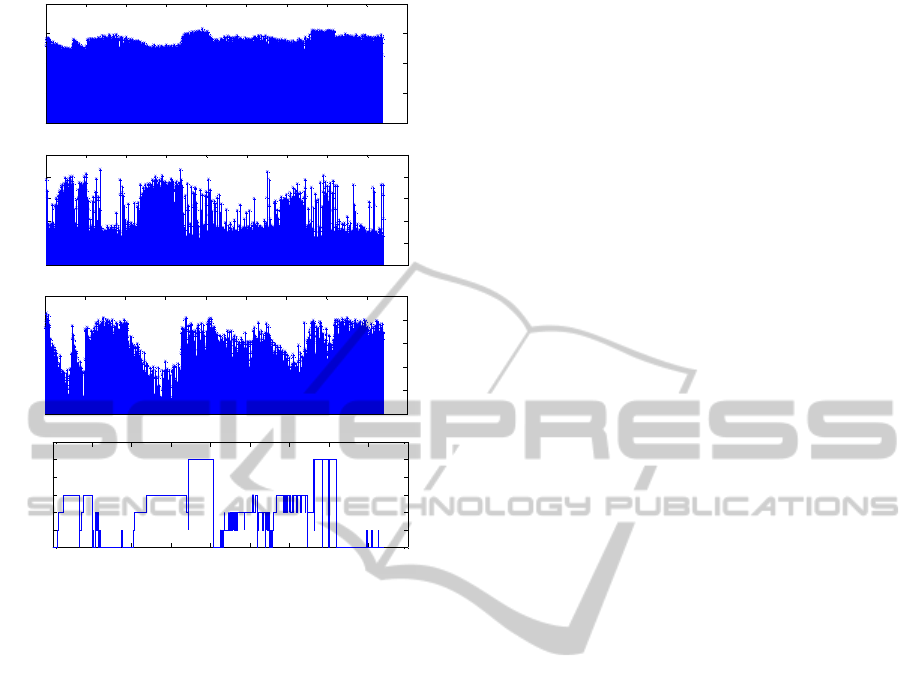
(d)
Figure 7: a) Distribution of sub-band beta 1 (16-25 Hz)
during the sleep; b) Distribution of percentile 75th during
one night of sleep; c) Distribution of one wavelet feature
during the sleep; d) Sleep visual classification.
were mainly caused by artifacts interference
(63.27%). Currently, the classifier is not taking full
advantage of the EOG signal and therefore new
extraction methods applied to EOG should be
investigated to increase detection of stage REM. In
37.04%, misclassification of stages REM and N1 did
not show evident reason. Epochs with difficult VS
represent 25% of the classification failing and
represent 50% of the classification failing between
N2 and REM. To mitigate problems in
differentiating stages N2 and W, the detection of
sleep arousals is crucial (41.18%). Moreover, cases
in which alpha activity exists and the epoch is
classified as N2 (41.18%) have to be solved. In cases
of misclassification of stages W and N3 or N1 and
N3 the causes are related to artifacts and sleep
arousals, respectively.
In transitions between N2 and N3, the problems
in AS are common. This fact is related with the
percentage of slow activity in one epoch. According
to R&K rules when one epoch without patterns of
N2 (K complexes and sleep spindles) has more than
20% of slow activity, it should be classified as N3.
Heuristic rules concerning these thresholds are not
coped in our ASSC algorithm.
Figure 7 shows the behavior of some features
during sleep of one night. These features have
abnormal values in specific cases of
misclassification. When the subject was awake or in
REM sleep, spectral values of sub-band beta 1 (16-
25 Hz) were higher than other stages (Figure 7.a).
Furthermore, failure in the classification of stage W
seems related with spectral features. Spectral values
of epochs, in which stage W was misclassified as
N1, were lower than in other epochs. The 75th
percentile in Fig 7.b) defines the value below which
75% of the observed values fall. . Comparing the
distribution of percentile values during the sleep
(Figure 7.b) with sleep hypnogram (Figure 7.d) we
reached the conclusion that the75th percentile is one
important feature in classification of N3. The highest
values of percentile are in N3, since this feature
provides some information about the amplitude of
the signal. Low values of this feature contributed to
a misclassification of this stage as N2. In instances
of misclassification of N3 as being N2, wavelet
features revealed inappropriate (high values). During
the sleep these features present the lowest values in
N3 (Figure 7.c).
4 CONCLUSIONS
Despite the global good results, the proposed
algorithm presented sensitivity 15% lower for
subjects diagnosed with SAS. The main reason is
related to large number of movement artifacts and
repetitive arousals. To improve the robustness of the
algorithms, the detection of sleep disruption such as
arousals and awakenings is crucial and may be
suitable for the diagnosis of SAS. Furthermore, new
approaches must be investigated to solve the
incorrect classification between adjacent phases.
The worst values of sensitivity occurred in
classification of N1. Through neurophysiologic
analysis of failures we found that false negatives in
classification of N1 (Table 1) can have two main
reasons: percentage of alpha activity presented in
epoch and artifacts that worsen frequency analysis.
High number of false positives in stage N2 lead to
the worst value of specificity (Table 2), mainly due
to problems in the definition of slow wave rate
required to classify an epoch as N3. Regarding this
analysis it was showed that the ASSC algorithm fails
according to different causes, stage of the sleep, and
nature of base EEG activity of the subject.
The major goal of the paper was to provide
results of a failure analysis in automatic sleep stage
0 100 200 300 400 500 600 700 800 900
0
0.5
1
1.5
2
Epochs
0 100 200 300 400 500 600 700 800 900
0
0.2
0.4
0.6
0.8
1
Epochs
0 100 200 300 400 500 600 700 800 900
0
0.2
0.4
0.6
0.8
1
Epoc hs
0 100 200 300 400 500 600 700 800 900
W
S1
S2
S3
REM
Epochs
R
N3
N2
N1
W
NEUROPHYSIOLOGIC AND STATISTICAL ANALYSIS OF FAILURES IN AUTOMATIC SLEEP STAGE
CLASSIFICATION
427

classification and to find solutions to improve the
results. Regarding the list of detected failures, there
are some proposals to study and to apply in our
algorithm: implement threshold levels to feature
values adjusted for each patient; define some
heuristic rules helping the discrimination of adjacent
phases; apply artifact removal techniques; develop
detection techniques of K-complexes, sleep spindles
and arousals. For a more robust performance
assessment, the classification algorithm has to be
validated in a larger database and the manual scoring
should be provided by at least two experts to be
more conclusive about results.
ACKNOWLEDGEMENTS
This work has been supported by the QREN funded
project SLEEPTIGHT, with FEDER reference
CENTRO-01-0202-FEDER-011530.
REFERENCES
AASM, 1999. Sleep-Related Breathing Disorders in
Adults: Recommendations for Syndrome Definition
and Measurement Techniques in Clinical Research.
The Report of an American Academy of Sleep
Medicine Task Force. In Sleep, 22(5).
Bonnet, M., Carley, D., Carskadon, et al., 1992. EEG
Arousals: Scoring Rules and Examples. Sleep
disorders atlas task force of American Sleep Disorders
Association and Sleep Research Society. In Sleep,
15(2):173–184.
Burges, J., 1998. A Tutorial on Support Vector Machines
for Pattern Recognition. In Data Mining and
Knowledge Discovery, 2.
Carskadon, M., 1986. Guidelines for the Multiple Sleep
Latency Test (MSLT): A Standard Measure of
Sleepiness. In Sleep, 9(4):519–524.
Chang, C., Lin, CJ., 2011. LIBSVM: a library for support
vector machines. In ACM Transactions on Intelligent
Systems and Technology, 1–39. Software available at
http://www.csie.ntu.edu.tw/~cjlin/libsvm.
Doroshenkov, L., Konyshev, V., Selishchev, S., 2007.
Classification of human sleep stages based on EEG
processing using hidden markov models. In
Biomedical Engineering, 41(1):25–28.
Helland, V., Gapelyuk, A., Suhrbier, A., et al., 2010.
Investigation of an Automatic Sleep Stage
Classification by Means of Multiscorer Hypnogram. In
Methods Inf. Med.,4:1–6.
Iber, C., Ancoli-Israel, S., Chesson, A., Quan, S., 2007.
The AASM manual for the scoring of sleep and
associated events: rules, terminology and technical
specifications. In 1th: Westchester, Illinois: American
Academy of Sleep Medicine.
Kim, J., Lee, J., Robinson, P., Jeong, D., 2009. Markov
Analysis of Sleep Dynamics. In Physical Review
Letters, 102:178104-1–4.
Khalighi, S., Sousa, T., Oliveira, D., Pires, G., Nunes, U.,
2011. Efficient Feature Selection for Sleep Staging
Based on Maximal Overlap Discrete Wavelet
Transform and SVM. In 33rd International
Conference of the IEEE Engineering in Medicine and
Biology Society (EMBC11), USA.
Nicolaou, N., Georgiou, J., 2011. The use of permutation
entropy to characterize sleep electroencephalograms.
In Clinical EEG and Neuroscience, 42(1):24–28.
Peng, H., Long, F., Ding, C., 2005. Feature selection
based on mutual information: criteria of max-
dependency, max-relevance, and min-Redundancy. In
IEEE Transactions on Pattern Analysis and Machine
Intelligence, 27(8):1226–1238.
Penzel, T., Kesper, K., Gross, V., Becker, H., Vogelmeier,
C., 2003. Problems in Automatic Sleep Scoring
Applied to Sleep Apnea. In 25 th Annual International
Conference of the IEEE EMBS, Sept. 17-21, 358–361.
Torkkola, K., 2003. Feature Extraction by Non-Parametric
Mutual Information Maximization. In Journal of
Machine Learning Research, 3:1415–1438.
Tsara, V., Amfilochiou, A., Papagrigorakis, et al., 2009.
Definition and classification of sleep related breathing
disorders in adults: Different types and indications for
sleep studies (Part 1). In Hippokratia, 13(3):187–191.
Young, T., Palta, M., Dempsey, Y., Skatrud, J., Weber, S.,
Badr, S., 1993, The occurrence of sleep disorder
breathing among middle aged adults. In The New
England Journal of Medicine, 328(17):1230–1235.
Zoubek, L., Charbonnier, S., Lesecq, et al., 2007. Feature
selection for sleep/wake stages classification using
data driven methods. In Biomedical Signal Processing
and Control, 2(3):171–179.
BIOSIGNALS 2012 - International Conference on Bio-inspired Systems and Signal Processing
428
