
IMPROVED ROBUST PERFORMANCE IN A SYSTEM
FOR AUTOMATIC ADMINISTRATION OF A VASOACTIVE DRUG
Nicol
`
o Malagutti
1∗
, Arvin Dehghani
2
and Rodney A. Kennedy
1
1
Research School of Engineering, The Australian National University, Canberra, Australia
2
Department of Electrical & Electronic Engineering, The University of Melbourne, Melbourne, Australia
Keywords:
Drug delivery, Automatic control, Robust control, Adaptive control, Blood pressure, Intensive care, Anaes-
thesia.
Abstract:
The problem of automatic administration of vasoactive drugs to regulate mean arterial pressure in surgical
and postsurgical patients can be considered as a setpoint tracking problem involving a system which is char-
acterised by significant modelling uncertainty in the form of uncertain parameters, unmodelled dynamics and
disturbances. Yet, specific levels of performance are required and patient safety must be guaranteed. As part
of the development process of a novel Multiple-Model Adaptive Control (MMAC) architecture for this appli-
cation, we have adopted a mixed-µ synthesis approach to controller design. Simulation results show that the
new controllers are capable of improved disturbance rejection and robustness even in the face of large system
delays and parametric uncertainty.
1 INTRODUCTION
The cardiovascular system is a critical system of
the human body and its operation within a restricted
range of operating points is essential to life. Seve-
ral physiological control pathways naturally exist to
respond to external stimuli while ensuring adequate
flow rates and pressures in the system (Batzel et al.,
2007). Failure to maintain a suitable operating point
(cardiovascular decompensation) can lead to severe
organ damage or even death. For this very rea-
son, patients at risk of decompensation require con-
tinuous monitoring of their condition and possibly
administration of suitable drugs to ensure that their
cardiovascular system (the plant) does not drift too
far from its physiological operating point. In some
cases, clinicians may even wish to set and maintain a
non-physiological operating point, e.g., a lower blood
pressure to facilitate surgery (Furutani et al., 1995).
From an engineering point of view, drug admini-
stration to artificially maintain cardiovascular param-
eters at a desired set point is a closed-loop control
problem where the human operator acts as the con-
troller. In current practice, successful stabilisation
of a patient relies on the skill and experience of the
clinical staff as well as their alertness and ability to
identify and respond to early signs of destabilisation.
Given the critical nature of this task, the creation of
∗
Corresponding author name.surname@anu.edu.au.
a safe and robust automatic control system capable
of maintaining haemodynamic stability in a patient
would be of great clinical interest. Such an automatic
system could reduce patient risk by removing human
error, as well as improve health outcomes and lower
healthcare costs through the automation of tasks and
the optimisation of drug dosing (Bailey and Haddad,
2005).
The work herein targets the specific issue of regu-
lating mean arterial pressure (MAP) by automatic in-
fusion of a vasodepressor drug, typically sodium ni-
troprusside (SNP). Administration of vasodepressors
is generally required for the treatment of acute hy-
pertension in patients in the intra- and postoperative
setting. The idea of applying closed-loop control to
automate drug administration in this context has been
analysed by several authors over the last two decades
(Isaka and Sebald, 1993; Bailey and Haddad, 2005;
Bequette, 2007, for a complete review). However,
to the authors knowledge, none of the solutions pro-
posed thus far have been commercially successful.
We have identified Multiple-Model Adaptive Control
(MMAC) as an appropriate framework to tackle this
problem. In a MMAC approach, it is assumed that
a patient’s response can be matched at any time with
that of one of several mathematical models included
in a model bank. A controller designed for the best
matching model is then placed into the feedback loop,
where it is expected to yield satisfactory performance.
In recent work (Malagutti et al., 2011), we have
282
Malagutti N., Dehghani A. and A. Kennedy R..
IMPROVED ROBUST PERFORMANCE IN A SYSTEM FOR AUTOMATIC ADMINISTRATION OF A VASOACTIVE DRUG.
DOI: 10.5220/0003794002820290
In Proceedings of the International Conference on Bio-inspired Systems and Signal Processing (BIOSIGNALS-2012), pages 282-290
ISBN: 978-989-8425-89-8
Copyright
c
2012 SCITEPRESS (Science and Technology Publications, Lda.)

Figure 1: Simplified patient model. T is the pure delay con-
stant; τ
1
= 50s, τ
2
= 30s, τ
3
= 10s are the time constants of
the first-order LTI subsystems; α = 0.5 is the recirculation
constant; K is the patient gain.
listed a number of issues which could ultimately af-
fect the safety of a MMAC system in the context of
MAP control. These can be described either as is-
sues pertaining plant modelling and robust controller
design, or intrinsic issues of multiple-model adap-
tive architectures such as safe controller switching. A
framework for the design of Robust MMAC systems
has recently been proposed by Fekri et al. (2006) and
we aim to evaluate its applicability to this biomedical
problem.
This paper presents our initial results in addres-
sing plant modelling and robust controller design is-
sues. More specifically, we question the range of un-
certainty which should be included in the plant model
and utilise a µ synthesis controller design technique
to achieve robust performance in the face of a large
parametric uncertainty set and system delays.
In Section 2, we review the first MMAC architec-
ture presented for this application (Martin et al., 1987)
and present some of its potential shortcomings. Sec-
tion 3 introduces a new system structure and describes
the controller design process. Section 4 presents the
results of a numerical simulation which highlights the
results of our design. Finally, Section 5 discusses the
results and presents open questions and issues.
2 PROBLEM DESCRIPTION
2.1 The Simplified Patient Model
The model describing the patient response to SNP in-
fusion used in Martin et al. (1987) is a modified ver-
sion of the linear model with delay of Slate (Slate
et al., 1979) and is shown in Figure 1. The transfer
function of this system is given by
Y (s)
U(s)
= e
−sT
K(τ
3
s + 1)
((τ
3
s + 1)(τ
2
s + 1) −α)(τ
1
s + 1)
(1)
Y
1
(s) = p
0
−Y (s), (2)
where U (s) is the rate of administration of the
drug, Y (s) is the drop in pressure caused by the drug,
Table 1: Model bank gain values and range of true plant
gains covered. SNP concentration 200 µg/ml.
Model no. Model Gain To suit Plant Gain
i K
i
(mmHg/(ml/h)) K (mmHg/(ml/h))
1 0.33 0.25 – 0.47
2 0.62 0.47 – 0.89
3 1.15 0.89 – 1.65
4 2.10 1.65 – 2.96
5 3.69 2.96 – 5.02
6 6.06 5.02 – 7.82
7 9.03 7.82 – 10.86
the output P(s) of the patient model is MAP, and p
0
is
the patient’s “natural” blood pressure, i.e., the value
of MAP which the patient would display in the ab-
sence of pharmacological intervention. All model pa-
rameters are deemed constant with the exception of
the gain parameter K, which can range between 0.25
and 9.5mmHg/(ml/hr) and the delay constant T which
can take any value up to 50s.
2.2 Closed-loop MMAC
The MMAC architecture of Martin et al. (1987) is
shown in Figure 2. In the closed-loop system, the
pressure output y
1
of the plant (patient) is compared
with that of a bank of 7 models designed using the
system in (1). See Table 1 for a list of gain val-
ues used. On the basis of the difference (residuals)
between the patient output and the model bank out-
puts, an iterative computation of weights is carried
out. Weights are assigned to the controllers in the
controller bank so that the controller corresponding to
the model which is most representative of the plant re-
ceives the largest weight. The control signal u is given
by the weighted average of the controller bank out-
puts. The effect of delay is compensated by utilising
a bank of 7 Smith’s predictors (one per each model in
the bank) having the following transfer function:
Y
∗
(s)
U(s)
=
K
i
(s + 0.033)
500(s + 0.1194)(s +0.02)(s + 0.014)
(1 − e
−sT
∗
)
(3)
Y
∗
1i
(s) = p
0
−
Y
∗
(s)
U(s)
, (4)
where K
i
is the value of K for the ith model in the
model bank as in (1) and T
∗
is the best available es-
timate of the plant delay. The closed loop also in-
cludes three nonlinear control signal limiters which
will not be discussed here due to space limitations and
we refer the reader to other works (Martin et al., 1987;
Malagutti et al., 2011).
The control performance requirements for the
closed-loop system are a maximum rise time of 10
minutes in the presence of a step setpoint change, a
IMPROVED ROBUST PERFORMANCE IN A SYSTEM FOR AUTOMATIC ADMINISTRATION OF A
VASOACTIVE DRUG
283
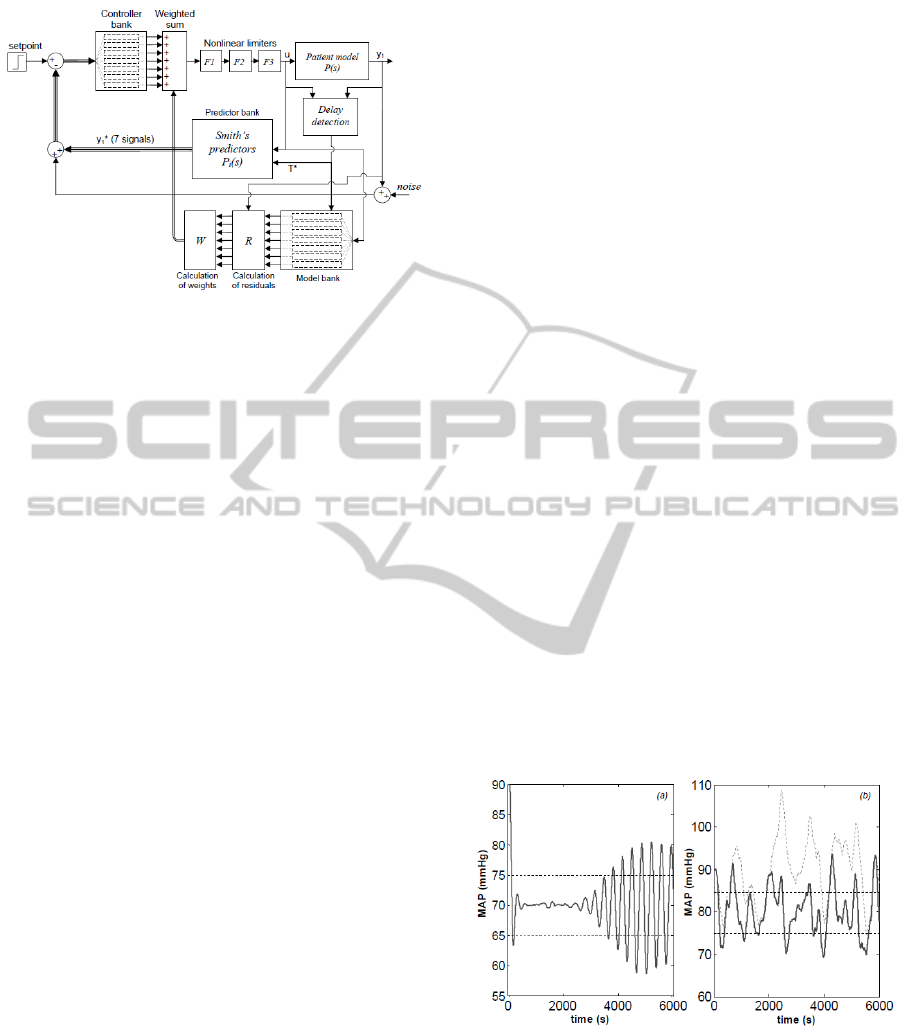
Figure 2: The MMAC architecture of (Martin et al., 1987).
The setpoint is expressed as the required MAP. Thicker ar-
rows and lines indicate vector signals.
maximum overshoot of 10 mmHg and a limit on drug
infusion rate of 600µg/(kg·h).
2.3 Modelling and Robustness Issues
In Malagutti et al. (2011), the closed-loop system
of Figure 2 was simulated under challenging ope-
rating conditions and instances of undesirable be-
haviour were generated. A number of these were
caused by the erroneous identification of the plant,
which led to the insertion of an inadequate controller
in the loop. In this paper, we neglect issues associ-
ated with plant-model matching and assume that the
correct plant model is identified, that is, the controller
associated with the appropriate gain range (Table 1) is
placed in the feedback loop at all times. We focus on
issues of plant and uncertainty modelling, which, in
our opinion, were oversimplified in earlier approaches
(Martin et al., 1987) leading to the design of con-
trollers which are not sufficiently robust. We have
identified three key aspects:
• the use of a Smith’s Predictor architecture causes
stability and performance to depend on an accu-
rate estimate of the plant delay, which may not be
guaranteed;
• the assumption that all parameters except gain K
are deemed constant may be too coarse;
• the assumption that parameter p
0
in equation (2)
is deemed constant may be unsuitable.
In Martin et al. (1987), it is asserted that delay
can be estimated, and that this estimation can take
place at each setpoint change of 20 mmHg or more.
We note that this poses a problem as the objective of
the control system is to maintain blood pressure sta-
ble and therefore multiple setpoint changes of con-
siderable amplitude (20 mmHg is a very significant
change in MAP) would be undesirable. Also, there is
no protection against a possible change in the delay
constant between setpoint changes. Here, we design
controllers which ensure robust performance over the
whole range of possible time delays.
It is difficult to critically evaluate whether the as-
sumption of considering constant plant parameters
with the exception of K is a reasonable one, as the
three time constants condense the behaviour of seve-
ral physiological systems. The parameter α, however,
has a clear pharmacodynamic significance and repre-
sents the extent to which the drug is removed from
the bloodstream. With the aim of achieving the safest
possible design, we deem it entirely plausible that this
value may undergo some changes during the course of
a procedure. Indeed, a different value (α = 0.4) has
been used elsewhere (Slate et al., 1979). In Martin et
al. (1987), the choice of considering K as the only un-
certain model parameters was justified by stating that
all changes to other parameters may be assimilated as
changes in K. We disagree with this as α does affect
the position of the system poles in (1) and therefore
may impact on closed-loop stability and performance.
Figure 3(a) shows that, using the control architecture
of Martin et al. (1987), undesirable oscillations may
occur in a system where the time constant has not
been identified properly and the recirculation constant
has changed, even when one assumes that the correct
controller is placed in the loop.
Finally, the architecture of Martin et al. (1987)
assumes that a “natural” value of MAP (p
0
) can be
determined for each patient. While this might be
Figure 3: Instances of undesirable behaviour from the sys-
tem of Martin et al. (1987) (horizontal dashed lines indicate
±5mmHg steady state error). (a): oscillations caused by
mismatch between the true plant and the model used in the
Smith’s predictor (T
∗
=10s vs T increasing linearly from
10 s to 50 s between t=1000 s and t=2600 s; true α of 0.6
instead of 0.5; K = 0.47 vs K
∗
= 0.33). (b): inability to
track the desired MAP in the presence of changes in p
0
(ex-
act match between true plant and Smith’s predictor model;
fine dashed curve represents p
0
with added low-frequency
SPD within the range ±20 mmHg).
BIOSIGNALS 2012 - International Conference on Bio-inspired Systems and Signal Processing
284
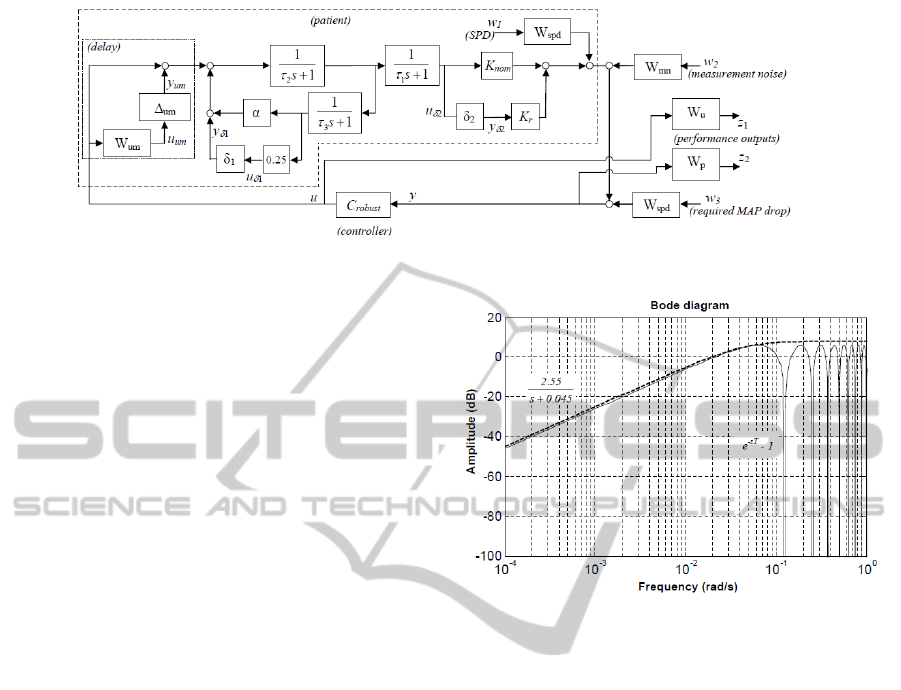
Figure 4: The system model used for robust controller design.
true in baseline conditions, events including renin-
angiotensin activation, breathing, trauma-induced
vasoconstriction and loss of blood volume through
bleeding (Batzel et al., 2007) can shift the natural
operating point of the cardiovascular system thereby
affecting p
0
. Furthermore, this change cannot be
detected through the sensor measurements, which
means that over time differences may arise between
the values of p
0
of equations (2) and (4), affecting the
error signal which is fed to the controller and thereby
degrading the control action. We note that a clinically
safe system should be able to contain these dynamics
and we refer the reader to Figure 3(b), which shows
the results of a simulation in which we added a so
called set-point disturbance (SPD) signal (generated
as filtered gaussian noise) to p
0
. The system set-up
of Martin et al. (1987) clearly fails to stabilise the
patient in these conditions, even when all other plant
parameters (α, K and T ) are exactly matched in the
Smith’s predictor.
3 DESIGNING FOR ROBUST
PERFORMANCE
3.1 Uncertainty Model and
Performance Requirements
The block diagram shown in Figure 4 includes the pa-
tient model of Figure 1 and introduces a description
of parametric uncertainty for the gain and recircula-
tion parameters:
α = 0.5 + 0.25δ
1
, K = K
nom
+ K
r
δ
2
,
δ
1
,δ
2
∈ R,|δ
1
| ≤ 1, |δ
2
| ≤ 1,
which is equivalent to assuming that α = (0.5 ± 0.25)
and K = (K
nom
± K
r
) where K
nom
represents the nom-
inal value of the gain parameter and K
r
is half the
width of the uncertainty range.
Delay is taken into account as an unmodelled dy-
namic of the system. As the maximum expected value
Figure 5: Upper bound (dashed) for the multiplicative
modelling error (solid) introduced by treating the patient
delay as an unmodelled dynamic.
of the delay is T = 50s, neglecting it would introduce
a multiplicative modelling error of e
−sT
− 1. This er-
ror can be bounded by the high-pass transfer function
W
um
as shown in Figure 5. In Figure 4, the unmodel-
led dynamic is represented by the blocks surrounded
by the dotted box. Its transfer function is
1 + ∆
um
·W
um
, ∆
um
∈ H
∞
, k∆
um
k
∞
≤ 1,
which is a conservative representation of all possible
patient delay dynamics for T ≤ 50 s.
In Figure 4, the control problem is redefined so
that controller design via µ synthesis can be per-
formed. In the new definition, we identify a sig-
nal called set-point disturbance, which is added to
the output of the plant and represents the possible
changes in the value of p
0
as discussed in Section
2. These are assumed to be in the form a low-
frequency signal and are generated using white noise
(w
1
: kw
1
( jω)k
∞
≤ 1) filtered by the LTI system W
spd
(Table 2). The same filter is also used as a command
prefilter for the reference signal (w
3
: kw
3
( jω)k
∞
≤ 1)
set by the clinician (we deem it reasonable to as-
sume the reference as slowly varying), which indi-
cates the required drop from the patient’s baseline
MAP, as measured at the beginning of the procedure.
IMPROVED ROBUST PERFORMANCE IN A SYSTEM FOR AUTOMATIC ADMINISTRATION OF A
VASOACTIVE DRUG
285

The transfer function W
spd
is a low-pass transfer func-
tion with a steady-state gain of 32dB as a range of
±40mmHg from baseline was deemed sufficient to
cover all possible setpoint requirements. The pole lo-
cation is such that the filter step response has a set-
tling time of less then 10 min, in order to comply with
the command following requirements of Section 2.2.
There is no specific reason other than computational
convenience behind our decision to use W
spd
as both a
disturbance colouring filter and a command prefilter.
Measurement noise is modelled as a random gaus-
sian signal (w
2
) filtered by high-pass filter W
mn
(Table
2). This generates a random, high-frequency noise
signal of magnitude ≤12 dB (±4 mmHg).
The reformulation of Figure 4 also includes two
weighting transfer functions which reflect the per-
formance requirements. The weighting function W
p
is the performance weight placed on the error sig-
nal (W
p
: kW
p
( jω)Y ( jω)k
∞
≤ 1); it imposes a maxi-
mum error of 6 dB (±2 mmHg) at steady state and
22 dB (±12.5 mmHg) at higher frequencies. The
weighting function W
u
places constrains the control
signal (W
u
: kW
u
( jω)U( jω)k
∞
≤ 1) in terms of maxi-
mum amplitude at low frequency (200 ml/hr, roughly
equivalent to the toxicity threshold for a 65 kg patient)
and penalises high-frequency control dynamics. This
requirement arises from the consideration that admi-
nistration would be provided through a motorised in-
fusion pump, which is likely to be unable to respond
to fast changes in infusion rate demands.
3.2 Controller Design via µ Synthesis
The new controllers were designed using the tech-
nique of mixed-µ synthesis. Due to the involved na-
ture of the µ synthesis approach, a detailed description
will not be provided here and interested readers may
consult specialised texts (Zhou et al., 1995). For the
scope of this paper it will be sufficient to explain that
the structured singular value µ—a commonly used
tool in H
∞
optimal control—is defined as
sup
ω∈R
+
µ(M( jω)) = (5)
sup
ω∈R
+
1
inf
∆( jω)
{σ(∆) : det(I − M∆) = 0}
Table 2: Transfer function (TF) reference table.
Block name TF Purpose
W
spd
40
(125s+1)
2
SPD and reference filtering
W
mn
s
0.25s+0.075
Measurement noise filter
W
p
(700s+1)
2
(2500s+1.4)
2
Weighting TF (output signal)
W
u
20s+200
80s+1
Weighting TF (control signal)
where σ indicates the maximum singular value and
the M–∆ structure is a particular form of the inter-
connected system as shown in Figure 6, and in our
particular problem
∆ =
δ
1
0 0 0
0 δ
2
0 0
0 0 ∆
um
0
0 0 0 ∆
p
, where
∆
p
∈ C
3×2
||∆
p
||
∞
≤ 1
.
In general terms, µ represents the inverse of the
minimum increase in plant uncertainty which would
result in the system being unable to meet the required
specifications with a particular controller C inserted in
the loop. A result derived from the small gain theorem
states that the closed-loop system is capable of robust
performance if µ ≤ 1 (Gu et al., 2005).
The µ synthesis approach involves an iterative
search, among the set of stabilising controllers C
s
, to
identify the controller which achieves the largest ro-
bustness margin, i.e., the smallest value of µ.
inf
C∈C
s
sup
ω∈R
+
µ(M( jω)) (6)
Software tools to conduct µ synthesis are available as
part of the Matlab Robust Control Toolbox. Specifi-
cally, we use the mixed-µ synthesis algorithm, which
can take advantage of the fact that the uncertainty
space of some of the model parameters is real and not
complex. This reduces, to some extent, the conserva-
tiveness of the resulting controller design.
3.3 Controller Design Results
As the technique of µ synthesis assists in the design of
controllers capable of yielding robust performance, a
key question is whether multiple controllers are ac-
tually required in order to meet the requirements of
this control problem. To address this, we used an ap-
proach similar to the design of the controller bank in
the Robust MMAC architecture (Feakri et al., 2006).
We programmed an iterative Matlab algorithm to de-
termine the maximum achievable performance of the
system as a function of the range of plant uncertainty
Figure 6: M–∆ interconnected structure for µ synthesis.
Note w = [w
1
w
2
w
3
], z = [z
1
z
2
].
BIOSIGNALS 2012 - International Conference on Bio-inspired Systems and Signal Processing
286
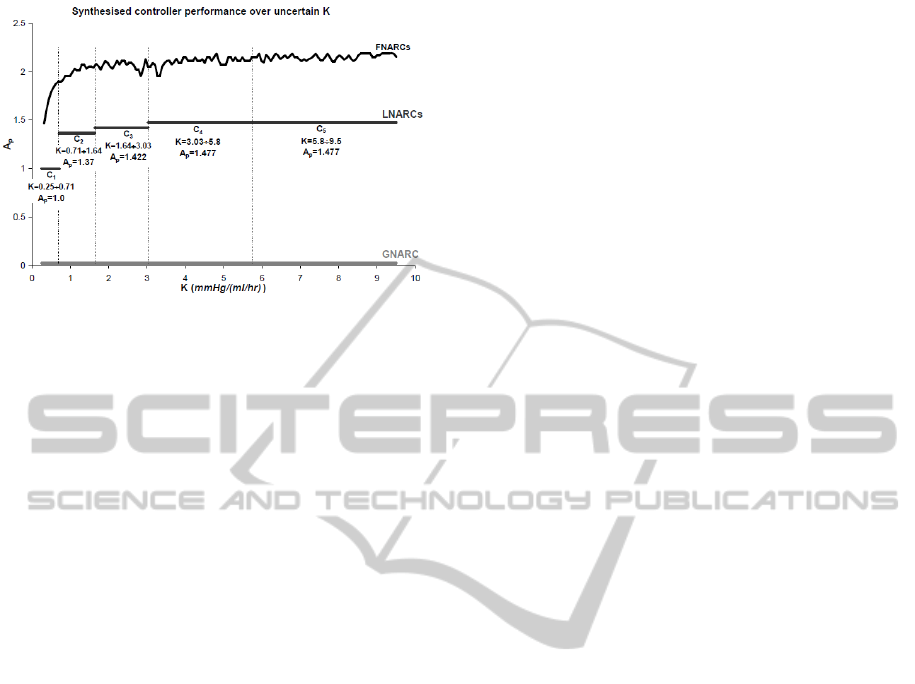
Figure 7: Results of GNARC, FNARC and LNARC con-
troller design instances. The graph shows the maximum
achievable performance A
p
as a function of the uncertainty
range of K considered.
considered. Achievable performance is rated accord-
ing to a scalar parameter A
p
which multiplies the per-
formance weight, i.e., W
∗
p
= A
p
·W
p
. The algorithm
operates as follows:
1. set A
p
=1;
2. set up the interconnected system of Figure 4, in-
clude the required amount of uncertainty and use
W
∗
p
as the performance weight on the error signal;
3. run the mixed-µ synthesis tool on the system ge-
nerated at step 2;
4. if the value of µ is jut below unity (0.985 ≤ µ ≤ 1),
A
p
is deemed to represent the maximum achiev-
able performance and the controller synthesised
at step 3 can ensure that performance level is met,
otherwise, A
p
is increased (for µ ≤ 0.985) or de-
creased (for µ ≥ 1) as required and another itera-
tion (starting at step 2) takes place.
Since the performance weights W
p
and W
u
represent
the required minimum performance for the system,
a final value of A
p
≥ 1 means that a controller ex-
ists such that the system can exceed the requirements,
while A
p
< 1 indicates that µ synthesis cannot pro-
duce a suitable controller to meet the required perfor-
mance over the considered uncertainty set.
All runs of our algorithm included the full com-
plex uncertainty associated with the delay (Section
3.1) and the full range of real parametric uncertainty
for α, while different subsets of the uncertainty set of
K were considered as described below. This was done
to obtain comparable results with Martin et al. (1987),
where gain is the only varying parameter.
Figure 7 shows the three fundamental design cases
which we used to evaluate a trade-off between the
number of controllers and the maximum achievable
A
p
as a function of the breadth of the uncertainty sub-
set of K considered:
• a global non-adaptive robust controller (GNARC),
i.e., a controller able to provide robust perfor-
mance over the full uncertainty range of K. The
maximum A
p
achieved was 0.026, indicating that
a single-controller architecture would not meet
the requirements of this problem;
• fixed non-adaptive robust controllers (FNARCs),
i.e., multiple controllers (ideally, infinitely many),
each designed to maximise performance for a
point value of K (no uncertainty on K). The
results of this design case are representative of
the maximum achievable performance with a
multiple-controller system. It is clear from Figure
7 that the such an ideal system would be able to
meet and even exceed the required level of perfor-
mance, more notably so in the high-K region of
the uncertainty space;
• local non-adaptive robust controllers (LNARCs),
i.e, controllers capable of providing satisfactory
performance over non-infinitesimal subsets of the
uncertainty space of K. This design case is a
“middle ground” between the GNARC and the
FNARCs. A controller design covering a larger
uncertainty subset will result in a system with in-
ferior performance. It is up to the designer, there-
fore, to strike a suitable compromise between con-
troller bank complexity (number of controllers)
and system performance (maximum A
p
). In the
results shown, we defined suitable performance as
either A
p
=1 (the minimum required) or 60% of the
minimum FNARC over the corresponding uncer-
tainty subset, whichever the greatest. Five con-
trollers were required to cover the whole uncer-
tainty space of K. The reader may wish to com-
pare the controller design results of Figure 7 with
those of Martin et al. (1987) listed in Table 1.
4 NUMERICAL SIMULATION
A number of numerical simulations were performed
using Simulink in order to evaluate the performance
of the newly synthesised controllers. Here we de-
scribe a “stress test”, which includes and combines
the situations which were shown in Section 2 to
determine unsuitable system behaviour, in order to
compare the performance of traditional PI controllers
(Martin et al., 1987) with that of the new controllers.
We designed a sample case of a patient undergoing
a lengthy operation of several hours (330min). Since
the model identification and controller assignment as-
IMPROVED ROBUST PERFORMANCE IN A SYSTEM FOR AUTOMATIC ADMINISTRATION OF A
VASOACTIVE DRUG
287
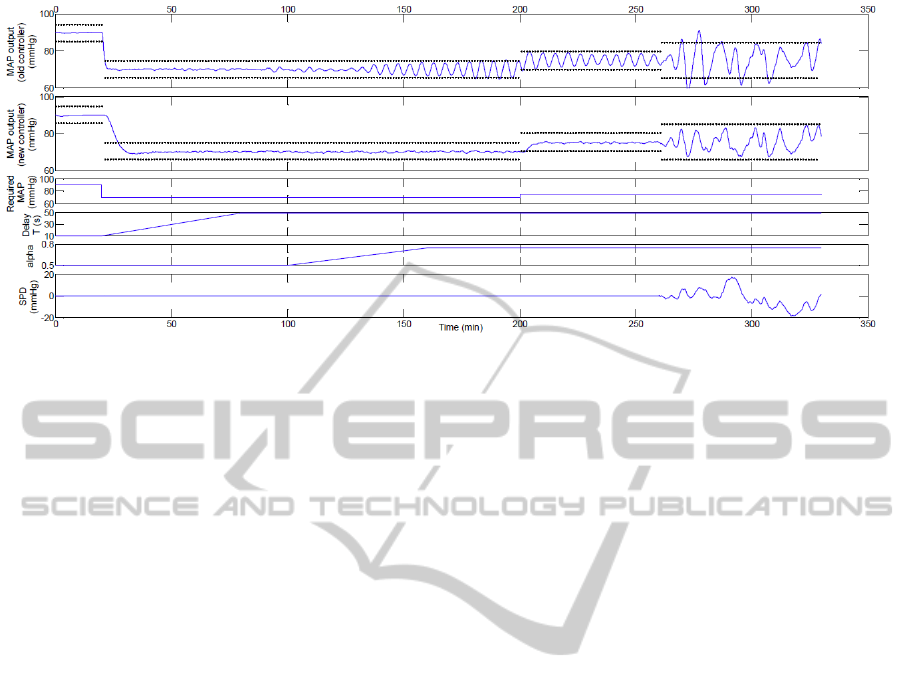
Figure 8: Results of the numerical simulation. The dotted lines indicate the acceptable MAP error interval of ±5 mmHg in
the absence of set point disturbances and ±10mmHg otherwise.
pects of MMAC were not the focus of this work, the
gain parameter K = 7.7 was assumed fixed throughout
the operation so that the correct controller could be
determined a priori (C
6
in Table 1, C
5
in Figure 7).
At t=0, the patient’s MAP was 90mmHg and the delay
constant was correctly estimated at T =T
∗
=10s. After
20min, a step pressure drop (-20mmHg) was required
by the clinician. Over the following 60min, a slow lin-
ear drift in patient delay was introduced, increasing to
T = 50s while the T
∗
parameter of the Smith’s pre-
dictor was not changed. After 20min of steady opera-
tion, a slow change in α was introduced, increasing
the parameter from 0.5 to 0.75 over 60 minutes. A
step reference change (+5mmHg) was introduced at
200 minutes. Finally, during the last 70 minutes of
the procedure, a random low-frequency SPD signal in
the range ±20mmHg was applied. Sensor noise was
present throughout and modelled as gaussian white
noise (mean 0mmHg, variance 4mmHg).
The simulation is summarised in Figure 8, where
we also show a comparison of the results of the sys-
tem with the two different types of controllers. Since
the simulation includes a significant amount of dis-
turbance, the steady state error bound of ±5mmHg
cannot apply. Disturbance rejection was deemed sa-
tisfactory if fluctuations in the measured MAP are
contained within ±10mmHg, which is the prescribed
limit in overshoot introduced in Section 2.1. The
results show that in cases where the mismatch be-
tween the true plant and the nominal model used in
the controller design becomes significant, the system
of Martin et al. (1987) may display oscillations, as
also shown in Figure 3. No significant oscillations
occurred with the new controllers independently of
changes in the delay constant T and the recircula-
tion parameter α or the requirement for small setpoint
changes. In the presence of fluctuations in the pa-
tient’s baseline MAP, the new controllers are more
effective in containing the fluctuations within a rea-
sonable ±10mmHg, while the old system may reach
undesirably low values in certain circumstances.
5 DISCUSSIONS AND FUTURE
WORK
In control applications such as this one, where consid-
erable variability may exist among subjects and even
within one subject over time, in the presence of dis-
turbances which may render off-line system identi-
fication unfeasible and on-line identification unreli-
able, a multiple-model adaptive control architecture
is advantageous. It offers the possibility of descri-
bing a time-varying system as the interpolation of lo-
cally valid linear models, thus allowing the control
designer to exploit advanced controller design tech-
niques for linear systems without sacrificing genera-
lity in the description of the underlying process. Key
issues in MMAC are the definition of the breadth of
uncertainty to be included in the bank of models, and
the number of models and controllers required to de-
liver the desired performance for all possible combi-
nations of the uncertain parameters.
The approach adopted herein has allowed us to
methodically address whether the degree of uncer-
tainty involved in the problem of automatic admini-
stration of SNP would benefit from a multiple con-
troller architecture. The answer to that question is
clearly affirmative. Not only have we clarified that ro-
bust performance cannot be achieved with a GNARC,
but we also formalised that a potential performance
increase of up to 100 fold (cf. values of A
p
=0.02 for
BIOSIGNALS 2012 - International Conference on Bio-inspired Systems and Signal Processing
288

GNARC and A
p
=2.0 for FNARCs) can be achieved
over certain subsets of the uncertainty range of K
using adaptive control. A trade-off is clearly obser-
vable between the number of controllers and the ma-
ximum achievable value of the performance index A
p
.
We were able to meet or exceed the robust perfor-
mance specifications and cover an even larger uncer-
tainty space than that of Martin et al. (1987) with a
smaller number of controllers (5 vs 7).
We have argued that overly simplified physiologi-
cal assumptions may lead to models which fail to de-
scribe the real plant with sufficient accuracy, increa-
sing the risk of degraded performance or even instabi-
lity. In this paper, we have reiterated a few examples
of this and we have reasoned, on the basis of simple
physiological knowledge, that additional uncertainty
in the parameters α and T should be accounted for.
As risk minimisation is a paramount aspect of medical
technology (Malagutti et al., 2011), and perhaps one
of the key reasons behind the lack of success of the
one and only ever commercialised device for this ap-
plication, the IVAC Titrator (IVAC Corporation, San
Diego, CA, USA) (Bequette, 2007), we believe that
improved robustness has an important role to play in
making automatic drug administration systems safer
and more widely acceptable in critical clinical set-
tings. In this context, the use of µ synthesis as a con-
troller design technique represents an improvement
over previous approaches as it offers a mathematical
guarantee of robust closed-loop stability and perfor-
mance over the expected range of uncertainty.
Despite the promising results, the proposed adap-
tation of a robust MMAC architecture to this drug de-
livery problem will require further work before it can
be proposed to a clinical audience. Effective stabilisa-
tion of a patient using the safe controller designs pre-
sented herein relies on the assumption that the correct
patient gain K can be identified and the corresponding
controller placed in the loop at all times. This is a cri-
tical assumption which has not been analysed in detail
here. Indeed, Malagutti et al. (2011) have advocated
caution against scenarios of instability or poor perfor-
mance caused by the insertion of the wrong controller
in the loop as a result of incorrect model identifica-
tion. The issues of reliably matching the plant with
a candidate model and safely placing a suitable con-
troller in the loop (avoiding the insertion of inappro-
priate controllers or placing a safe upper bound on the
time they can remain in the loop for) are critical in
MMAC systems and will be investigated as the next
steps in our research towards a complete and safe con-
trol architecture for this medical application.
A final remark concerns the focus of the control
task on blood pressure, which is only one of a num-
ber of parameters which characterise the state of the
cardiovascular system. In this context, stabilisation
of MAP alone may constitute an insufficient clinical
outcome. Following further consultation with clini-
cal professionals, future work may need to consider
multivariable models which include other key car-
diovascular variables (cardiac output, vascular resis-
tance, atrial pressures, etc.) and other administrable
drugs. Some experimental work exists in the litera-
ture addressing simultaneous control of MAP and car-
diac output (Yu et al., 1992; Rao et al., 2001), howe-
ver, to the authors’ knowledge, MMAC architectures
have not yet been utilised for this purpose. The same
approach presented here has the potential to be ex-
tended, with minor variations, to handle a multivaria-
ble case.
ACKNOWLEDGEMENTS
This work was supported in part by the ARC
Discovery-Projects Grant DP1095290.
REFERENCES
Bailey, J. and Haddad, W. (2005). Drug dosing control
in clinical pharmacology. IEEE Contr Syst Mag,
25(2):35–51.
Batzel, J. J., Kappel, F., Schneditz, D., and Tran, H. T.
(2007). Cardiovascular and Respiratory Systems
Modeling, Analysis, and Control. SIAM.
Bequette, B. W. (2007). Modeling and control of drug infu-
sion in critical care. J Process Control, 17:571–594.
Feakri, S., Athans, M., and Pascoal, A. (2006). Issues,
progress and new results in robust adaptive control.
In Adaptive Control and Signal Processing.
Furutani, E., Araki, M., Sakamoto, T., and Maetani, S.
(1995). Blood pressure control during surgical opera-
tions. IEEE Trans Biomed Eng, 42(10):999–1006.
Gu, D.-W., Petkov, P. H., and Konstantinov, M. M. (2005).
Robust Control Design with Matlab. Springer.
Isaka, S. and Sebald, A. V. (1993). Control strategies for
arterial blood pressure regulation. IEEE Trans Biomed
Eng, 40:353363.
Malagutti, N., Dehghani, A., and Kennedy, R. A. (2011).
Safety issues in adaptive control systems for auto-
matic administration of vasoactive drugs. In roceed-
ings of 18th IFAC World Congress, Milan, Italy.
Martin, J. F., Schneider, A. M., and Smith, N. T. (1987).
Multiple-model adaptive control of blood pressure
using sodium nitroprusside. IEEE Trans Biomed Eng,
34(8):603611.
Rao, R. R., Palerm, C. C., Aufderheide, B., and Bequette,
B. W. (2001). Automated regulation of hemodynamic
variables. IEEE Eng Med Biol Mag, 20(1):24–38.
IMPROVED ROBUST PERFORMANCE IN A SYSTEM FOR AUTOMATIC ADMINISTRATION OF A
VASOACTIVE DRUG
289

Slate, J. B., Sheppard, L. C., Rideout, V. C., and Blackstone,
E. H. (1979). A model for design of a blood pressure
controller for hypertensive patients. In Proceedings
of the first annual conference, IEEE Engineering in
Medicine and Biology Society, Denver, Colorado.
Yu, C., Roy, R. J., Kaufman, H., and Bequette, B. W.
(1992). Multiple-model adaptive predictive control of
mean arterial pressure and cardiac output. IEEE Trans
Biomed Eng, 39:765778.
Zhou, K., Doyle, J. C., and Glover, K. (1995). Robust and
Optimal Control. Prentice-Hall.
BIOSIGNALS 2012 - International Conference on Bio-inspired Systems and Signal Processing
290
