
PROTOTYPE SELECTION IN IMBALANCED DATA FOR
DISSIMILARITY REPRESENTATION
A Preliminary Study
M´onica Mill´an-Giraldo, Vicente Garc´ıa and J. Salvador S´anchez
Institute of New Imaging Technologies, Universitat Jaume I, Av. Sos Baynat s/n, 12071 Castell´on de la Plana, Spain
Keywords:
Dissimilarity-based classification, Class imbalance problem, Prototype selection.
Abstract:
In classification problems, the dissimilarity representation has shown to be more robust than using the feature
space. In order to build the dissimilarity space, a representation set of r objects is used. Several methods have
been proposed for the selection of a suitable representation set that maximizes the classification performance.
A recurring and crucial challenge in pattern recognition and machine learning refers to the class imbalance
problem, which has been said to hinder the performance of learning algorithms. In this paper, we carry
out a preliminary study that pursues to investigate the effects of several prototype selection schemes when
data set are imbalanced, and also to foresee the benefits of selecting the representation set when the class
imbalance is handled by resampling the data set. Statistical analysis of experimental results using Friedman
test demonstrates that the application of resampling significantly improve the performance classification.
1 INTRODUCTION
Classification is one of the key tasks in many pat-
tern recognition applications, which mainly consists
of predicting the categorical or numerical class of a
given input object. Usually, one of the main goals in
data classification is to obtain high accuracy, where
the object representation and the classification model
play an important role.
In traditional pattern recognition approaches, ob-
jects are represented in a feature space, i.e. by at-
tribute vectors (Duda et al., 2001). In the dissimilar-
ity space, unlike the feature space, objects are rep-
resented by pairwise of dissimilarities. The dissimi-
larity representation has shown to be more robust to
distinguish among classes than in the feature space,
since the nearness provides more discriminative in-
formation of each object (Pekalska and Duin, 2006).
Additionally, an study (Pekalska et al., 2002)
showed that for a complex problem in a 2D space, a
non-linear classifier was required in the feature space
to reach the same performance obtained by a linear
classifier in the dissimilarity space.
In the dissimilarity representation, the classifier
is constructed using a training set and a set of pro-
totypes, known as the representation set. Then, the
dissimilarity space is built by a dissimilarity mea-
sure to the set of chosen representation objects. Sev-
eral methods for prototype selection have been pro-
posed in the literature (Pekalska et al., 2006; Pekalska
and Duin, 2002a; Pekalska and Duin, 2002b; Jacobs
et al., 2000; Lozano et al., 2006) and the classification
accuracy may be affected depending on the method
used. In addition, data complexities may also affect
the classification performance.
A recurring complex situation in the data sets
refers to the presence of severely skewed class pri-
ors, which is generally known as the class imbalance
problem (Fern´andez et al., 2011). A data set is said
to be imbalanced when one of the classes (the minor-
ity one) is heavily under- represented in comparison
to the other (the majority) class. It has been observed
that class imbalance often leads to poor classification
performance in many real-world applications (Blagus
and Lusa, 2010; Chandola et al., 2009; Kamal et al.,
2009; Liao, 2008), especially for the minority classes.
This topic is particularly critical in those applications
where it is costly to misclassify minority examples.
Research on this topic has primarily focused on
the implementation of solutions for handling the im-
balance both at the data and algorithmic levels. Other
investigations have addressed the problem of measur-
ing the classifier performance in imbalanced domains.
Also, the relationship between class imbalance and
other data complexity characteristics has been ana-
lyzed. From these three general topics in class im-
242
Millán Giraldo M., García V. and Salvador Sánchez J. (2012).
PROTOTYPE SELECTION IN IMBALANCED DATA FOR DISSIMILARITY REPRESENTATION - A Preliminary Study.
In Proceedings of the 1st International Conference on Pattern Recognition Applications and Methods, pages 242-247
DOI: 10.5220/0003795502420247
Copyright
c
SciTePress

balance, data level methods are the most investigated.
These methods consist of balancing the original data
set, either by over-sampling the minority class and/or
by under-sampling the majority class, until the prob-
lem classes are approximately equally represented.
Although class imbalance has been extensively
studied for binary classification problems, very few
approaches explore the class imbalance problem in
the dissimilarity space (Koknar-Tezel and Latecki,
2011; Sousa et al., 2008b; Sousa et al., 2008a). In
this particular context, some works have used dissim-
ilarity based-classification as a tool to deal with im-
balanced data sets (Sousa et al., 2008b; Sousa et al.,
2008a).
In the present work, we study the effectiveness of
some prototype selection methods required for selec-
tion or creation of the representation set when the data
set is imbalanced. We also explore on the combined
use of some of them and resampling techniques to en-
hance the classification results. To this end, we will
carry out several experiments over real data sets us-
ing four prototype selection methods taken from the
literature, when employing the Nearest Neighbor rule
(1NN) and the Fisher classifier. The significance of
classification performance will be analyzed by means
of Friedman’s Test.
The remainder of the paper is organized as fol-
lows. In Section 2, a summary of classification in
dissimilarity representation is presented together with
the prototype selection methods chosen for our study.
An introduction to resampling algorithms is provided
in Section 3. Section 4 reports the experiments and
the related results are discussed, ending up the paper
with some conclusions and proposals for further work
in Section 5.
2 DISSIMILARITY SPACE
In the dissimilarity space, objects are represented by
pairwise dissimilarities values, where each object is
related with other objects by a vector of dissimilari-
ties (Pekalska and Duin, 2002a).
2.1 Dissimilarity-based Classification
The dissimilarity space is built using a representation
set R = {p
1
,..., p
r
} of r objects, called prototypes.
Given a dissimilarity measure, the representation is
obtained as the proximity to prototypes in R. Then,
the dimension of this new space is determined as the
amount of prototypes.
Let X be the training set of n objects in the fea-
ture space, X = {x
1
,... ,x
n
}, the classifier in dissimi-
larities is built from the proximities between training
set objects and prototypes, i.e. on the distance matrix
D(X,R). Usually, R ⊆X covering all classes. Conse-
quently, D(X,R) is a dissimilarity matrix of size n×r,
where the object x
i
is associated with all prototypes in
R and described in the i-th rowby a r-dimensional dis-
similarity vector D(x
i
,R) = {d(x
i
, p
1
),.. . , d(x
i
, p
r
)},
being d the proximity measure (e.g., the Euclidean
distance). When the object x
i
and p
h
are identical
d(x
i
, p
h
) = 0, this distance gets to be higher in so far
as x
i
and p
h
become more different.
In the same way, given a test set S of s objects in
the feature space, it may be represented in dissimilar-
ities by pairwise proximities between objects in S and
prototypes, D(S,R). This representation space has the
advantage that any conventionalclassifier operating in
vector space can be used (Pekalska and Duin, 2005;
Pekalska et al., 2002)
2.2 Prototype Selection Methods
The main problem in the dissimilarity space is the
possible high dimensionality of the representation of
data in pairwise proximities, which is determined by
the size of R. For this reason, many works focus on
investigating different methods for prototype selec-
tion, with the aim of finding a small representation set
that reduces the computational effort while preserving
the accuracy in the classification (Pekalska and Duin,
2002a; Lozano et al., 2006).
In this work, we analyze the effect of the repre-
sentation set when data are imbalanced. To this end,
we employed four prototype selection methods:
• R50: This method consists on randomly choose a
fifty percent of objects (n/2) in T, keeping the a
priori probabilities of each class.
• R100: The representation set contains all training
set objects, i.e. R = T. It has the disadvantage
that the computational cost may be high since the
dimension of the space is equal to the number of
objects in the training set.
• RCNN: The representation set is constructed
by applying the conventional algorithm of con-
densed Nearest Neighbor rule (CNN), introduced
by (Hart, 1968), to the training set with the aim to
retain a consistent subset of the original T. This
method has the undesirable property that the con-
sistent subset depends on the order in which data
are processed.
• RMSS: It builds the representation set based on the
Modified Selective Subset method (MSS), pro-
posed by (Barandela et al., 2005), which reduces
PROTOTYPE SELECTION IN IMBALANCED DATA FOR DISSIMILARITY REPRESENTATION - A Preliminary
Study
243

the training set size while preserving the original
decision boundaries as much as possible.
3 DATA-LEVEL METHODS
Data-driven methods consist of artificially balancing
the original data set, either by over-sampling the mi-
nority class and/or by under-sampling the majority
class, until the problem classes are approximately
equally represented. Both strategies can be applied
in any learning system, since they act as a prepro-
cessing phase, allowing the learning system to receive
the training instances as if they belonged to a well-
balanced data set. Thus, any bias of the system to-
wards the majority class due to the different propor-
tion of examples per class would be expected to be
removed. The simplest method to increase/reduce the
minority/majority class corresponds to non-heuristic
methods that aim at balancing the class distribution
through the random replication/elimination of pos-
itive/negative examples. Nevertheless, these meth-
ods have shown important drawbacks. Random over-
sampling may increase the likelihood of overfitting,
since it makes exact copies of the minority class in-
stances. On the other hand, random under-sampling
may discard data potentially important for the classi-
fication process. Despite this problem, it has empiri-
cally been shown to be one of the most effective re-
sampling methods. In order to overcome these draw-
backs, several authors have developed focused resam-
pling algorithms that produce balanced data sets in an
intelligent way.
(Chawla et al., 2002) proposed an over-sampling
technique that generates new synthetic minority in-
stances by interpolating between several positive ex-
amples that lie close together. This method, called
SMOTE (Synthetic Minority Oversampling TEch-
nique), allows the classifier to build larger decision
regions that contain nearby instances from the minor-
ity class. From the original SMOTE algorithm, sev-
eral modifications have been proposed in the litera-
ture, most of them pursuing to determine the region
in which the positive examples should be generated.
For instance, Borderline- SMOTE (Han et al., 2005)
consists of using only positive examples close to the
decision boundary, since these are more likely to be
misclassified.
Unlike the random method, many proposals are
based on a more intelligent selection of negative ex-
amples to be eliminated. For example, (Kubat and
Matwin, 1997) proposed an under-sampling tech-
nique, called obe-sided selection, that selectively re-
moves only those negative instances that are “redun-
dant” or that “border” the minority class examples
(they assume that these bordering cases are noise). In
contrast to the one-sided selection technique, the so-
called neighborhood cleaning rule emphasizes more
on data cleaning than on data reduction. To this end,
Wilsons editing is used to identify and remove noisy
negative instances. Similarly, (Barandela et al., 2003)
introduced a method that eliminates not only noisy
instances of the majority class by means of Wilsons
editing (WE), but also redundant examples through
the MSS condensing algorithm.
4 EXPERIMENTAL SETUP AND
RESULTS
Experiments were carried out over 13 data sets taken
from the UCI Machine Learning Database Reposi-
tory (Frank and Asuncion, 2010) and a private library
( http://www.vision.uji.es/∼sanchez/Databases/). All
data sets have been transformed into two-class prob-
lems by keeping one original class (the minority class)
and joining the objects of the remaining classes (giv-
ing the majority class). For example, in Segmenta-
tion database the objects of classes 1, 2, 3, 4 and 6
were joined to shape a unique majority class and the
original class 5 was left as the minority class (see a
summary in Table 1).
Table 1: Data sets used in the experiments
Data Set Positive Examples Negative Examples Classes Majority Class
Breast 81 196 2 1
Ecoli 35 301 8 1,2,3,5,6,7,8
German 300 700 2 1
Glass 17 197 9 1,2,4,5,6,7,8,9
Haberman 81 225 2 1
Laryngeal
2
53 639 2 1
Phoneme 1586 3818 2 1
Pima 268 500 2 1
Scrapie 531 2582 2 1
Segmentation 330 1980 6 1,2,3,4,6
Spambase 1813 2788 2 1
Vehicle 212 634 4 2,3,4
Yeast 429 1055 10 1,3,4,5,6,7,8,9,10
For each data set, we have used a stratified 5-
fold cross-validation, obtaining 65 new problems.
SMOTE and random under-sampling were applied to
the training data (in the feature space), and four differ-
ent prototype selection techniques were used on im-
balanced and resampled data sets: R50, R100, RCNN
and RMSS. Two learners, Fisher and 1-NN classifiers,
were constructed from the original and transformed
data sets.
In total, 65 different training data sets, two resam-
pling methods and no sampling, results in 65 ×3 =
195 transformed data sets. Since there are four proto-
type selection methods and two learning algorithms,
ICPRAM 2012 - International Conference on Pattern Recognition Applications and Methods
244
0
0.5
1
1.5
2
2.5
3
R50 R100 RCNN RMSS
IMBALANCE
UNDER
OVER
(a)
0
0.5
1
1.5
2
2.5
3
R50 R100 RCNN RMSS
IMBALANCE
UNDER
OVER
(b)
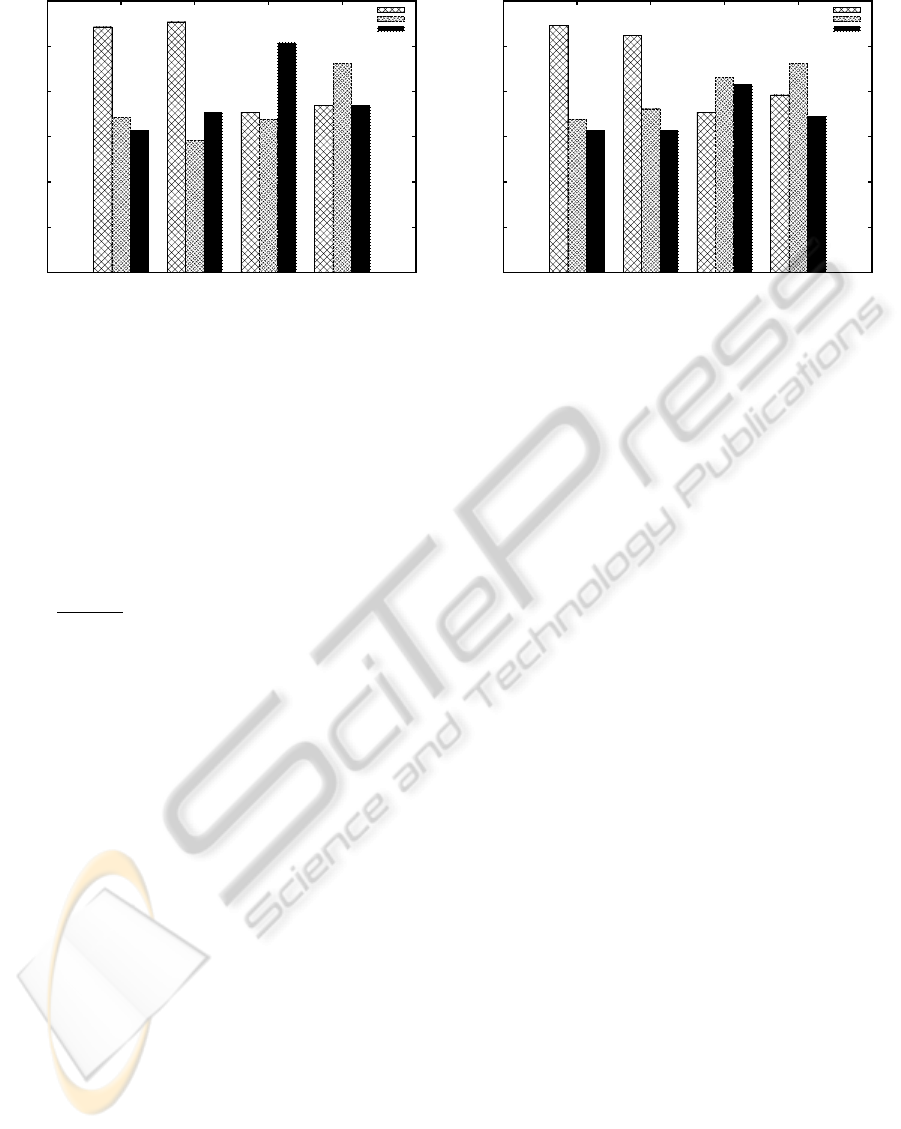
Figure 1: Friedman rankings for four different prototype selection methods over imbalanced and resampled data sets. (a)
Fisher and (b) 1NN classifiers.
a total of 1,560 classifiers were trained and evaluated
in our experiments.
Typical metrics for measuring the performance of
learning systems are classification accuracy and error
rates. However, as pointed out by many authors (Fa-
tourechi et al., 2008; Gu et al., 2009; Huang and Ling,
2005) these performance measures show a biased be-
havior in the presence of skewed distributions. In
this paper, we will use the geometric mean of accu-
racies (Kubat and Matwin, 1997), which is defined as
Gm =
√
a
+
×a
−
, where a
+
denotes the accuracy on
the positive class, and a
−
is the accuracy on the neg-
ative class. This measure can be seen as a kind of
correlation between both rates, because a high value
occurs when they both are also high, while a low value
is related to at least one low rate.
Results obtained in terms of Gm were evaluated
by the multiple comparison Friedman test (Alcal´a-
Fdez et al., 2011; Demˇsar, 2006), which is a non-
parametric test equivalent to repeated measures of
ANOVA. It ranks the algorithms in such a way that
the best performing method gets the rank 1. In the
case of ties, averaged ranks are assigned.
4.1 Analysis of the Results
Figure 1 shows rank values for the four prototype se-
lection techniques (R50, R100, RCNN and RMSS)
when the classification model is (a) Fisher and (b)
1NN. For each technique, the ranking method is ap-
plied over the three cases, both when the representa-
tion set is imbalanced and when it is balanced. Lower
values correspond to the best overall performancesfor
technique-classifier combinations.
For both classifiers, it is observed that when the
representation set is R50 or R100, it is worth apply-
ing any resampling technique before using the repre-
sentation space by means of dissimilarities. This may
suggest that when the representation set is selected
from balanced data sets, the dissimilarity-based clas-
sifier learns to distinguish between the classes.
However, this behavior is not observed for the
RCNN and RMSS methods, since in some cases the
classification of imbalanced data improves the results
when they are balanced. It seems that the application
of condensed techniques are discarding objects with
relevant information of the classes, and possibly the
minority class is being more affected. Additionally,
when the representation set is undersampled after be-
ing condensed, more objects are discarded in the rep-
resentation set, resulting in a decrease in performance.
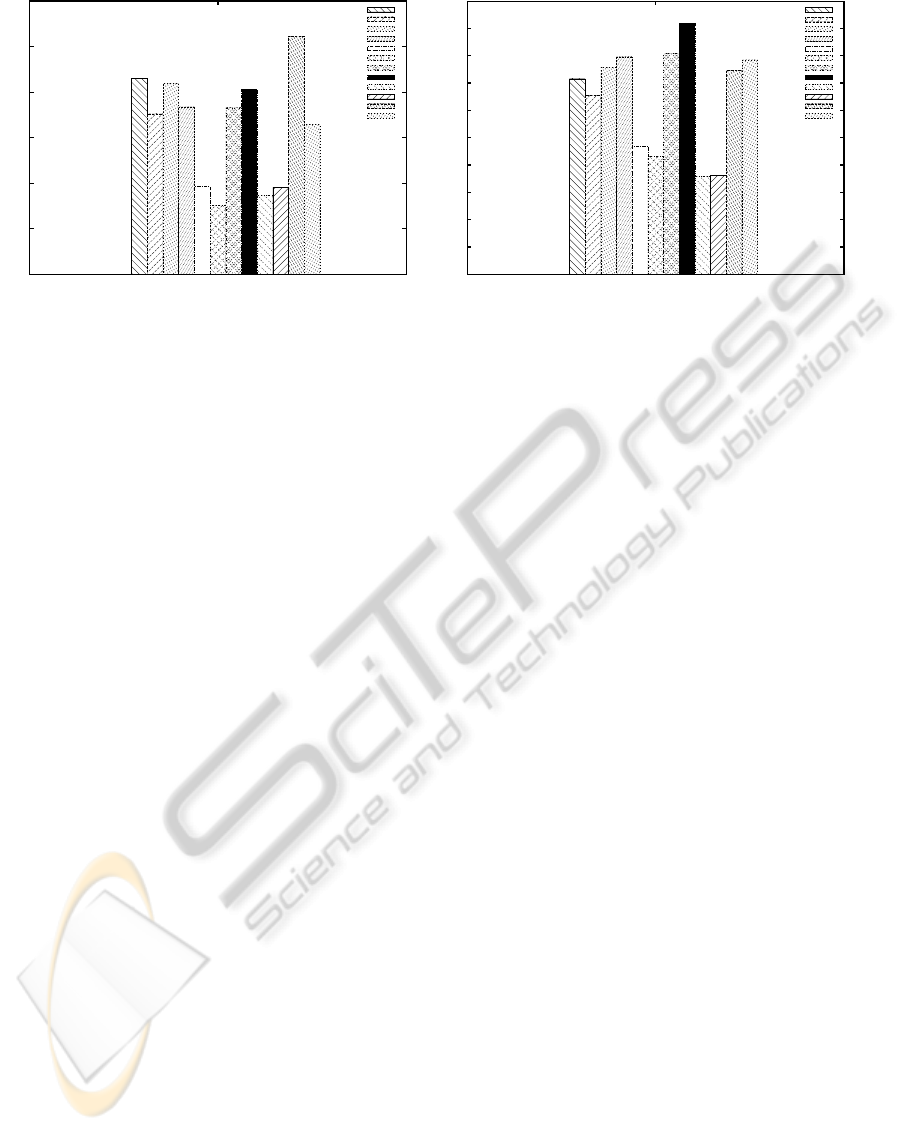
Figure 2 shows results when the ranking method
is applied over all methods, when data is imbalanced
(IR50, IR100, IRCNN and IRMSS), under-sampled
(UR50, UR100, URCNN and URMSS) and over-
sampled (OR50, OR100, ORCNN and ORMSS), for
(a) Fisher and (b) 1NN classifiers.
In general, for both classifiers the best results are
observed with the R50 and R100 methods when data
sets are resampled. This may indicate that in the dis-
similarity space the classification performance is im-
proved if the training set is balanced before building
the dissimilarity classifier.
For Fisher classifier, the best performance is
achieved with R100 when data are under-sampled.
However, with R50 a slightly lower performance is
obtained, whereas the difference of computational ef-
fort is significant. This may suggest that the R50
technique could be used for keeping a good cost-
performance ratio when data are resampled.
On the other hand, the best result for the 1NN clas-
sifier is reached for the R50 and R100 methods when
data are over-sampled. This confirms the conclusions
previously drawn by (Pekalska and Duin, 2002a) in
PROTOTYPE SELECTION IN IMBALANCED DATA FOR DISSIMILARITY REPRESENTATION - A Preliminary
Study
245
0
2
4
6
8
10
12
Fisher
IR50
IR100
IRCNN
IRMSS
UR50
UR100
URCNN
URMSS
OR50
OR100
ORCNN
ORMSS
(a)
0
1
2
3
4
5
6
7
8
9
10
1NN
IR50
IR100
IRCNN
IRMSS
UR50
UR100
URCNN
URMSS
OR50
OR100
ORCNN
ORMSS
(b)
Figure 2: Friedman rankings for all prototype selection considering a total of 13 data sets. (a) Fisher and (b) 1NN classifiers.
the sense that k-NN classifiers require a much larger
representation set to achieve a higher accuracy.
5 CONCLUSIONS
In this paper, we analyze the effect of the representa-
tion set in the dissimilarity space when data are imbal-
anced. For this purpose, we evaluate four prototype
selection methods. In addition, the under-sampling
and over-sampling techniques are also applied to data
before representing them by dissimilarities, with the
aim of analyzing how a balanced representation set
affect the performance classification. The Fisher and
1-Nearest Neighbor classifier were used to evaluate
each method.
In general, for both classifiers, results show that
the best performance was obtained for the simplest
methods (R50 and R100), what indicates that it
is worth applying any resampling technique before
building the dissimilarity classifier.
ACKNOWLEDGEMENTS
This work has partially been supported by the Span-
ish Ministry of Education and Science under grants
CSD2007–00018 and TIN2009–14205, the Fundaci´o
Caixa Castell´o-Bancaixa under grant P1–1B2009–04,
and the Generalitat Valenciana under grant PROME-
TEO/2010/028.
REFERENCES
Alcal´a-Fdez, J., Fern´andez, A., Luengo, J., Derrac, J.,
and Garc´ıa, S. (2011). KEEL Data-mining software
tool: Data set repository, integration of algorithms and
experimental analysis framework. Multiple-Valued
Logic and Soft Computing, 17(2-3):255–287.
Barandela, R., Ferri, F. J., and S´anchez, J. S. (2005). De-
cision boundary preserving prototype selection for
nearest neighbor classification. International Jour-
nal of Pattern Recognition and Artificial Intelligence,
19(6):787–806.
Barandela, R., S´anchez, J., Garc´ıa, V., and Rangel, E.
(2003). Strategies for learning in class imbalance
problems. Pattern Recognition, 36(3):849–851.
Blagus, R. and Lusa, L. (2010). Class prediction for high-
dimensional class-imbalanced data. Bioinformatics,
11(1):523–540.
Chandola, V., Banerjee, A., and Kumar, V. (2009).
Anomaly detection: A survey. ACM Computing Sur-
veys, 41:15:1–15:58.
Chawla, N. V., Bowyer, K. W., Hall, L. O., and Kegelmeyer,
W. P. (2002). SMOTE: synthetic minority over-
sampling technique. Journal of Artificial Intelligence
Research, 16:321–357.
Demˇsar, J. (2006). Statistical comparisons of classifiers
over multiple data sets. Journal of Machine Learning
Research, 7:1–30.
Duda, R. O., Hart, P. E., and Stork, D. G. (2001). Pat-
tern Classification (2nd Edition). Wiley-Interscience,
2 edition.
Fatourechi, M., Ward, R., Mason, S., Huggins, J., Schlogl,
A., and Birch, G. (2008). Comparison of evaluation
metrics in classification applications with imbalanced
datasets. In Proc. 7th International Conference on
Machine Learning and Applications, pages 777–782,
San Diego, CA.
Fern´andez, A., Garc´ıa, S., and Herrera, F. (2011). Address-
ing the classification with imbalanced data: Open
problems and new challenges on class distribution.
In Corchado, E., Kurzynski, M., and Wozniak, M.,
editors, Hybrid Artificial Intelligent Systems, volume
6678 of Lecture Notes in Computer Science, pages 1–
10.
Frank, A. and Asuncion, A. (2010). UCI Machine Learning
Repository.
Gu, Q., Zhu, L., and Cai, Z. (2009). Evaluation measures
of the classification performance of imbalanced data
ICPRAM 2012 - International Conference on Pattern Recognition Applications and Methods
246

sets. In Cai, Z., Li, Z., Kang, Z., and Liu, Y., ed-
itors, Computational Intelligence and Intelligent Sys-
tems, volume 51 of Communications in Computer and
Information Science, pages 461–471.
Han, H., Wang, W.-Y., and Mao, B.-H. (2005). Borderline-
smote: A new over-sampling method in imbalanced
data sets learning. In Advances in Intelligent Comput-
ing, Lecture Notes in Computer Science, volume 3644,
pages 878–887.
Hart, P. E. (1968). The condensed nearest neighbor rule.
IEEE Trans. on Information Theory, 14:515–516.
Huang, J. and Ling, C.-X. (2005). Using AUC and accu-
racy in evaluating learning algorithms. IEEE Trans.
on Knowledge and Data Engineering, 17(3):299–310.
Jacobs, D. W., Weinshall, D., and Gdalyahu, Y. (2000).
Classification with non-metric distances: Image re-
trieval and class representation. IEEE Trans. on Pat-
tern Analysis and Machine Intelligence, 22(6):583–
600.
Kamal, A. H. M., Zhu, X., and Narayanan, R. (2009).
Gene selection for microarray expression data with
imbalanced sample distributions. In Proc. Interna-
tional Joint Conference on Bioinformatics, Systems
Biology and Intelligent Computing, pages 3–9, Shang-
hai, China.
Koknar-Tezel, S. and Latecki, L. (2011). Improving SVM
classification on imbalanced time series data sets with
ghost points. Knowledge and Information Systems,
28:1–23.
Kubat, M. and Matwin, S. (1997). Addressing the curse of
imbalanced training sets: one-sided selection. In Proc.
14th International Conference on Machine Learning,
pages 179–186, Nashville, TN.
Liao, T. W. (2008). Classification of weld flaws with imbal-
anced class data. Expert Systems with Applications,
35(3):1041 – 1052.
Lozano, M., Sotoca, J. M., S´anchez, J. S., Pla, F., Pkalska,
E., and Duin, R. P. W. (2006). Experimental study on
prototype optimisation algorithms for prototype-based
classification in vector spaces. Pattern Recognition,
39:1827–1838.
Pekalska, E. and Duin, R. P. W. (2002a). Dissimilarity rep-
resentations allow for building good classifiers. Pat-
tern Recognition Letters, 23(8):943–956.
Pekalska, E. and Duin, R. P. W. (2002b). Prototype selec-
tion for finding efficient representations of dissimilar-
ity data. In Proc. 16th International Conference on
Pattern Recognition, volume 3, pages 37–40, Quebec,
Canada.
Pekalska, E. and Duin, R. P. W. (2005). The Dissimilarity
Representation for Pattern Recognition: Foundations
And Applications. World Scientific Publishing Com-
pany.
Pekalska, E. and Duin, R. P. W. (2006). Dissimilarity-based
classification for vectorial representations. In Proc.
18th International Conference on Pattern Recogni-
tion, volume 3, pages 137–140, Hong Kong.
Pekalska, E., Duin, R. P. W., and Paclik, P. (2006). Proto-
type selection for dissimilarity-based classifiers. Pat-
tern Recognition, 39(2):189–208.
Pekalska, E., Paclik, P., and Duin, R. P. W. (2002). A gen-
eralized kernel approach to dissimilarity-based clas-
sification. Journal of Machine Learning Research,
2:175–211.
Sousa, A., Mendonca, A., and Campilho, A. (2008a).
Dissimilarity-based classification of chromatographic
profiles. Pattern Analysis & Applications, 11:409–
423.
Sousa, A., Mendonca, A., and Campilho, A. (2008b). Min-
imizing the imbalance problem in chromatographic
profile classification with one-class classifiers. In
Campilho, A. and Kamel, M., editors, Image Analy-
sis and Recognition, volume 5112 of Lecture Notes in
Computer Science, pages 413–422.
PROTOTYPE SELECTION IN IMBALANCED DATA FOR DISSIMILARITY REPRESENTATION - A Preliminary
Study
247
