
IN-SITU SPECTROSCOPIC INVESTIGATION OF UNFOLDING
AND AGGREGATION OF INSULIN UNDER ULTRASONIC
EXCITATION
An Ultrasonic Actuator for FTIR-spectrometry on Biomatter
Helge Pfeiffer
1
, Nikos Chatziathanasiou
1
, Filip Meersman
3
, Christ Glorieux
2
,
Karel Heremans
3
and Martine Wevers
1
Katholieke Universiteit Leuven
1
Department of Metallurgy and Materials Engineering, Group Material Performance and Non-destructive Testing,
Kasteelpark Arenberg 44, B-3001 Leuven, Belgium
2
Department of Physics, Acoustic and Thermal Physics Section, Celestijnenlaan 200D, B-3001 Leuven, Belgium
3
Department of Chemistry, Unit of Molecular and Nanomaterials, Celestijnenlaan 200F, B-3001 Leuven, Belgium
Keywords: Ultrasonic actuator, Fourier Transform Infrared Spectroscopy, Insulin, Fibrillogenesis, Protein Aggregation.
Abstract: It is well-known that fibrillogenesis of proteins can be influenced by diverse external parameters, such as
temperature, pressure, agitation or chemical agents. This paper presents a newly developed ultrasonic
actuator cell and a corresponding first feasibility study shows that also ultrasonic excitation at moderate
intensities has a clear influence on the unfolding and aggregation behaviour of insulin. Irradiation with an
average sound intensity of about 180 mW/cm
2
leads to a decrease of the unfolding and aggregation
temperature up to 7 K.
1 INTRODUCTION
The main topic of this paper is the spectroscopic
detection and interpretation of the in-situ molecular
response of biomolecules on ultrasonic excitation.
The novelty of this approach is the monitoring of
empirical and molecular parameters during the
application of ultrasound rather than after treatment,
as in many other studies. To the best of our
knowledge, there is almost no literature on in situ or
even on time resolved methods, and this is due to a
number of inherent difficulties to combine ultrasonic
excitation and spectroscopic detection. As a relevant
example for a biological process to study,
fibrillogenesis was selected. The aggregation of
globular proteins, sometimes leading to amyloid
fibrils, is of great importance for biology, medicine
and also industrial processes. In the medical field,
there is a strong link between fibrillogenesis, and a
number of neurodegenerative diseases, such as the
Alzheimer disease (Dobson, 2003). Preliminary
investigations in the framework of this research
project showed that even very small sound velocity
intensities (range of μW/cm
2
) have a stimulating
influence on the aggregation behaviour of synthetic
polymers (publication under preparation). In the
work presented here, the impact of ultrasonic
excitation on insulin fibrillogenesis was monitored
by infrared spectroscopy (Bouchard, Zurdo et al.,
2000). This approach enables the quantitative
determination of the varying population of
secondary structures that are characteristic for the
unfolding and aggregation process, i.e. the
transformation of a dominant α-helix population into
the β-sheet conformation (β-strands) as well as the
appearance of side bands that indicate aggregation.
2 MATERIALS AND METHODS
2.1 Ultrasonic Excitation System
The infrared sample holder was equipped with a
home-made ultrasonic actuator (Figure 1). It consists
of two CaF
2
plates (10x20mm) that are separated by
a polytetrafluorethen spacer (50 μm thickness) with
a centred square opening of 5 x 5 mm. At one plate,
two identical piezoceramic lead zirconate titanate
372
Pfeiffer H., Chatziathanasiou N., Meersman F., Glorieux C., Heremans K. and Wevers M..
IN-SITU SPECTROSCOPIC INVESTIGATION OF UNFOLDING AND AGGREGATION OF INSULIN UNDER ULTRASONIC EXCITATION - An
Ultrasonic Actuator for FTIR-spectrometry on Biomatter.
DOI: 10.5220/0003797003720375
In Proceedings of the International Conference on Biomedical Electronics and Devices (BIODEVICES-2012), pages 372-375
ISBN: 978-989-8425-91-1
Copyright
c
2012 SCITEPRESS (Science and Technology Publications, Lda.)

(PZT) transducers (with wrapped-around electrode,
provided by Meggit/InSensor®, Denmark) were
attached by epoxy resin adhesive, and the nickel
electrodes were wired to shielded contacts. The
liquid sample was loaded into the 5 x 5 mm opening
of the polytetrafluorethen spacer. The thickness of
the liquid layer was thus determined by the thickness
of the polytetrafluorethen gasket, d, which was in
the range of 50 micrometer. The CaF
2
plates were
closed and sealed by parafilm and vacuum grease to
prevent leakage of water. Since water loss,
especially induced by the heating of the sample,
would cause problems, in addition to these
measures, the stability of water concentration was
ensured by observing the intensity of the infrared
water peak.
Figure 1: Ultrasonic cell for in-situ spectroscopic
investigation of ultrasonic actuation. Scheme of operation
mode, vibrations in the CaF
2
sample assembly in the
transmission cell are generated by a PZT actuator and the
response is monitored by the PZT receiver.
The CaF
2
plate assembly was mounted in a
commercial SPECAC® temperature cell. In order to
avoid the transfer of essential amounts of ultrasonic
energy into the temperature cell, the ultrasonically
active plates were firmly embedded within heat-
resistant foam that isolated the plates due to the big
mismatch of acoustic impedances. Placing the foam
also reduced the thermal contact between the cell
and the probed region in the sample, resulting in an
offset between the registered temperature and the
actual sample temperature.
For the ultrasonic excitation, the following
approach was followed: a sinusoidal electrical signal
consisting of a continuous wave (cw) with a
frequency of about 50 kHz and an amplitude of 200
mV
pp
was generated by an Iwatsu SG-4511
pulse/function generator. The exact resonance
frequency was fine-tuned using the output signal
monitored at the oscilloscope. The electrical signal
from the generator was connected to the input of a
broadband amplifier (AR Worldwide 75A250). The
PZT transducer finally transformed the amplified
voltage signal into a mechanical oscillation that
released plate waves into the CaF
2
plates. Due to the
continuous operation mode, standing wave patterns
were generated by multiple reflections that depend
on the material, the frequency and the geometrical
boundary conditions of the sample holder. The
receiving PZT transducer was connected to a
LeCroy 9310 AM oscilloscope in order to monitor
the amplitude of the standing ultrasonic wave. For
connecting the electronic devices, shielded standard
BNC cables with an impedance of 50 Ohm were
used.
For driving the PZT transducer, a resonance
frequency was used that was fine-tuned by the
output signal. Whereas the main resonance
(thickness resonance) was in the range of 4 MHz, a
resonance around 50 kHz was selected.
According to a number of simplifications, the
sound intensity in the insulin solution can be
estimated. The final intensity estimated is in the
range of I = 180 mW/cm
2
given an average
displacement of ξ = 110 nm. Note that the threshold
of sound intensity in diagnostic medical applications
is also in the range of I = 100 mW/cm
2
, such as
mentioned above. On the other hand, the intensities
are too low to enable the forming of acoustic
cavitations. The present set-up thus meets the targets
of the intended study.
2.2 FTIR Spectroscopy
The unfolding and aggregation of insulin was
followed by FTIR-spectroscopy using a Bruker IFS-
66 spectrometer equipped with a liquid nitrogen-
cooled mercury cadmium telluride detector. 64
spectra with a resolution of 2 cm
-1
were co-added in
order to achieve a good signal to noise ratio. The
spectra were processed using the OPUS software of
the spectrometer, and the positions of the peaks were
determined using the peak seeking function of the
software. The temperature was controlled by both a
heating and cooling element, and it is measured by a
thermocouple that was attached at the thermocell.
The temperature was rising with a rate of
α
= 0.25
K/min. In this way, one obtains one spectrum for
every Kelvin that represents an average of the
spectroscopic signals in that temperature interval.
2.3 Preparation of Samples
Insulin from bovine pancreas [11070-73-8] was
obtained from Sigma Aldrich and was dissolved in
D
2
O [7789-20-0] obtained from Cambridge Isotope
Laboratories, Inc. (99.9%). The solvent D
2
O was
selected because the bending vibration of H
2
O
IN-SITU SPECTROSCOPIC INVESTIGATION OF UNFOLDING AND AGGREGATION OF INSULIN UNDER
ULTRASONIC EXCITATION - An Ultrasonic Actuator for FTIR-spectrometry on Biomatter
373
interferes with Amide I band of proteins. The final
concentration was 50 mg/mL. The pD of 1.2 was
adjusted by adding DCl (20wt% in D
2
O
99+atom%D, [7698-05-7], Janssen Chimica).
Between preparation and measurements, there was
sufficient time for enabling deuterium water
exchange (minimum one hour).
3 RESULTS AND DISCUSSION
3.1 Results on FTIR Study of
Ultrasonic-assisted Fibrillogenesis
The unfolding and aggregation of insulin can be
monitored by FTIR spectroscopy. This is possible
using the amide I band that is sensitive to the
transformation from the α helical into the β sheet
structure. In Figure 2, the transition from the α-helix
conformation which is located at around 1650 cm
-1
to the β-sheet conformation which is located at
around 1628 cm
-1
is shown. The wavenumbers as
well as the temperature agrees with literature values
(Bouchard, Zurdo et al., 2000). At starting transition,
a small shoulder at the lower wave number appears,
which indicates the presence of β-sheet structure and
as the temperature rises it slowly becomes a separate
band. One should keep in mind that there are always
remaining α−helical structures even after the
complete formation of fibrils.
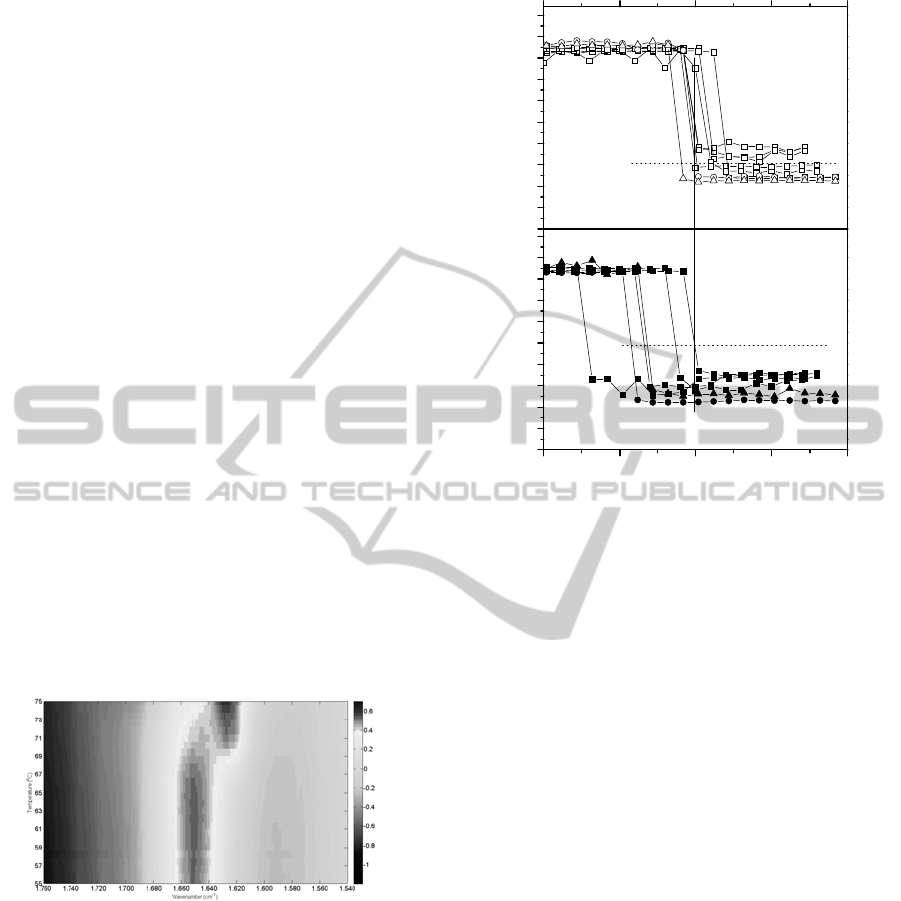
Figure 2: Contour plot of the infrared spectra. The
amplitudes are represented by the grey-scale. The amide I
band in the middle shows the unfolding at 71 °C.
The peak position of the amide I band as a
function of temperature is shown in Figure 3. The
temperature axis is shifted so that the average
unfolding and aggregation temperatures of the
respective sample series are set to zero. The
spreading of the transition temperature does thus
represent the variation around the average values. In
the respective samples that were subjected to
ultrasound, the temperature axis was also shifted by
the corresponding unfolding and aggregation for the
-10 -5 0 5 10
1610
1615
1620
1625
1630
1635
1640
1645
1650
1655
1660
1610
1615
1620
1625
1630
1635
1640
1645
1650
1655
1660
-10 -5 0 5 10
b)
k (cm
-1
)
ΔT (°C)
a)
k (cm
-1
)
Figure 3: Thermotropic shift of the amide I band of insulin
without ultrasound a) and under ultrasonic ultrasonic
excitation b). The temperature axis is normalised
according to the average transition temperature in the
sample series without ultrasound.
non-ultrasonic case. According to Figure 3, b), the
transition temperatures are always lower if
ultrasound was applied. The variation of the
ultrasound assisted shift (between 1 and 7 K) is
essentially not due statistics but due to the spatial
variation of the ultrasonic effects at the sample that
arises from the standing wave pattern. The variations
of transition temperatures should thus be attributed
to the position of the infrared beam in different
sound nodes and antinodes.
3.2 Discussion
There are different possibilities to explain the shift
of the unfolding and aggregation temperature by
ultrasonic excitation. A first and manifest reason is
the heating due to ultrasound and the heat
dissipation due to the operation of the ultrasonic
transducer itself (transducer self-heating, (Wu and
Nyborg, 2006)) that account for a difference of
approximately 1 K according to thermography tests
performed. But the highest difference in unfolding
temperature observed is more than 7 K. Therefore it
can be expected that other reasons must be taken
into account. Electromagnetic effects can be
excluded for this case, because the shift of
BIODEVICES 2012 - International Conference on Biomedical Electronics and Devices
374

temperature would be much more constant due to
the constant output control of the ultrasonic device,
moreover that effect was checked to be negligible.
Another possibility would be a local change of the
conditions of the electrolytic buffer solution. It is
known that ultrasonics is able to change the pH, a
phenomenon that is called ultrasonic vibrational
potential – for the case that the pH was lowered by
ultrasonics a temperature decrease would be
explainable. However, this effect was checked to be
negligible.
The most probable explanation is the
acceleration of the unfolding and aggregation
process by ultrasonic induced acoustic micro-
streaming (Wu and Nyborg, 2006). One
distinguishes between two types of micro-streaming;
the simplest type is acoustic streaming in a liquid
bulk phase that is sometimes called “quartz wind”.
The other type is related to interactions where
several kinds of boundaries, surfaces or
inhomogeneities are involved. Due to the small
liquid layer thickness with respect to the
wavelength, one should expect that the second type
of acoustic micro-streaming applies to our
experiment described above. Acoustic-micro-
streaming leads finally to additional mobility inside
the liquid that promotes mixing processes.
It is known, that unfolding and aggregation
leading to fibrillogenesis is a kinetic process.
Aggregation itself is determined by the frequency of
mutual contacts between hydrophobic groups, and
mixing of the solution would definitely enhance the
probability of these contacts. Nonlinear ultrasonic
effects will cause micro-streaming in liquids
(Suslick, 1988), and they will have an effect similar
to the direct mixing of components. In this way, a
reduction of the transition temperature should
anyway be expected. An interesting reference in this
context are studies on the kinetics of protein
aggregation on agitation (stirring). Stirring was
clearly leading to an increase of the kinetics of
insulin fibrillogenesis with respect to an unstirred
reference sample (Grudzielanek, Smirnovas et al.,
2006). This was accordingly explained by
eliminating the diffusion control causing aggregation
nuclei immediately start growing. Similar
observations are reported for whey protein fibril
formation (Bolder, Sagis et al., 2007), here, also the
breaking up of immature fibrils is discussed,
suggesting a similar behaviour for the shorter fibrils
observed in the AFM images of our samples (not
shown).
REFERENCES
Bolder, S. G., L. M. C. Sagis, et al. 2007. "Effect of
stirring and seeding on whey protein fibril formation."
Journal of Agricultural and Food Chemistry 55(14):
5661-5669.
Bouchard, M., J. Zurdo, et al. 2000. "Formation of insulin
amyloid fibrils followed by FTIR simultaneously with
CD and electron microscopy." Protein Science 9(10):
1960-1967.
Dobson, C. M. 2003. "Protein folding and misfolding."
Nature 426(6968): 884-890.
Grudzielanek, S., V. Smirnovas, et al. 2006. "Solvation-
assisted pressure tuning of insulin fibrillation: From
novel aggregation pathways to biotechnological
applications." Journal of Molecular Biology 356(2):
497-509.
Suslick, K. S. (1988). Ultrasound: its chemical, physical,
and biological effects. New York, N.Y., VCH
Publishers.
Tata, D. B. and F. Dunn. 1992. "Thermodynamic method
of b/a analysis of liposome suspensions - prediction
via single relaxation theory." Journal of Ultrasound in
Medicine 11(8): 441-447.
Wu, J. and W. L. M. Nyborg (2006). Emerging therapeutic
ultrasound. Hackensack, N.J., World Scientific.
IN-SITU SPECTROSCOPIC INVESTIGATION OF UNFOLDING AND AGGREGATION OF INSULIN UNDER
ULTRASONIC EXCITATION - An Ultrasonic Actuator for FTIR-spectrometry on Biomatter
375
