
HUMAN PRESENCE DETECTION USING RADIO
IRREGULARITY IN WIRELESS NETWORKS
Human Detection in Energy Aware Residential Networks
Bojan Mrazovac
1
, Milan Z. Bjelica
1
, Dragan Kukolj
1
, Branislav M. Todorović
2
and Saša Vukosavljev
2
1
Faculty of Technical Sciences, University of Novi Sad, Trg Dositeja Obradovica 6, 21000, Novi Sad, Serbia
2
RT-RK Institute for Computer Based Systems LLC, Narodnog Fronta 23a, Novi Sad, Serbia
Keywords: Energy awareness, Domotics, RSSI, Radio irregularity, Smart outlets, Wireless sensor networks, Zigbee.
Abstract: The paper presents a human detection method applied to the intelligent device-level software platform for
residential energy management. The proposed solution increases user awareness and automates the power
control, with the primary goal to contribute in energy savings. Instead of using conventional presence
sensors as inputs for automated power management, the proposed solution utilizes a network of wireless
power outlets and monitors the variations of the signal strength indicator used for the communication
between them. The radio signals used for the inter-outlets communication can be scattered, absorbed or
reflected by objects in their propagation paths, such as a human body which additionally increases the
variation of the signal strength indicator at the receiver. This phenomenon is known as radio irregularity,
and is often considered as a shortcoming of radio networks. In this paper the idea of using radio irregularity
as efficient presence detection is proposed. With regard to conventional sensors, this solution preserves the
pervasiveness of smart energy and smart home systems, high level of sensorial intelligence and low
installation costs.
1 INTRODUCTION
Weiser’s dream has already begun (Weiser, 1999).
Our homes became temples of various integrated
services and intelligent devices that provide us with
necessary information, communication and
entertainment. With the capabilities built into
today’s gadgets to adapt their behaviour to a
consumer’s habits and manners, the possibilities are
unlimited. The complex infrastructure of smart
devices follows the trend to become ubiquitous,
seamlessly woven into the fabric of everyday life.
More complex infrastructure requires more
energy to be consumed. The required energy sources
have become exhausted and the solution to preserve
them is to increase user awareness. In order to
decrease the energy wasting, several solutions have
been already proposed. The most popular power
saving solutions are based on wireless smart outlets
(Song et al., 2008). By using smart outlets and web-
based power management services, consumers are
able to monitor the power consumption of each
plugged device and to perform a simple set of
commands (Weiss and Guinard, 2010). It is possible
to display the consumption of each appliance in
conjunction with the costs for a specific time period,
to switch it off or on and to protect from so called
“Vampire power loss” on standby outlets (Han et al.,
2009).
Even the consumers, which have insight into the
consumption data, usually forget to take small
corrective actions to improve the efficiency. The
main issue we indicate in existing systems is that the
energy management is based on a user’s instruction,
without the possibility for the system to adapt
automatically. For instance, the system should be
able to turn off or dim the lights in a room if no
people are present for a period of time. To enable the
system to react automatically, it is needed to
establish the interaction with the environment. This
interaction involves a number of sensors, used
mainly for human detection, that help creation of a
smart home ecosystem. Conventional sensors for
human and motion detection (passive infrared, 3D
camera, ultrasonic…) require additional costs and
installation procedures, complex data processing
algorithms and mostly, burdensome wiring
interfaces (Mrazovac et al., 2011). Technologies that
5
Mrazovac B., Z. Bjelica M., Kukolj D., M. Todorovi
´
c B. and Vukosavljev S..
HUMAN PRESENCE DETECTION USING RADIO IRREGULARITY IN WIRELESS NETWORKS - Human Detection in Energy Aware Residential
Networks.
DOI: 10.5220/0003803700050014
In Proceedings of the 1st International Conference on Sensor Networks (SENSORNETS-2012), pages 5-14
ISBN: 978-989-8565-01-3
Copyright
c
2012 SCITEPRESS (Science and Technology Publications, Lda.)

would affect humans in the future should become
transparent in the environment, ubiquitous and
always prepared to interact. By following such
trends, wireless sensor networks (WSN) are
considered as good solutions. However, instead of
using conventional wireless sensors for presence
detection, another approach would be to use the
impact of a person’s presence on wireless signals
nearby.
Some novel localization techniques analyze the
received signal strength indicator (RSSI). It is the
most applicable solution for WSN due to the low
deployment costs and easy integration into wireless
systems. In this paper, the method for indoor human
detection applied to the smart energy residential
wireless network is proposed. The method utilizes
wireless nodes which are part of pre-existing home
electrical installations (smart power outlets and light
switches) and communication signals nearby. In this
research the nodes have two roles: (a) control of the
plugged devices as well as of giving an overview on
energy consumption; (b) human presence detection
enabled by the analysis of the radio irregularities
between radio transceivers embedded in wireless
nodes. Since human body interferes with the radio
signal, irregularities in radio signatures can be used
as an indication of human presence within a room.
Presented processing algorithm for human detection
is of negligible complexity compared to the
conventional sensors. The proposed method
increases user awareness by enabling a certain level
of sensorial intelligence for automated operations
with the primary goal to achieve the energy savings.
To the best of our knowledge, there are no available
residential smart energy systems that are able to
monitor the consumption and, at the same time, to
detect human presence by analyzing and quantifying
the irregularities in radio signals used for
communication.
In the following section the method of using
RSSI variations for indoor human presence detection
is presented. The method extends an existing smart
energy infrastructure with the level of intelligence
for automated operations. Detailed measurements of
RSSI variations in different environments confirm
the usability of the proposed solution. At the end of
the paper a conclusion with the idea for the future
improvements is given. Experimental results show
the amount of saved energy achieved by using the
presented energy ecosystem combined with the
proposed human presence detection method.
2 DETECTION METHOD USING
RADIO IRREGULARITY
In this section the phenomenon of radio irregularity,
its causes and impact on signal propagation in
wireless networks are defined. In the subsection 2.1
the related work on the radio irregularity and the
relevance of such approach for human activity and
motion detection are shown. In the subsection 2.2
the method for indoor human presence detection is
proposed. The method is used as an integral part of
the energy aware ecosystem.
2.1 General Analysis of Radio
Irregularity – Related Work
Radio irregularity is a common phenomenon in
wireless networks. It arises from multiple factors,
such as different signal radiated powers caused by
hardware calibration and different path losses in
different directions of transmitted signal. Zhou, He,
Krishnamurthy and Stankovic (2004) set a number
of experiments which show that radio irregularity is
mainly caused by two factors: device properties and
the propagation medium. Device properties include
the antenna gain and type, the transmitter’s radiated
power, the receiver’s sensitivity and threshold and
signal-to-noise ratio (SNR). Medium properties
include the background noise and the environmental
factors like obstacles within the propagation media.
One of the major causes of radio irregularity is
the variation in the signal path loss. When the signal
travels through a medium, it may be scattered,
reflected or diffracted. Scattering occurs when the
signal propagates through a medium which contains
a large number of objects smaller than the signal’s
wavelength. Reflection occurs when the signal,
during its propagation through a medium, encounters
an object which is larger than the signal’s
wavelength. Diffraction occurs when the signal
encounters an irregular surface, such as sharp edges.
The signal path loss can be also affected with
hardware imperfections of transceivers. It is possible
that a transceiver does not have the same antenna
gain in all directions. The power supply (battery)
status change also leads to variations in signal
transmitting power by resulting in different signal
strengths at the receiver’s input
.
Signal strength variations in indoor environments
due to the radio irregularity are even more expressed
when a human body encounters the signal in its
propagation path. The human body is comprised of
skeleton, flesh and body liquids which are able to
additionally absorb, scatter or reflect the radio
SENSORNETS 2012 - International Conference on Sensor Networks
6

signal. Since human bodies interfere with the radio
signal, the presence of a subject in the wireless
network results in larger signal strength fluctuations
at the receiver input. One of the earliest researches
(Woyach et al., 2006) reports that the shadowing
effect caused by human subject moving in the line-
of-sight path between transmitter and receiver can be
used for human detection. This approach, mainly
based on RSSI variations monitoring at the receiver,
is extended for outdoor people counting mechanism
(Puccinelli et al., 2011). By analyzing the radio
irregularity phenomenon in WSN, Lee et al., (2010)
investigated the feasibility of intrusion detection
based on the signal strength fluctuations. They
succeeded to characterize the signal strength
fluctuations and translate them into sufficient
information that corresponds to a human activity.
The idea of using RSSI fluctuations is applied on an
indoor automated people counting mechanism (Lin
et al., 2011).
It is important to mention that a human body in
the aforementioned researches neither transmit nor
receive any form of wireless signal unlike the
researches presented by Ahn and Yu (2009) and
Chen et al., (2008) and references therein. These
researches present the techniques of localizing
unknown nodes positions and tracking of mobile
wireless devices within a wireless sensors network.
The presented techniques are also “supported” with
the radio irregularity and the variations of the RSSI
between network nodes.
2.2 Presence Detection Method
The primary focus of this method is presence
detection, which means that a subject may be static
within the sensing area. The proposed solution
allows the system to be always aware of human
presence or motion even if a person sits or sleeps
inside a room, making the environment more
comfortable for living. Presence detection method is
mainly based on utilizing the shadowing effects
between stationary wireless nodes which line-of-
sight is obstructed by a human body.
RSSI often fluctuates in different environments
with higher or smaller variations around the mean
value. Experimental analysis presented in section 4
confirms that the RSSI variation over a period of
time is even more expressed when a person is
present. In an empty room, the initial RSSI variation
defines the interval of initial signal strength variation
(ISSV). This interval is set during the system
initialization when wireless nodes communicate with
each other by exchanging the messages and values
of RSSI for each communication link, making the
“radio image” of the environment. During the initial
phase, the sensing area is empty and the RSSI is
only obstructed by the environmental and devices
properties. Signal strength variation in initial
conditions is used to define the high and the low
bounds (thresholds) of ISSV. The ISSV bounds are
calculated based on a set of RSSI samples taken for
a minute. This time interval is not strictly defined; it
is chosen to be one minute because of a round
number of samples obtained from nodes during the
interval. The number of nodes in this research is 4
and the polling time of each node is 100ms. After
the set of one minute samples is formed, the
standard deviation and the expression given in (1),
which calculates the ISSV bounds, are executed.
ISSV bounds algorithm is based on a comparison of
the differences between the mean value (
x
) of the
set and the set’s min and max values (
xmin/max).
100)/(
maxmin/maxmin//
xxxISSV
lowhigh
(1)
The comparison of the mean value against the
min/max values defines ISSV bounds whereas
standard deviation is the additional control factor.
These three elements together define the detection
condition. Within the ISSV, RSSI can vary without
recognized detection. When a human enters the
sensing area the RSSI starts to vary greatly by
exceeding the ISSV bounds and deviating from
control factors, which results in detected presence.
Two bounds are used, because the signal’s nature is
such that it can vary below and above its mean
value. The signal deviation can vary significantly
across different environments, making the definition
of universal bounds difficult. That is the main
argument why the bounds definition is necessary
during the initial phase. Bounds are also recalculated
periodically for the case of room layout change
(positioning the furniture). The one minute sliding
window of RSSI samples periodically calculates the
standard deviation based on the received samples.
During the initial phase, the signal deviation is very
small. When a subject enters the room and obstructs
one of the propagation paths the RSSI deviation on
that radio link is increased. After the subject exits
the room, the recalculated signal deviation value is
restored to the initial. If the subject changes the
furniture layout before leaving a room, the new
layout also increases signal deviation. The additional
software mechanism monitors the signal deviation
over period of environment changes (PEC). If the
signal deviation is constant during the PEC interval,
regardless of the initial value, the system detects
room layout change and new ISSV bounds are
HUMAN PRESENCE DETECTION USING RADIO IRREGULARITY IN WIRELESS NETWORKS - Human Detection
in Energy Aware Residential Networks
7
recalculated based on the last minute of samples.
Realization of the system includes at least two
wireless nodes (outlets or in combination with light
switches). The communication control and the ISSV
analysis are implemented in the associated control
unit (Home Controller - HC) which is made in the
form of an embedded PC. These basic system units
communicate with each other and monitor the ISSV.
At the same time, these components provide the
automated energy management. As the final result
the system controls e.g. lighting in a room, but in
addition to the lighting control, the system can be
preconfigured to control any other device which is
connected to the smart outlets.
The contribution of the presented solution is the
reduction of a number of physical devices and the
elimination of additional sensors (presence sensors
and RFID tags). To the best of our knowledge, this
is the first RSSI variation monitoring algorithm
applied solely to the smart power outlets extended to
detect human presence. Experimental confirmation
of the proposed presence detection method extends
the related researches mentioned in section 2.1
which analyse the techniques for motion detection.
3 THE SMART ENERGY
RESIDENTIAL ECOSYSTEM
The proposed method for human detection is applied
to the smart energy residential ecosystem. The smart
energy ecosystem consists of a home controller
device and a number or smart power outlets and
light switches mounted in existing home electrical
installations. The system analyzes RSSI fluctuations
between wireless nodes (outlets and light switches)
conditioned by human entering or leaving a room (as
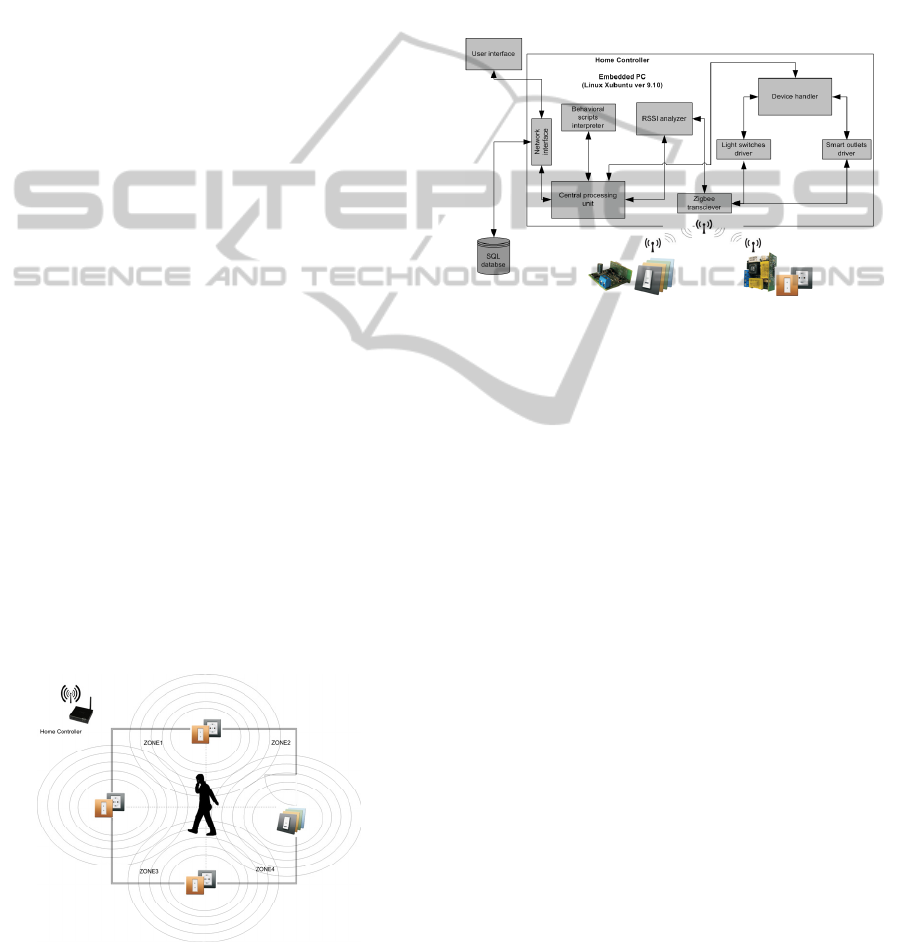
illustrated on Figure 1).
Figure 1: Presence detection in smart energy ecosystem.
3.1 The Home Controller
The home controller (illustrated in Figure 2) presents
a software platform based on open standards
(POSIX/C) which provide scalability. The controller
is platform independent, and currently it can be
easily installed on both Windows and Linux OS
platforms. The design of the platform’s modules
ensures that new devices (additional outlets or
switches) can be added seamlessly, without re-
architecture of the platform’s design.
Figure 2: The Home Controller design overview.
The device handler is connected to device drivers
units providing a communication mechanism with
the nodes. This module is in charge of sending the
control messages as the responses on detection
events. The RSSI analyzer module performs periodic
polling of outlets and light switches to retrieve the
current values of RSSI. The RSSI analyzer has
access to the list of nodes’ addresses, polls them in
turn on every 100ms and saves the received values
in the local storage database.
After a node receives the polling command from
the controller it sends its RSSI table as broadcast
message. The message contains a table of RSSI
values toward all links (other nodes) within a room.
During the period of one node polling the other
nodes are in the “listening” mode, so there is no
interference or superposition between them. The
broadcast message is received on the
controller side
as well as by other nodes which then update their
RSSI tables with the values of signal strength from
that link. The nodes are able to receive the message
from the home controller as well as from other
nodes. After the message is received, the RSSI
analyzer saves the received samples into the local
database and waits for the next 100ms, to poll
another node. The procedure is repeated until all
nodes send their RSSI values toward all links. After
the RSSI table is completed, the processing module
calculates standard deviation and ISSV bounds.
SENSORNETS 2012 - International Conference on Sensor Networks
8

After the bounds are defined, the polling procedure
is repeated for obtaining new samples which are
compared with the predefined bounds. If the samples
exceed the ISSV, the presence is detected.
The concept of behavioural patterns, explained
in details by Bjelica et al., (2011), enables the
energy ecosystem to be used for various setups of an
environment. Behavioural patterns are presented in
the form of XML (Extensible Markup Language)
scripts which define timely actions and respond to
external events, such as human detections, with the
primary goal to achieve desired energy consumption
scheme. The scripting language is similar to high-
level programming languages by having a support
for declaration and usage of variables, loops, if-then-
else constructs, delays and sleep instruction and the
commands for control of smart outlets and light
switches. The script interpreter module (shown as a
block in Figure 2) executes the script and interprets
the behaviour. Mrazovac et al., (2011) described the
design of the smart energy residential ecosystem
which is used as the power management platform,
including its comparison with commercially
available solutions for smart power metering such as
Plogg, Plugwise and digitalStrom. The proposed
algorithm for presence detection can be integrated
into various wireless power outlets and other similar
solutions, by extending their metering purpose with
the detection capability.
The home controller software runs on a PC based
on CPU Intel Atom Z530 1.6GHz with 2GB DDR2
RAM under Linux OS. The communication protocol
is ZigBee (IEEE 802.15.4) which is established by
using CC2531 USB dongle.
3.2 Smart Outlets and Light Switches
Smart outlets and smart light switches, presented by
Mrazovac et al., (2011), fit into existing electrical
installations, standard sockets on the wall. Smart
outlet provides power to electrical devices with
standard flat, two-pole AC power plug, called
Europlug (CEE 7/16) which is designed for voltages
up to 250V and currents up to 2.5A. Besides simple
on/off switching it is able to pass any percentage of
power to the consuming electric devices (e.g. a light
dimmer).
TI CC2530 ZigBee RF transceiver
(2.4GHz) is used as the communication module. It
has an RSSI status register which value represents
the signal strength in 8bit basis. Smart outlets are
powered from 220-240Vac (±10%) 50Hz current
electric power supply. It is the cheapest and the
safest way which provides full compatibility with
the regulatory requirements. With an average current
of 35mA and operational voltage of 3.3V for an
outlet and 2.4V for a switch, the power consumption
is around 0.12W per outlet and 0.08W per switch.
4 EXPERIMENTAL RESULTS
In this section the analysis of RSSI variations caused
by a human presence in two different environments
is presented. The mean value, the standard deviation
and ISSV bounds calculated for a testing time period
are presented. The system described in section 3 has
been installed in two buildings whose walls were
made of different materials: (a) gypsum with
fibreglass isolation, (b) aluminium with plastic
covers and fibreglass isolation. The RSSI variations
in such environments and processing results are
shown in the following subsections. Four nodes have
been used for each experiment, three outlets and one
light switch, which is often room situation.
4.1 Gypsum Wall
The first set of tests was performed in a building
which walls were made of gypsum attached to the
construction elements (steel) and isolated with
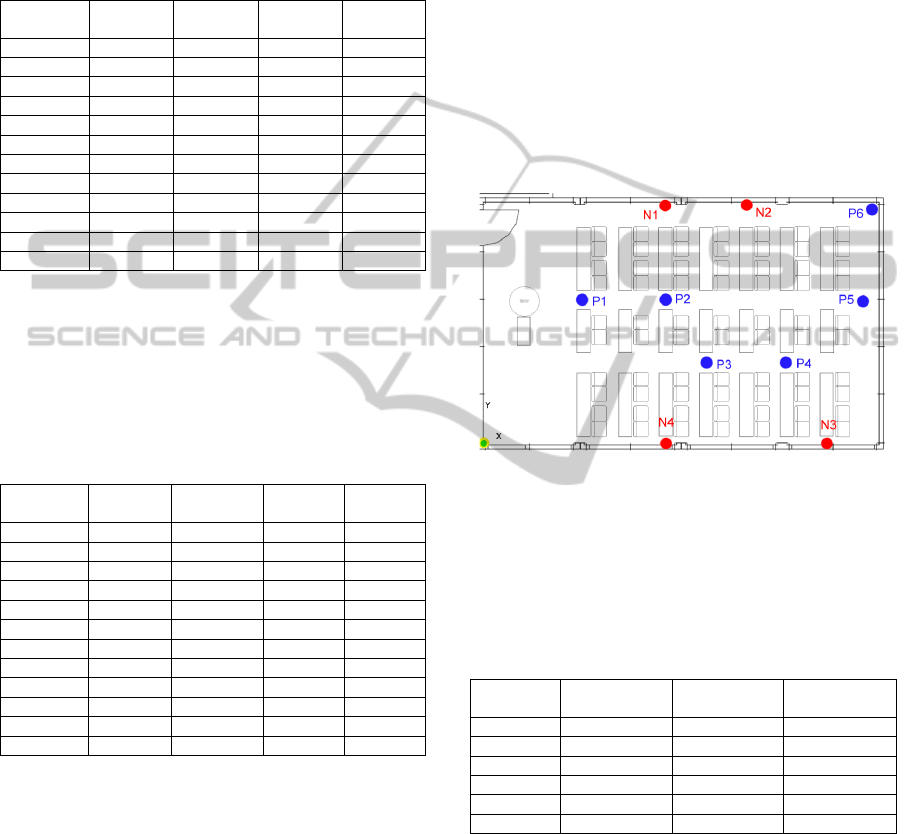
fibreglass. The wall thickness was 15 cm. The layout
of a testing room is shown on Figure 3. Red points
illustrate the nodes positions, blue the subject’s
positions and yellow point with green spot illustrates
the central (x=0, y=0) position. Nodes were placed
at an elevation of 40 cm (switch was at 1.20cm)
above the floor.
Figure 3: Room with gypsum walls isolated with
fibreglass.
The room dimensions were 536×530cm. The
distance (in cm) of each node from the central
position is shown in the first two columns of Table
1. The last two columns show the positions of a
subject within the room.
HUMAN PRESENCE DETECTION USING RADIO IRREGULARITY IN WIRELESS NETWORKS - Human Detection
in Energy Aware Residential Networks
9
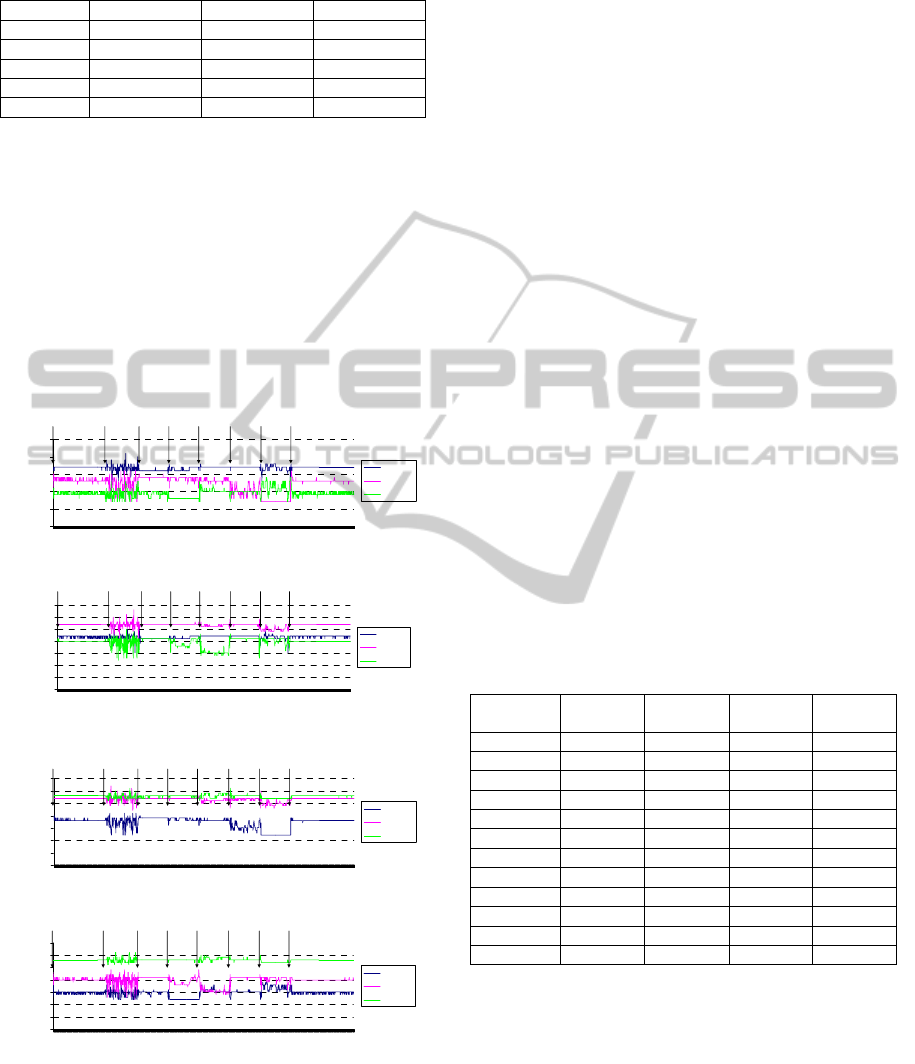
Table 1: Nodes’ and subjects positions – gypsum walls
environment.
Node name Distance (cm) Position name Distance (cm)
N1 (73, 211) P1 (0, 78)
N2 (54, 477) P2 (270, 75)
N3 (474, 428) P3 (424, 254)
N4 (519, 66) P4 (306, 420)
- - P5 (120, 255)
The test scenario was the following: the room
was empty for a period of two minutes, and no
detection was reported. Once a subject entered the
room, he performed walking within the room by
passing the positions P shown in the Figure 3. After
one minute of walking, the subject was standing in
each position P for one minute without movements.
The scenario tried to confirm the hypothesis that is
possible to distinguish motion, presence or an empty
room. The raw samples of RSSI variations retrieved
from each node are shown in Figure 4.
N1 links
185
190
195
200
205
210
1 104 207 310 413 516 619 722 825 928 1031 1134 1237 1340
RSSI samples
8bit value
N1- >N2
N1- >N3
N1- >N4
Init P1 P2 P3 P4 P5 No humansWalk
N2 links
180
185
190
195
200
205
210
215
1 104 207 310 413 516 619 722 825 928 1031 1134 1237 1340
RSSI samples
8bit value
N2-> N1
N2-> N3
N2-> N4
Init P1 P2 P3 P4 P5 No humansWalk
N3 links
180
185
190
195
200
205
210
215
1 104 207 310 413 516 619 722 825 928 1031 1134 1237 1340
RSSI sam
p
les
8bit value
N3-> N1
N3-> N2
N3-> N4
Init P1 P2 P3 P4 P5 No humansWalk
N4 links
180
185
190
195
200
205
210
215
1 104 207 310 413 516 619 722 825 928 1031 1134 1237 1340
RSSI sam
p
les
8bit value
N4-> N1
N4-> N2
N4-> N3
Init P1 P2 P3 P4 P5 No humansWalk
Figure 4: Experimental results for gypsum walls.
From the Figure 4 it can be observed that in the
position P1 the RSSI variation was the highest for
the link N1→N4 in both directions. It is explained as
a result of signal reflection by the human body
which was very close to the line-of-sight between
outlets N1 and N4. In the position P2, the human
body shadowed the links N1→N4 and N4→N1, so
the most of the radio signal was absorbed by the
human body which was the main reason for lower
RSSI values. In the position P2, the links N2→N4
and N4→N2 were distorted with the reflection by
the human body, so the high RSSI variation in the
position P2 for links between outlets N2 and N4 can
be noticed. The position P2 had slight influence on
the links N1→N3 and N3→N1, which were also
distorted by the vicinity of human body which
slightly reflected the signal. The human position P3
mostly absorbed the signal from the links N2→N4
and N4→N2, and also reflected the signals from the
links N3→N4, N4→N3 and N1→N4, N4→N1.
Position P4 shadowed the links N1→N3 and
N3→N1 and absorbed the signal. The position P5
also shadowed the links N1→N3 and N3→N1 and
reflected the signals from the rest of links, except for
N3→N4 and N4→N3 which were far from the
human. At the end of the experiment the room was
empty again for two minutes.
In the Table 2, the standard deviation (Std.
Deviation), the mean value (Mean value) and the
ISSV bounds calculated by (1), are shown.
Calculations are performed over a set of initial two-
minute samples retrieved during the time when the
room was empty.
Table 2: Initial state - gypsum walls.
Link Mean
value
Std.
Deviation
Min var
[%]
Max var
[%]
N1→N2 201.99 0.11 0.49 0.01
N1→N3 198.22 0.48 1.13 0.89
N1→N4 194.38 0.52 0.72 0.82
N2→N1 201.74 0.44 0.37 0.13
N2→N3 207 0.07 0 0.48
N2→N4 200.03 0.16 0.01 0.48
N3→N1 198.10 0.31 0.05 0.95
N3→N2 207 0 0 0
N3→N4 208 0.07 0.48 0
N4→N1 194.75 0.4 0.91 1.64
N4→N2 200.13 0.41 1.07 1.41
N4→N3 208 0 0 0
The Table 3 shows ISSV bounds and the signal
strength deviation when the human was standing in
the position P1. The calculations are performed over
a set of one minute samples.
Position P1 was very close to nodes N1 and N4,
so the RSSI variation for this link in both directions
was the highest, because of the body which reflected
the signal, resulting in a higher standard deviation.
ISSV bounds also show the highest values for these
SENSORNETS 2012 - International Conference on Sensor Networks
10
two links. Comparing with the initial measurements
it can be seen that these values exceed the initial
ISSV bounds and the signal strength deviation. It is
enough that the values exceed the ISSV interval at
only one link and the presence would be reported.
Table 3: Position P1 – gypsum walls.
Link Mean
value
Std.
Deviation
Min var
[%]
Max var
[%]
N1→N2 201.05 0.09 0 0.49
N1→N3 198.95 0.13 0.5 0.53
N1→N4 194.29 0.78 1.19 0.36
N2→N1 201 0 0 0
N2→N3 206.99 0.09 0.28 0
N2→N4 200.98 0.13 0.49 0.01
N3→N1 199 0 0 0
N3→N2 207 0 0 0
N3→N4 207.82 0.18 0.4 0.08
N4→N1 194.82 0.59 0.94 0.63
N4→N2 201 0 0 0
N4→N3 208 0 0 0
The position P2 (shown in Table 4) is in the line-
of-sight between nodes N1 and N4, so the most of
the signal was absorbed by the human body, and
also no high deviations were observed. But
reflection by the body detected on the links N2→N4
and N4→N2 has reported detection.
Table 4: Position P2 - gypsum walls.
Link Mean
value
Std.
Deviation
Min var
[%]
Max var
[%]
N1→N2 201.47 0.5 0.24 0.26
N1→N3 198.66 0.55 1.36 0.17
N1→N4 193 0 0 0
N2→N1 201.4 0.49 0.2 0.3
N2→N3 207.02 0.12 0.01 0.47
N2→N4 199.09 1.28 1.06 0.95
N3→N1 198.6 0.49 0.3 0.2
N3→N2 207.02 0.12 0.01 0.47
N3→N4 207.91 0.28 0.44 0.04
N4→N1 192.01 0.09 0 0.51
N4→N2 199.13 1.25 1.6 1.42
N4→N3 207.98 0.12 0.48 0.01
Because the paper size is limited, it is not
possible to show the rest of the results for all the
positions, but the conclusion is the same: RSSI for
all nodes that communicate far from the human’s
position vary slightly or has a constant value. When
a human is close to a node, but not in the line-of-
sight, the RSSI varies greatly because of the signal
reflection which is shown to be the most powerful
radio irregularity feature that can report presence in
this environment. When a human shadows the line-
of-sight, the RSSI deviation is very low, and the
signal strength does not exceed the ISSV. But, the
other links which line-of-sight is near are distorted
with the reflection. It is enough that RSSI exceeds
the ISSV only on one link and the detection would
be reported.
4.2 Aluminium Wall with Combination
of Plastic
The second set of measurements was performed in a
building which walls were made of aluminium and
plastic slices with fibreglass isolation. The room
dimensions were 960×580 cm and the wall thickness
was 30 cm. Red points illustrate the nodes positions,
blue the subject’s positions and yellow point with
green spot illustrates the central position. The room
layout is shown in Figure 5.
Figure 5: Room with aluminium and plastic walls.
The distance (in cm) of each node from the
central position is shown in the first two columns of
Table 5. The last two columns show the positions of
a subject within the room.
Table 5: Nodes’ and subjects positions – alu/plastic walls
environment.
Node
name
Distance (cm) Position
name
Distance (cm)
N1 (410,530) P1 (220,305))
N2 (600,530) P2 (410,305)
N3 (795,40) P3 (500,150)
N4 (410,40) P4 (690,150)
- - P5 (945,305)
- - P6 (955, 500)
This environment is interesting because of the
wall structure, which forms a Faraday’s cage so the
signal is strongly reflected by the walls. From the
initial measurements shown on Figure 6 it can be
noticed that the signal strength varies even in an
empty room, so the initial values for Min var and
Max var, including signal strength deviation are
higher than the initial values in previous building.
The test scenario was slightly different from the
scenario explained in the previous subsection. The
HUMAN PRESENCE DETECTION USING RADIO IRREGULARITY IN WIRELESS NETWORKS - Human Detection
in Energy Aware Residential Networks
11
room was empty for a period of two minutes, and no
detection was reported. Once a subject entered the
room, he was standing in each position P from
Figure 5 for one minute without movements. After
samples from all P positions were collected, the
subject performed one minute walking within the
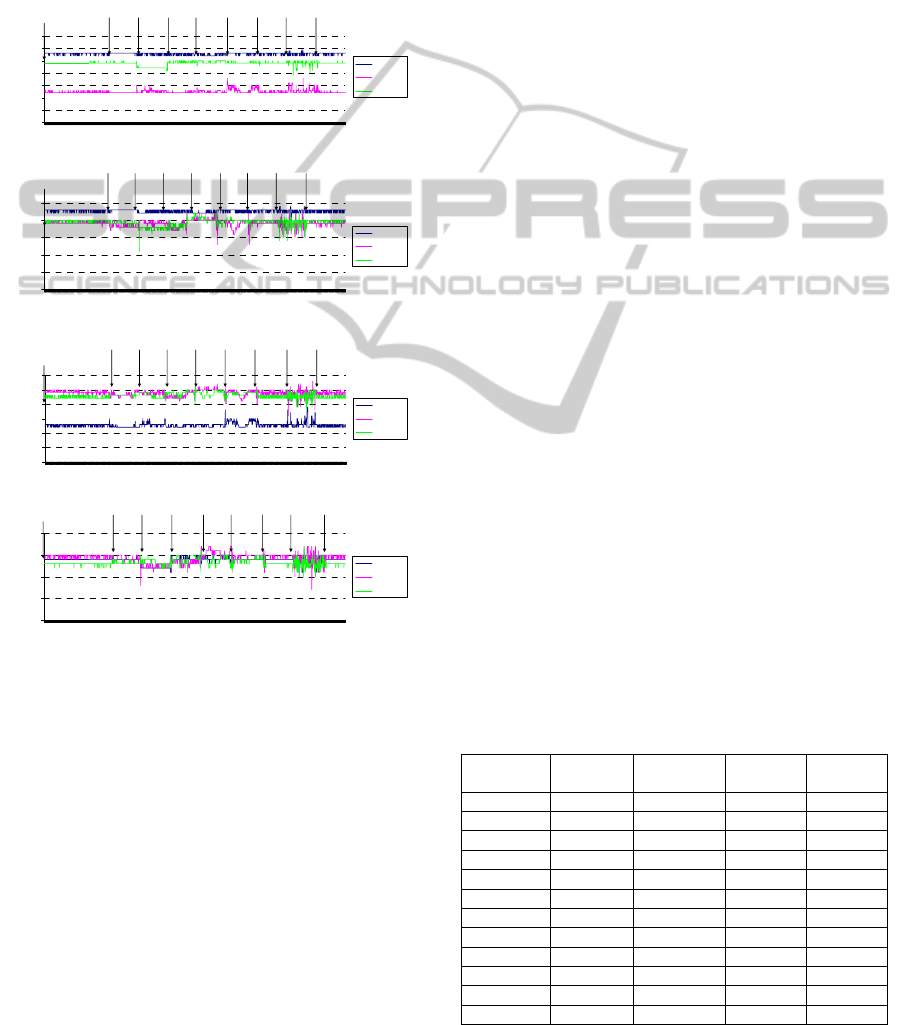
room by passing the positions P. The raw samples of
RSSI variations retrieved from each node in this
environment are shown in Figure 6.
N1 links
180
185
190
195
200
205
210
215
1 104 207 310 413 516 619 722 825 928 1031 1134 1237 1340
RSSI samples
8bit value
N1- >N2
N1- >N3
N1- >N4
Init
P2 P3 P4 P5 Walk No humansP1 P6
N2 links
185
190
195
200
205
210
1 104 207 310 413 516 619 722 825 928 1031 1134 1237 1340
RSSI sam
p
les
8bit value
N2- >N1
N2- >N3
N2- >N4
Init
P2 P3 P4 P5 Walk No humansP1 P6
N3 links
180
185
190
195
200
205
210
1 104 207 310 413 516 619 722 825 928 1031 1134 1237 1340
RSSI samples
8bit value
N3- >N1
N3- >N2
N3- >N4
Init
P2 P3 P4 P5 Walk No humansP1 P6
N4 links
190
195
200
205
210
1 104 207 310 413 516 619 722 825 928 1031 1134 1237 1340
RSSI samples
8bit value
N4-> N1
N4-> N2
N4-> N3
Init
P2 P3 P4 P5 Walk No humansP1 P6
Figure 6: Experimental results for alu/plastic walls.
From the Figure 6 it can be observed that in the
position P1 the RSSI variation was low or similar to
the initial state (empty room) for all the links. This is
explained as a result of strong signal reflection by
the walls combined with the human body which was
close to the N1 and N4. In the position P2, the
human body shadowed the links N1→N4 and
N4→N1, so the most of the radio signal was
absorbed by the human body which was the main
reason for lower RSSI values. The position P2 had
slight influence on the links N1→N3, N3→N1,
N2→N4 and N4→N2, which were distorted by the
vicinity of human body which slightly reflected the
signal. The human position P3 reflected the signal
from the links between nodes N2 and N4 and also
reflected the signals from links N2→N3, and
N3→N4 in both directions. Position P4 strongly
reflected the signals on links between nodes N2 and
N4, and also N3 and N4. The position P4 slightly
absorbed the signals between nodes N2 and N3. The
position P5 showed RSSI variations on links
between nodes N1 and N3, which is the most
probably because of the signal reflection by the wall
and human body which were close to each other.
The strongest impact on the signal strength in the
position P5 was noticed for the links between nodes
N2 and N3. The position P5 reflected the signal, and
together with the wall reflection increased the RSSI
variation. The position P6 which was the furthest
position from all nodes, showed very low signal
strength variations. The system did not detect a
subject standing in the position P6 - “blind position”.
Since the room was large, during the nodes
positioning installers did not keep in mind to cover
all “blind positions”. So for larger rooms the
installers should consider installing more outlets for
better radio coverage, which is usually the case for
larger rooms. Otherwise, the system will report false
detections. At the end of the experiment the subject
was walking around the room, trying to move closer
to nodes N2, N3 and N4, and radio links therein,
without obstructing the line-of-sight between nodes
N1 and N2. After the one minute of walking, the
room was empty.
From the Figure 6 it can be observed that the
wall reflection and reflection by the human body
mostly affected signals in this environment. The
Table 6 shows the measurement results for the initial
state. Tables 7 shows the measurement results for
the position P5 which mostly interfered with the
radio signals in this environment. The table 8 shows
the results in position P6 which is the furthest
position from all wireless nodes.
Table 6: Initial state – alu/plastic walls.
Link Mean
value
Std.
Deviation
Min var
[%]
Max var
[%]
N1→N2 207.86 0.35 0.41 0.07
N1→N3 192.22 0.41 0.11 0.40
N1→N4 204.03 0.16 0.01 0.47
N2→N1 207.78 0.41 0.38 0.11
N2→N3 204.26 0.45 0.62 0.36
N2→N4 204.82 0.39 0.4 0.09
N3→N1 192.74 0.46 0.38 1.16
N3→N2 204.06 0.53 1.02 0.46
N3→N4 202.47 0.51 0.23 0.75
N4→N1 204.01 0.08 0 0.48
N4→N2 204.81 0.39 0.40 0.09
N4→N3 202.96 0.2 0.47 0.02
SENSORNETS 2012 - International Conference on Sensor Networks
12
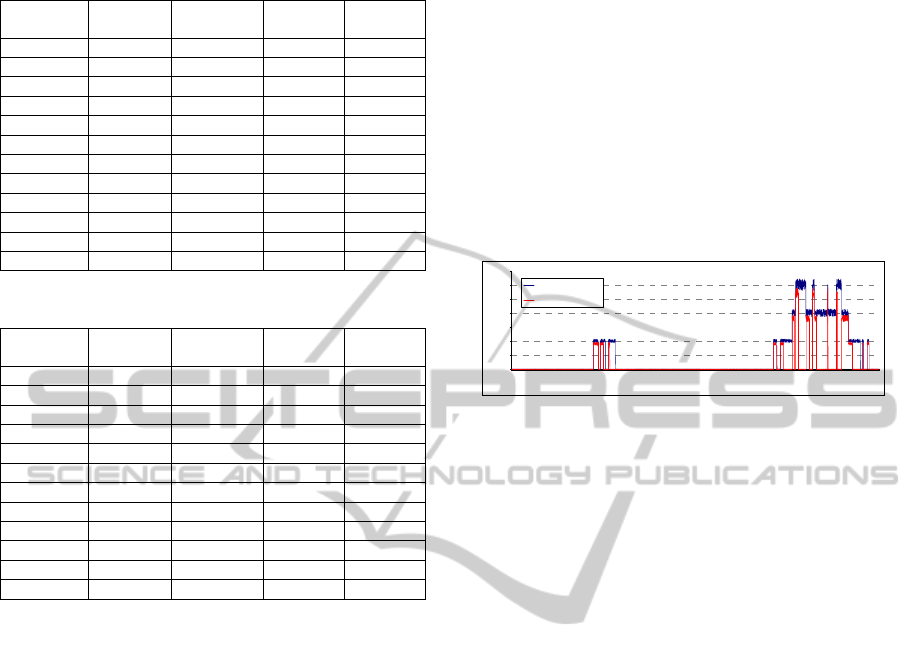
Table 7: Position P5 – alu/plastic walls.
Link Mean
value
Std.
Deviation
Min var
[%]
Max var
[%]
N1→N2 207.87 0.34 0.42 0.06
N1→N3 193.04 1.16 0.54 2.5
N1→N4 204.08 0.28 0.04 0.45
N2→N1 207.64 0.48 0.31 0.17
N2→N3 203.74 1.35 2.9 1.57
N2→N4 204.88 0.51 1.42 0.55
N3→N1 193.31 1.07 0.68 0.87
N3→N2 203.68 1.29 1.84 1.6
N3→N4 203.5 0.63 1.25 0.73
N4→N1 204.12 0.38 0.55 0.43
N4→N2 204.84 0.74 1.41 1.04
N4→N3 203.71 0.78 1.35 0.63
Table 8: Position P6 – alu/plastic walls.
Link Mean
value
Std.
Deviation
Min var
[%]
Max var
[%]
N1→N2 207.86 0.35 0.42 0.07
N1→N3 192.26 0.44 0.14 0.38
N1→N4 204.07 0.26 0.03 0.45
N2→N1 207.79 0.41 0.38 0.1
N2→N3 204.25 0.43 0.12 0.37
N2→N4 204.86 0.35 0.42 0.07
N3→N1 192.77 0.42 0.4 0.12
N3→N2 203.84 0.67 0.41 0.56
N3→N4 202.46 0.50 0.23 0.27
N4→N1 204.02 0.23 0.5 0.48
N4→N2 204.84 0.52 1.41 0.56
N4→N3 202.96 0.18 0.48 0.02
The results in this room are different from those
in the first building. The reflection by the human
body interfered with the walls reflection mostly
affected the radio signals. But even in such
environment, the presence and motion detection can
be easily recognised.
5 POWER MANAGEMENT
EXPERIMENT
The presented human detection method implemented
for residential smart energy management was
analyzed in the experiment of controlling 7 bulbs of
100 Watts. The regular control included the worst
case when a user leaves the light on, after leaving a
room. The presented system for energy consumption
control switched off the light automatically after 5
seconds if no humans were detected within a room.
In the Figure 7 the achieved power savings in the
testing house (110m²) applied to the lighting control
are shown. The test has been performed during one
working day with four-member family (two adults
and two kids). The house contained three bedrooms,
one kitchen and dining room, one bathroom, one
foyer and one living room. Test subjects performed
normal behaviour at home, trying to manually save
the electric energy by switching off the lights in all
empty rooms (shown as a blue line in Figure 7). In
each room one lamp was plugged to a smart power
outlet and one to a standard power outlet. Smart
power outlets with plugged lamps were under
automatic switch control, whereas standard power
outlets were under users’ manual control. Supported
with the proposed presence detection algorithm the
energy consumption used for lights was lower from
1260 Watts to 780 Watts at the end of the day.
0
50
100
150
200
250
300
350
0
0
1
2
2
3
4
4
5
6
6
7
8
8
9
10
10
11
12
12
13
14
14
15
16
16
17
18
18
19
20
20
21
22
22
23
Hour (t)
Watts (W)
Without energy saving
With energy saving
Figure 7: The energy saving experiment supported with
the proposed presence detection method.
6 CONCLUSIONS
In this paper the novel method for human detection
applied to an energy aware residential network is
presented. The method utilizes radio irregularity
phenomenon to detect human presence. To the best
of our knowledge this is the first paper presenting
the human presence detection achieved by using a
network of smart power outlets and light switches
within a room. The presented analysis confirms the
hypothesis that the presence detection is possible by
monitoring the radio signal variations between
wireless power outlets. The proposed solution
defines the RSSI variations bounds during the
system initialization and periodically if the static
signal deviation is noticed. When a human enters the
sensing area, RSSI values exceed the interval’s
thresholds resulting in reported detection. It can be
concluded that for larger rooms, the level of false
detections increases. It is shown that some positions
in a large room were out of the detection scope. For
that case the detection accuracy was 86%. For the
standard room dimensions, the detection accuracy
was 100%. Correct detection requires good radio
coverage within a room which depends on the
nodes’ positions. As the future improvement the
authors will try to replace the ISSV definition
algorithm with another metric which will recognize
a presence in the system by using a single parameter.
The benefit of such an approach would facilitate the
installation of a larger number of additional smart
HUMAN PRESENCE DETECTION USING RADIO IRREGULARITY IN WIRELESS NETWORKS - Human Detection
in Energy Aware Residential Networks
13

outlets without changing the core of the processing
algorithm. The energy savings achieved by using the
smart energy ecosystem supported with the proposed
detection method are significant. Authors believe
that this idea will encourage other manufacturers to
apply the presented approach to their smart meters
and help the global awareness for energy saving.
ACKNOWLEDGEMENTS
This work was partially supported by the Ministry of
Education and Science of the Republic of Serbia
under the Grant projects TR-36029, TR-32034 and
TR-32041, year 2011.
REFERENCES
Weiser, M., (1999). The Computer for the 21st Century.
ACM SIGMOBILE Mobile Computing and
Communications, Vol. 3, No. 3, 3–11.
Song, G., Ding, F., Zhang, W. and Song, A., (2008). A
wireless power outlet system for smart homes. IEEE
Trans. on Consumer Electronics, Vol. 54, No. 4,
1688-1691
Weiss, M. and Guinard, D., (2010). Increasing Energy
Awareness Through Webenabled Power Outlets. Proc.
of 9th ACM Inter. Conf. on Mobile and Ubiquitous
Multimedia, doi:10.1145/ 1899475.1899495
Han, J., Lee, H. and Park, K. R., (2009). Remote-
Controllable and Energy-Saving Room Architecture
based on ZigBee Communication. IEEE Trans. on
Consumer Electronics, Vol. 55, No. 1, 264-268.
Mrazovac, B., Bjelica, M. Z., Papp, I., Teslic, N., (2011).
Smart Audio/Video Playback Control Based on
Presence Detection and User Localization in Home
Environment. Proc. of 2
nd
Conference on the
Engineering of Computer Based Systems (ECBS-
EERC ’11), doi: 10.1109/ECBS-EERC.2011.16
Zhou, G., He, T., Krishnamurthy, S. and Stankovic, J. A.,
(2004). Impact of radio irregularity on wireless sensor
networks. In proc. Of MobiSys ‘04, doi:10.1145/
990064.990081
Woyach, K., Puccinelli, D. and Haenggi, M., (2006).
Sensorless sensing in wireless networks:
Implementation and measurements. In proc. Of the 2
nd
International Workshop on Wireless Network
Measurement (WiNMee), 1-8
Puccinelli, D., Foerster, A., Puiatti, A. and Giordano, S.,
(2011). Radio-based trail usage monitoring with low-
end motes. In proc. Of the 7
th
IEEE International
Workshop on Sensor Networks and Systems for
Pervasive Computing (PerSeNS), 196-201
Lee, P. W., Seah, W. K. G., Tan, H.-P., Yao, Z., (2010).
Wireless Sensing Without Sensors – An Experimental
Study of Motion/Intrusion Detection using RF
Irregularity. Measurement Science and Technology,
Vol. 21, No. 12, doi:10.1088/0957-0233/21/12/124007
Lin, W.-C., Seah, W. K. G., Li, W., (2011). Exploiting
Radio Irregularity in the Internet of Things for
Automated People Counting. Accepted by the 22nd
Annual IEEE International Symposium on Personal,
Indoor and Mobile Radio Communications (PIMRC)
Ahn, H.-S. and Yu, W., (2009). Indoor Localization
Techniques based on Wireless Sensor Networks.
Mobile Robots - State of the Art in Land, Sea, Air, and
Collaborative Missions, 277-302.
Chen, C.-C., Wang, D.-C. and Huang, Y.-M., (2008). A
Novel Method for Unstable-signal Sensor Localization
in Smart Home Environments. International Journal
of Smart Home, Vol. 2, No. 3, 55-72
Bjelica, M. Z., Mrazovac, B., Teslic, N., (2011).
Evaluation of the Available Scripting Languages for
Home Automation Networks: Real World Case Study.
Proc. of 10th Intern. Conference on
Telecommunications in Modern Satellite, Cable and
Broadcasting Services (TELSIKS’11).
Mrazovac, B., Bjelica, M. Z., Papp, I., Teslic, N., (2011).
Towards Ubiquitous Smart Outlets for Safety and
Energetic Efficiency of Home Electric Appliances.
Proc. of Intern. Conference on Consumer Electronics
(ICCE ’11), doi: 10.1109/ICCE-Berlin.2011.6031795.
SENSORNETS 2012 - International Conference on Sensor Networks
14
