
NEW HYBRID P2P COMMUNICATION MODELS FOR REMOTE
TERRAIN INTERACTIVE VISUALIZATION SYSTEMS
Ricardo Olanda, Mariano P´erez and Juan Manuel Ordu˜na
Departamento de Inform´atica, University of Valencia, Burjassot, Valencia, Spain
Keywords:
Interactive Terrain Visualization, Real Time Graphics, Peer to Peer.
Abstract:
Over the last years, there has been a great development on real time terrain visualization applications us-
ing remote databases. One of the main problems that these applications must face is the system scalability.
These applications usually use a client-server model that cannot support a large number of concurrent requests
without using a considerable number of servers. In this paper, we propose a new hybrid P2P models for ter-
rain interactive visualization systems. The comparative performance evaluation results show that the system
throughput achieved by these strategies can be more than three times higher than the hybrid P2P strategy
proposed in the literature, significantly improving the scalability of these systems.
1 INTRODUCTION
Real-time terrain visualization is a very active re-
search field in the area of computer graphics. We can
find a large number of applications, where one of the
main tasks is to display virtual terrain models at inter-
active frame rates.
This virtual terrain information is usually stored
in large remote server databases. Since users visual-
ize only a small portion of this information, usually
they prefer to download only the required informa-
tion, rather than store the whole databases in theirs
computer local disks. Nowadays, the terrain visual-
ization applications usually use a client-server model
(C/S model) to access these remote databases over the
Internet due to its ease of management. However, this
model has a limited system scalability.
In order to solve this problem, peer to peer (P2P)
models could be used. There are two main types of
P2P models (Scholmeier, 2001): pure P2P models,
where each computer node act as client and server
simultaneously, and hybrid P2P models, where ad-
ditional computer nodes act as system server exclu-
sively. A pure P2P model presents some important
disadvantages in a terrain visualization application
with respect to C/S models, than can be avoided using
hybrid P2P schemes.
In this paper, we propose new hybrid P2P models.
Using them, the number of required servers can be
significantly reduced with regard to the classical C/S
model, while still providing the same performance.
2 RELATED WORK
P2P models refers to a network where communica-
tions take place with direct connections between peer
nodes, without using any dedicated server. Most net-
works and applications usually contain some non-
peer elements which can act as clients, servers or
both (Zhu, Gong, Liu, Song and Zhang, 2007). De-
spite that, these networks and applications are usu-
ally called P2P, but it would be called hybrid P2P
(Scholmeier, 2001).
One of the most important problems to be solved
in P2P communication models is which other nodes
must be classified as “neighbors” for each node, in
order to require them the information needed. We can
assume that two users placed in a similar location in
the virtual scene will require a similar terrain infor-
mation. Therefore, the list of neighbors of a given
visualization node could be formed by the nodes that
are closely located to it in the virtual scene. Solipsis
(Frey et al., 2008) or Vorogame (Byukkaya, Adbal-
lah and Cavagna, 2009) are examples of Distributed
Virtual Environments (Singhal and Zyda, 1999) that
use this strategy. Nevertheless, the location of users
in the virtual world is not related at all with the physi-
cal location of their computing nodes. As a result, the
network latency among distant computing nodes may
prevent this strategy to reach the desired efficiency.
Other works also considers additional parameters
in order to obtain the list of neighbor nodes, like trans-
mission data time, data availability or network band-
413
Olanda R., Pérez M. and Manuel Orduña J..
NEW HYBRID P2P COMMUNICATION MODELS FOR REMOTE TERRAIN INTERACTIVE VISUALIZATION SYSTEMS.
DOI: 10.5220/0003812404130418
In Proceedings of the International Conference on Computer Graphics Theory and Applications (GRAPP-2012), pages 413-418
ISBN: 978-989-8565-02-0
Copyright
c
2012 SCITEPRESS (Science and Technology Publications, Lda.)
width (Royan, Gioia, Cavagna and Bouville, 2007).
However, all these works do not deal with large ter-
rain databases, and therefore, they do not focus on the
problems associated with the transmission of this type
of information.
Zheng, Yu, Li and Gau in PeerTR (Zheng, Yu, Li
and Gau, 2007) propose a specific model for real time
terrain visualization. This model use a mixed solu-
tion where clients can obtain information from others
clients or from a server, reducing the system server
workload compared with classic C/S model. A de-
tailed description of this work is done in section 3.1.
3 HYBRID P2P MODELS
Visualization delays in a terrain visualization applica-
tions context are unacceptable, because clients require
a fluid navigation experience over the scene. Hence,
continuous availability of all the terrain information
must be guaranteed. In a pure P2P model it cannot
been guaranteed, since nodes can join or leavethe sys-
tem at any moment. Also, an initial terrain database
distribution among the existing nodes is required in
order to avoid a single point of failure and a possi-
ble bottleneck. However, this distribution is infeasible
because it cannot be predicted when these nodes will
join into the system. In order to solve these problems,
we have defined several new hybrid P2P models.
3.1 Strategy 1: PeerTR-based Model
PeerTR (Zheng, Yu, Li and Gau, 2007) is an hybrid
P2P model proposed for real time terrain visualiza-
tion. A given client node can obtain terrain informa-
tion from the nodes in its list of neighbor clients. In
order to guarantee permanent data accessibility to the
whole terrain database, there is a server which appears
in the list of neighbor clients of all the clients. Each
client connected to the system stores the downloaded
terrain information in its local storage, periodically
reporting to other clients about the availability of the
information stored.
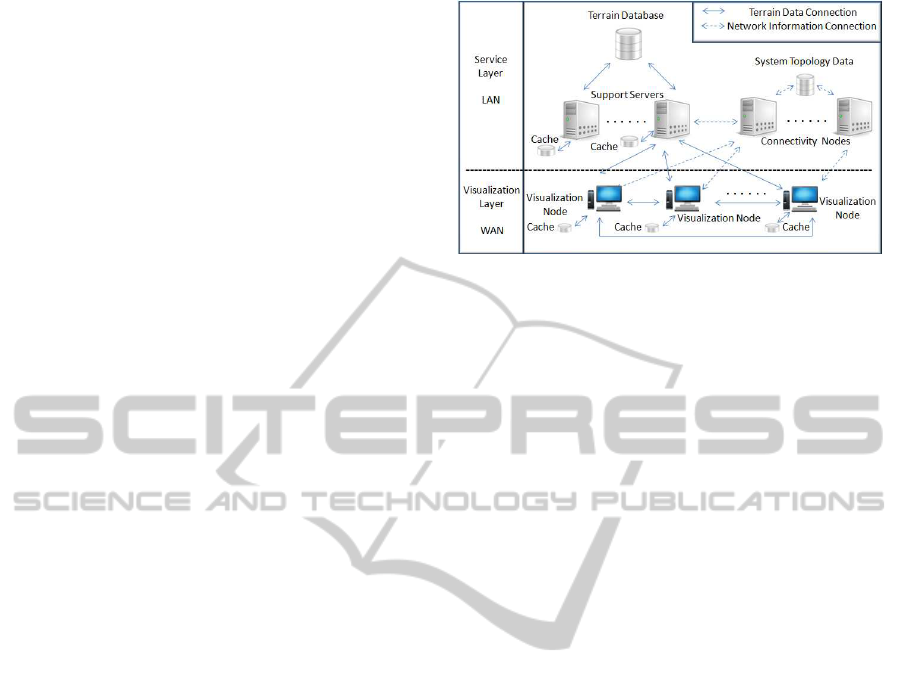
We havedeveloped a new hybrid P2P model based
on the PeerTR model. This model is composed of
two layers (Figure 1): service layer and visualization
layer. The service layer provides to the users a con-
tinuous terrain data access, guaranteeing a lower re-
sponse time compatible with a real time terrain visu-
alization. This layer is composed of memory nodes
(terrain database and support server nodes) and con-
nectivity nodes. The Visualization layer groups the
user computers that perform a terrain visualization.
Figure 1: Connexion scheme of hybrid P2P strategies.
In the original PeerTR system, there is a dedicated
server which stores the complete terrain database,
and it also manages the topology of the system. In
order to avoid a single point of failure and a pos-
sible bottleneck, we have split this server into two
kind of servers: memory nodes, that serve the ter-
rain database, and connectivity nodes, that manage
the system topology.
We also have defined two new types of memory
nodes: terrain database nodes, which stores the whole
terrain database, and support server nodes, which pro-
vides terrain information to the visualization nodes
when they cannot obtain it from their neighbor nodes.
Typically, users are often interested in a reduced por-
tion of the terrain database. For this reason, support
servers could store a reduced region instead the whole
database, acting as “cache” nodes. In order to guaran-
tee the continuous access to whole database informa-
tion, this node will access to the terrain database node
when terrain data are not found in its cache.
The Connectivity Node is a special support server
that is able to manage the topology of the system. It
sends periodically to each visualization node a list of
neighbor visualization nodes and a support server in
order to require them the terrain data.
A Visualization Node refers to a client which per-
forms the interactive visualization of terrain data. The
terrain data to be displayed are downloaded from
other neighbor visualization nodes or from the sup-
port servers, and they are stored in a local disk cache.
Although this node already existed in the original
PeerTR model, it has been modified: first, the list
of neighbor visualization nodes size has been lim-
ited, in order to add the same computing overhead
regardless of the number of neighbor visualization
nodes connected to the system. Second, the cache
size has been limited, so it only stores the most re-
cently downloaded terrain data, reducing the visual-
ization node storage requirements. Third, the visual-
ization node will periodically report which terrain in-
GRAPP 2012 - International Conference on Computer Graphics Theory and Applications
414

formation stores only to the visualization nodes in its
neighbor list, instead to all visualization nodes con-
nected to the system, reducing significantly network
and computing overhead.
3.2 Strategy 2: Neighbor Nodes Query
The process of reporting other nodes about the ter-
rain information stored in a given visualization node
cache may produce a significant overhead. In or-
der to avoid this overhead, we have developed a new
strategy that uses the same scheme of the strategy 1
(Figure 1), but where terrain information reporting
is avoided. In order to obtain the terrain data, a vi-
sualization node sends a message with the required
data to each node of its list of neighbor visualization
nodes. Each neighbor node answers back indicating
which required data are available in its cache. The
report also provides other parameters like the node
workload status or the network transmission latency.
These parameters are used by the visualization node
to estimate the response time of each neighbor node.
According to this information, the visualization node
selects one o more neighbor nodes in order to perform
a concurrent download of the terrain data required. If
none of the neighbor nodes stores the terrain data re-
quired or the estimated response time is too high (it
can be a serious problem for a fluid terrain visualiza-
tion in real time), the visualization node requests the
data terrain to its assigned support server.
The use of this strategy may supposes a signifi-
cant reduction in the number and size of the message
exchanged, reducing the overall processing time.
3.3 Strategy 3: Specialized Server
Cache
In a terrain visualization application, visualization
nodes usually require data about the region that they
are visualizing. In both strategies 1 and 2, a sup-
port server is assigned to each visualization node ex-
clusively using the criterion of the current workload
in the existing support servers. In order to improve
the use of the support servers, we have defined a
new strategy where the assignment of a given sup-
port server to each visualization node also takes into
account the region of the scene displayed by the visu-
alization node, selecting the support server that cur-
rently stores in its cache the greatest amount of terrain
data required by the visualization node and supports
a low workload. This support server selection is dy-
namic, changing over time in order to satisfy both cri-
teria. The scheme of this strategy is the same that the
one used in the strategies 1 and 2 (Figure 1). Obvi-
ously, this strategy makes sense when there are more
than one support server in the system.
4 PERFORMANCE EVALUATION
A remote terrain visualization system using an hybrid
P2P model can consist of a large number of clients,
requiring a lot of human and material resources that
result unaffordable for a single research team. There-
fore, we have implemented and tested an execution-
driven simulator that can measure the performance of
the hybrid P2P models when they are used in a remote
terrain interactive visualization system.
4.1 Simulator Characteristics
We have implemented a centralized, execution driven
simulator of the P2P system written in C++ which
follows a discrete event simulation methodology
(Sadoun, 2000). This simulator supports multiple
peer-to-peer networks structures and different net-
work characteristics like message transmission time,
network contention, transmission errors, network de-
lays or node saturation. In order to validate the simu-
lator, several tests have been carried out varying the
simulator configuration parameters. Some of these
parameters are: number of visualization nodes, num-
ber of support servers, cache size, request process
time, transmission time, transmission error, etc.
4.2 Simulator Validation
In order to validate a simulated model, it should be
compared with another reference model that can be
either real or simulated (Sargent, 2005). Since there
is not a comparable simulator for terrain visualization
systems in the literature, we also have implemented a
real terrain visualization system to validate it. A re-
duced number of visualization nodes has been used
(between 10 and 35), due to the limited resources
available. With this number of nodes it is not nec-
essary a large number of servers, so only one terrain
database server, one connectivity node and between 1
and 3 support servers have been used.
In a terrain visualization application, the move-
ment of the users in the virtual world can be quite
different over time. Some different initial user’s posi-
tion distribution and movement patterns distributions
are usually used to evaluate DVE systems (Morillo,
Rueda, Ordu˜na and Duato, 2007). We are going to
use similar distributions and patterns to evaluate our
new models. Initially, user’s position on the map is
NEW HYBRID P2P COMMUNICATION MODELS FOR REMOTE TERRAIN INTERACTIVE VISUALIZATION
SYSTEMS
415
randomly selected from an uniform distribution. Af-
ter that, users can move following different movement
patterns: randomly around all virtual world (uniform
distribution), towards only one “hot point” or towards
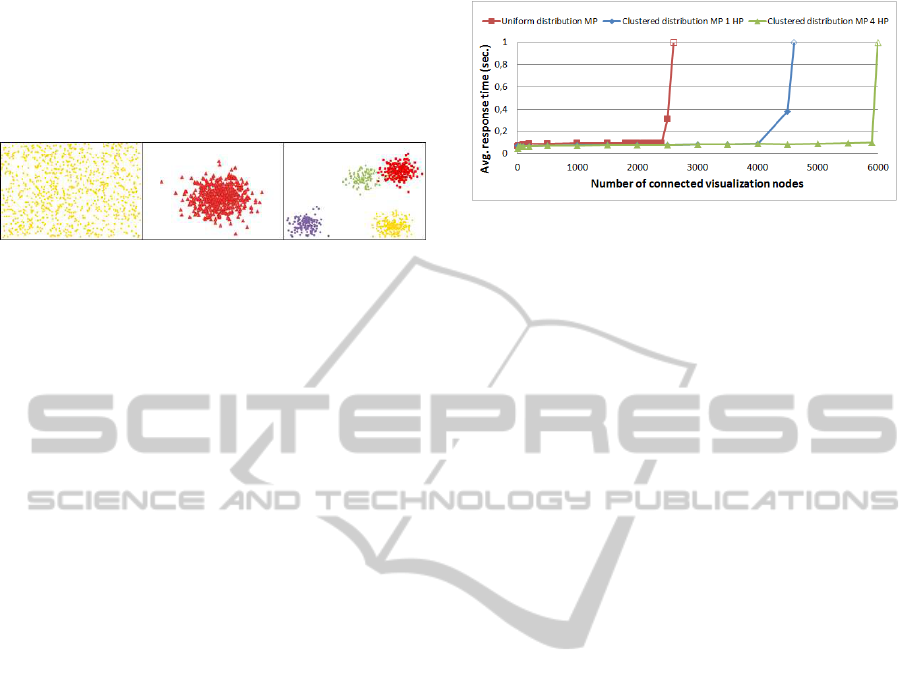
several “hot points” (Figure 2).
Figure 2: Distributions of users obtained using three differ-
ent movement patterns. From left to right: uniform, clus-
tered with one “hot points” and clustered with multiple “hot
points”.
The terrain database used in the tests is the Puget
Sound database (Georgia Tech College of Comput-
ing, 2011). This database is usually used to test ter-
rain visualization applications due to its varied geog-
raphy. Different cache sizes have been tested for sup-
port servers and visualization nodes, according to this
database size. Although we do not show here the re-
sults due to space limitations, comparative examples
can be found in Olanda’s work (Olanda, 2010). All
the results show that the behavior of the real system
is very similar to the behavior of the simulator, with a
maximum relative error lower than 6%. These results
validate the simulator as a reliable tool for measuring
the performance of the proposed hybrid P2P models.
4.3 Evaluation Results
Different test have been performed in order to com-
pare the new hybrid models. We have used the simu-
lator to test these models with a high number of vi-
sualization nodes. In these tests, several simulator
parameters like cache sizes, request process time or
error time, have been fixed by experimental tuning.
In order to select a transmission time, an interval of
possible message latency values has been fixed us-
ing a study of actual broadband quality developed by
Oxford and Oviedo Universities (Oviedo and Oxford
Universities, 2009).
4.3.1 Movement Patterns Effects
We have first studied how the different movement pat-
terns followed by users in the virtual scene may af-
fect the proposed strategies. This study has been per-
formed using two support servers connected. Figure 3
shows the average system response provided to visu-
alization nodes by strategy 3 for different movement
patterns.
Figure 3: Average system responses for different movement
patterns.
Figure 3 shows that, when users follow a uniform
movement pattern, the strategy 3 supports around
2500 visualization nodes. However, it supports up to
4000 nodes when users follow a movement pattern
with one “hot point”, and up to 6000 visualization
nodes when users follow a 4 “hot points” movement
pattern.
These significant variations in the system through-
put are due to the fact that users move within a lim-
ited region when there are one or several “hot points”
specified. As a result, visualization nodes probably
store in their cache the information required from
other neighbor visualization nodes, (because all the
nodes require similar information), and the number
of requests from the visualization nodes to the support
servers decreases. In the case of several “hot-points”,
there are several regions where users tend to crowd
and this produces a better specialization of support
server caches, resulting in a lower response time.
According to this results, we can state that
the movement pattern producing the highest system
workload is the uniform movement pattern. In order
to measure the performance of the proposed strategies
in the worst case, we have used this movement pattern
in all the performance evaluation results shown in the
subsequent sections.
4.3.2 Single Support Server
The hybrid strategies 1 and 2 and the classical C/S
model have been compared in order to evaluate which
one provides a higher throughput (since only one sup-
port server is used, hybrid strategy 3 results are the
same that the strategy 2 ones).
Figure 4 shows the average system response times
for all the requests generated in the simulation as the
number of visualization node increases. As it could be
expected, the plot for the classical C/S model shows
the lowest throughput, reaching saturation when 100
visualization nodes are present in the system. How-
ever, the Strategy 1 supports 600 visualization nodes,
increasing the throughput five times with respect to
GRAPP 2012 - International Conference on Computer Graphics Theory and Applications
416
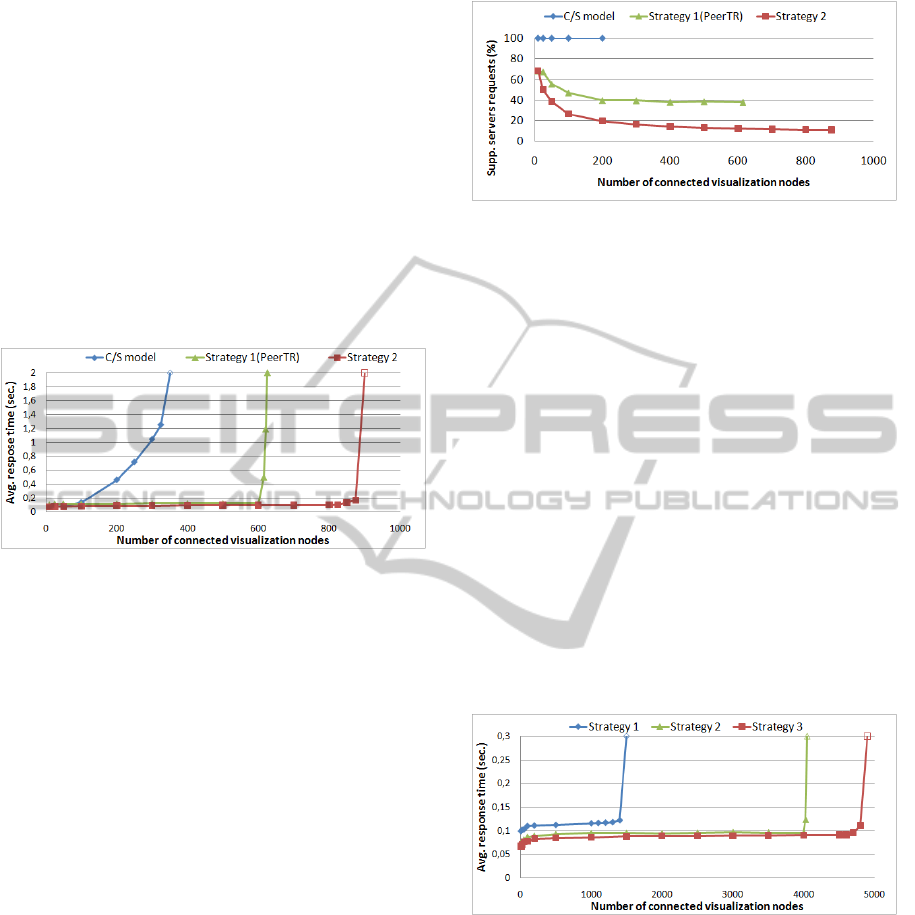
the C/S model. This improvement is due to the inher-
ent scalability of P2P models with respect to central-
ized schemes. That is, in Strategy 1 the nodes can get
the required information from other neighbor nodes,
avoiding the access to the server. The plot for Strat-
egy 2 shows that this strategy outperforms Strategy 1,
supporting around 800 nodes without reaching satu-
ration. This result shows that the strategy of asking
about terrain data to the neighbors when needed, is
better than periodically reporting about what informa-
tion contains each node. One of the reasons for this
behavior is that the reporting message have a size sev-
eral times greater than the size of the messages used
to transmit the terrain data.
Figure 4: Average system response times for one support
server.
Figure 5 shows the percentage of requests served
by support servers as the number of visualization
nodes increases. It is worth mention the significant
decrease of this percentage for both hybrid strategies
for a reduced number of nodes connected to the sys-
tem, and how this percentage slowly decreases for a
high number of nodes. The reason for this behavior
is that as the number of visualization nodes increases,
a given node can obtain the required data from more
neighbors (that explain the quickly initial decrease).
However, there is always a significant percentage of
visualization node requests that cannot be found in
a neighbor node (due to the large size of the terrain
database and the limited size of the visualization node
caches), so the support server has to solve them. The
non-significant reduction of this percentage for a high
number of visualization nodes explains the server sat-
uration of the support server shown in figure 4: the
server workload steadily increases as the number of
visualization node increases.
According to these results, we can state that the
hybrid models provides a higher scalability than the
classical C/S model, and the new strategy 2 provides a
higher throughput (it allows a greater number of con-
nected visualization nodes) than strategy 1.
Figure 5: Average percentage nodes requests served solved
by the support server.
4.3.3 Several Support Servers
In order to evaluate the scalability of the different
strategies, we have measured the system performance
using more than one support server connected to the
system. Discarded the C/S model, the three hybrid
strategies have been compared.
Figure 6 shows a representative case of the per-
formance provided by the proposed strategies. Con-
cretely, it shows the average response time provided
to the visualization nodes by each considered strat-
egy when three support servers are used. This figure
shows that Strategy 2 provides a system throughput
that is 2.5 times greater than strategy 1, supporting
around 4000 visualization nodes without reaching sat-
uration. In turn, strategy 3 provides a throughput 20%
higher than strategy 2.
Figure 6: Average system response times for three support
servers.
Figure 7 shows the average percentage of requests
served by the support servers. This figure also shows
that the percentage of requests served by the support
servers are very similar for strategies 2 and 3. There-
fore, the greater throughput of the strategy 3 with re-
spect to strategy 2 shown in figure 6 is due to the “re-
gion caches” achieved in strategy 3, which provides a
higher number of cache hits (it is not needed to access
the terrain database), reducing the response time for
serving these requests. As a result, there is more avail-
able time for serving more requests. In order to prove
NEW HYBRID P2P COMMUNICATION MODELS FOR REMOTE TERRAIN INTERACTIVE VISUALIZATION
SYSTEMS
417
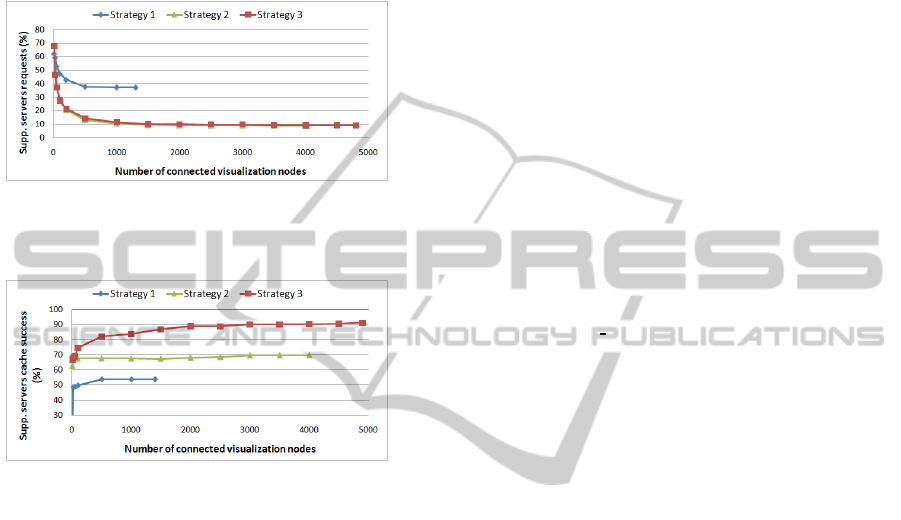
this statement, Figure 8 shows the percentage of vi-
sualization node requests found in the support servers
cache. The plots in this figure shows that strategy 3
achieves around 90% of cache hits from 2000 visual-
ization nodes up, while strategy 2 hardly reaches 70%
of cache hits.
Figure 7: Average percentage of visualization node requests
served support servers (using three support servers).
Figure 8: Average percentage of cache hits in the support
servers (using three support servers).
These results show that the specialization of the
support server cache achieved by the strategy 3 pro-
vides the highest system throughput of all the strate-
gies considered in this work, therefore providing the
highest level of system scalability.
5 CONCLUSIONS
In this paper, we have proposed a comparative study
of new hybrid P2P strategies for terrain visualization
systems that improve the scalability of the classical
C/S model. In order to measure the performance
achieved by each proposed strategy, we have devel-
oped and validated an execution-driven simulator.
The performance evaluation results show that the
best strategy consists of avoiding the periodical re-
porting among peer nodes about the current informa-
tion contained in each node, and also using the sup-
port servers as cache memories specialized by regions
of the virtual world. The system throughput achieved
by this strategy can be more than 3 times higher than
the hybrid P2P strategy proposed in the literature.
ACKNOWLEDGEMENTS
This work has been jointly supported by the Spanish
MICINN and European Commission FEDER funds
under grants Consolider-Ingenio 2010 CSD2006-
00046 and TIN2009-14475-C04-04.
REFERENCES
Buyukkaya, E., Adballah, M., Cavagna, R., 2009.
Vorogame: A Hybrid P2P Architecture for Massively
Multiplayer Games. IEEE Consumer Communica-
tions and Networking Conference.
Frey, D., Royan, J., Piegay, R., Kermarrec, A. M., An-
ceaume, E., Le Fessant, F., 2008. Solipsis: a decen-
tralized architecture for virtual environments. Interna-
tional Workshop on Massively Multiuser Virtual En-
vironments, 29–33.
Georgia Tech College of Computing. Puget
Sound Database, 2011. Retrieved Octo-
ber 4, 2011 from http://www.cc.gatech.edu
/projects/large
models/ps.html.
Morillo, P., Rueda, S., Ordu˜na, J. M., Duato J., 2007. A
latency-aware partitioning method for distributed vir-
tual environment systems. IEEE Transactions on Par-
allel and Distributed systems, 18 (9), 1215–1226.
Olanda, R., 2010. Visualizaci´on interactiva de terrenos ex-
tensos en entornos distribuidos sobre redes mixtas P2P
y cliente-servidor. Phd. Thesis.
Oviedo University, Oxford University, 2009. Global Broad-
band Quality Study Shows Progress, Highlights
Broadband Quality Gap. Retrieved October 4, 2011
from http://www.sbs.ox.ac.uk/newsandevents /Docu-
ments/BQS%202009%20final.pdf.
Royan, J., Gioia, P., Cavagna, R., Bouville, C., 2007.
Network-based visualization of 3D landscapes and
city models. IEEE Computer Graphics and Applica-
tions, 70–79.
Sadoun, B., 2000. Applied system simulation: A review
study. Information Sciences, vol. 124, 173–192.
Sargent, R. G., 2005. Verification and validation of sim-
ulation models. 37th Winter Simulation Conference,
130–143.
Schollmeier, R., 2001. A definition of Peer-to-Peer Net-
working for the classification of Peer-to-Peer architec-
tures and applications. IEEE International Conference
on Peer-to-Peer Computing, 27–29.
Singhal, S., Zyda, M., 1999. Networked Virtual Environ-
ment. ACM Press.
Zheng, S., Yu, Z., Li, Z., Gau, L., 2007. PeerTR: a Peer-to-
Peer terrain roaming architecture. Advanced Parallel
Processing Technologies, LNCS 4847, 292–300.
Zhu, J., Gong, J. H., Liu, W. G., Song, T., Zhang, J. Q.,
2007. A collaborative virtual geographical environ-
ment based on P2P and grid technologies. Information
Sciences, 177 (21), 4621–4633.
GRAPP 2012 - International Conference on Computer Graphics Theory and Applications
418
