
CHANGE VISUALIZATIONS IN BUSINESS PROCESSES
Requirements Analysis
Simone Kriglstein and Stefanie Rinderle-Ma
University of Vienna, Faculty of Computer Science, Vienna, Austria
Keywords:
Change Visualization, Visualization Requirements.
Abstract:
Many business processes are highly dynamic, because process changes result from unplanned events and
exceptions which are unforeseen (e.g., demands of customers have changed, new legislature or design errors
are detected). The management of the large collections of the different process model versions which evolve
over time requires visualization approaches. Visualizations of changes between different process versions are
often essential, because processes in combination with change information can become very complex. In this
paper we discuss visualization requirements for process changes with the focus to support users to understand
changes more easily. The requirements analysis is based on insights which we gained from: (1) literature
review to get an overview about different characteristics of changes in process as well as existing visualization
approaches and (2) a user survey to identify users’ experiences and expectations in this field. With the proposed
requirements we want to support researchers to identify directions for further work in regard to process change
visualization.
1 INTRODUCTION
Managing large collections of business process mod-
els plays an important role for any organization, be-
cause organizations tend to collect hundreds or even
thousands of business process models over time. One
reason for this proliferation of process models is that
they evolve over time in order to, for example, re-
act on changing environmental conditions (Rinderle
et al., 2004). Fast changing business environment re-
quires flexible approaches to support companies to
adjust their business processes in regard to dynamic
structural changes. The need of flexibility of pro-
cesses can be found in many applications. For exam-
ple in health care it is necessary to coordinate and plan
tasks but it is not convenient as well as cost effective
to define all possible task sequences in advance (Re-
ichert and Dadam, 1998). Unplanned events or excep-
tions can occur and therefore flexibility in processes
is necessary to allow ad-hoc deviations from the pre-
planned processes (Reichert and Dadam, 1998).
Especially for critical and sensitive situations
and/or domains (e.g., health care) users are involved
in order to resolve exceptions or to deal with un-
planned events. Therefore it is absolutely essential
that users get a quick overview about their tasks and
to understand the logic behind a process and to comp-
rehend possible effects/consequences if changes of
the process model or process instances are neces-
sary (Rinderle et al., 2006). Based on the best known
saying ”a picture is worth a thousand words”, words
are often not sufficient (e.g., especially to describe re-
lationships of processes or to analyze change log files
only in textual form). Visualizations help users to see
the unseen, because visual representations make pat-
terns transparent and provide a deeper understanding
of subjects (West et al., 2006). Moreover, visualiza-
tions of change information for processes allow users
to generate insights, which can influence their further
decisions (e.g., users can detect conflicts) and help
to make the structure and dependencies between ele-
ments in processes more transparent. Several research
studies have been conducted to analyze how visual-
ization techniques can help users to understand pro-
cesses and there exist several tools that offer process
visualization approaches to support users to model
and monitor business process models and instance
data (Matkovi
´
c et al., 2002; Aguilar-Sav
´
en, 2004;
Bobrik et al., 2006). Business processes often de-
scribe with the help of business process modeling no-
tations (e.g., see (Aguilar-Sav
´
en, 2004; Lu and Sadiq,
2007; Rajabi and Lee, 2010) which describes process
as a graphical representation (e.g., UML, Petri nets,
BPMN) to reflect the process logic.
584
Kriglstein S. and Rinderle-Ma S..
CHANGE VISUALIZATIONS IN BUSINESS PROCESSES - Requirements Analysis.
DOI: 10.5220/0003815505840593
In Proceedings of the International Conference on Computer Graphics Theory and Applications (IVAPP-2012), pages 584-593
ISBN: 978-989-8565-02-0
Copyright
c
2012 SCITEPRESS (Science and Technology Publications, Lda.)

Figure 1: Framework for visualizing change information.
However, process visualizations are often ill-
suited to deal with change information, because they
concentrate more or less on an idealized version of the
preferred process while ignoring graphical support to
highlight changes and human activities at design time
and at run time according to business process life cy-
cle. For an effective usage of such visualizations it is
necessary to find a user-friendly design which allows
users to track the changes in business process mod-
els and instances. For example, a visualization (e.g.,
graphical representation of change log files) can be
helpful to monitor the changes and can support users
in their decision if a redesign of the process model
would be necessary.
Based on the challenge to select an appropriate vi-
sualization, it is useful to know the requirements and
expectations of such change visualizations. In this
paper we want to give researchers a first overview
of different characteristics of changes and visualiza-
tion approaches in combination with a survey to iden-
tify users’ experiences and expectations. The pa-
per should support researchers to identify directions
for further work to bring forward the process change
visualizations. Moreover, we discuss requirements
for process change visualization which can be used
as foundation for designing change visualizations for
process models which meet users’ expectations.
This paper is structured as follows. In Section
2, the basic considerations for the visualization of
changes in processes are presented. The methodology
used in this work is discussed in Section 3. Moreover,
we give an overview about different characteristics of
process changes and visualization approaches in Sec-
tion 4. In Section 5 we discuss the findings of the
survey to identify users’ expectations and experiences
with graphical representation of change visualization.
Based on the gained insights from the literature re-
view and user survey, we identify requirements which
are relevant for the process change visualizations in
Section 6. Finally, the paper is concluded and gives
an outlook on future work in Section 7.
2 BASIC CONSIDERATIONS
Fast changing business environments require visual-
ization approaches to support companies in adjust-
ing their business processes in regard to changes. To
make this change information between different ver-
sions transparent it is necessary to identify first how
the process models have changed as depicted in Fig-
ure 1. The information can range from the identi-
fication of the reason for the process changes (e.g.,
demands of customers have changed or detected de-
sign errors) to the specification how the control and
data flow of processes has changed (e.g., by adding
or deleting process elements). The next step is to
visualize the change information. Different visual-
ization approaches exist (e.g., dynamic representa-
tion of changes can be used for tracking changes be-
tween different versions) to enable users to compre-
hend changes more easily and to generate insights,
which can influence their further decisions (e.g., users
can detect conflicts). Users can influence both steps
(identification of change information and their visu-
alization) depending which kind of information they
want to see and how this kind of change information
should be visualized. The choice of the visualization
approach and which change information should be
visualized often depends on users’ experiences with
other visualization tools and which expectations they
have on such visualizations.
3 METHODOLOGY
For the development of change visualizations it is im-
portant to identify visualization requirements with re-
spect to users’ expectations and experiences on such
CHANGE VISUALIZATIONS IN BUSINESS PROCESSES - Requirements Analysis
585

change visualizations. However, identification of re-
quirements is not an easy task. Therefore we decided
to find answers to the following questions: (1) What
are the characteristics of changes in processes?, (2)
Which visualization approaches do already exist?, (3)
Which experiences do users have with process visu-
alizations? and (4) Which expectations do users have
on the visualization of changes in processes?
To explore the first and second question a litera-
ture review is used to get an overview about the differ-
ent characteristics of changes in processes and visual-
ization approaches. Literature review is often used
in the early beginning of the development process to
get relevant basic background information (e.g., by
searching traditional literature databases). Often liter-
ature review is combined with user surveys to contact
specific experts in this field to obtain additional in-
sights. Therefore, the third and fourth question are
answered by the findings of a user survey to iden-
tify users’ expectations and experiences with graphi-
cal representations of processes and changes. For this
reason, we used online questionnaires to obtain qual-
itative and quantitative data.
4 LITERATURE REVIEW
The literature review should give researches a first
overview about different visualization approaches and
different characteristics of changes. For the litera-
ture review databases – like IEEE Computer Society,
ACM Digital Library, Sciencedirect, and Springer-
Link – were searched.
4.1 Characteristics of Changes
Changes in business processes (which are usually
changes in data sets) result from (1) incomplete spec-
ifications because events cannot always be predefined
and (2) modifications which are based on new or
changed conditions (van der Aalst and Jablonski,
2000; Rajabi and Lee, 2010). Several works (e.g.,
see (van der Aalst and Jablonski, 2000; Kettinger
et al., 1997; Rajabi and Lee, 2010; Nurcan and Bar-
rios, 2003; Reichert and Dadam, 1998; van der Aalst,
2001)) exist which concentrate on the specification
and criteria of process changes:
• Reasons for Changes. Different factors exist
which influence process changes, e.g.: (1) if the
context or the environment is changed (e.g., new
products or demands of customers have changed),
or (2) if a new legislature or new technology ex-
ists, or (3) if design errors or missing data sets are
detected (van der Aalst and Jablonski, 2000; Nur-
can, 2008; W
¨
orzberger et al., 2008; Nurcan and
Barrios, 2003).
• Ad-hoc vs. Evolutionary. Literature distin-
guishes between ad-hoc changes and evolution-
ary changes (Schonenberg et al., 2008; Reichert
and Dadam, 1998; Nurcan, 2008; van der Aalst,
2001; van der Aalst and Jablonski, 2000; Rajabi
and Lee, 2010). Ad-hoc changes are only relevant
for one or more selected process instances if the
process definition is unsatisfying for the process
execution or to handle rare events. Such changes
have to be undone before any further instances is
allowed to start. Evolutionary changes are modi-
fications of the process model that are relevant for
all instances (e.g., to correct a design error) and
therefore migrating strategies are necessary for al-
ready running process instances.
• Entry Time vs. On-the-Fly. There exist two pos-
sible moments to integrate process changes: (1)
entry time means that changes can be performed
only before or at the moment the process instance
is created and (2) on-the-fly means that changes
can be performed at any time (Schonenberg et al.,
2008; van der Aalst, 2001; Reichert and Dadam,
1998). This can have an impact on running as well
as new process instances. It must be generated
that such changes do not have a negative impact
on run time performance and do not disturb pro-
cess participants who are not involved.
• Change Patterns. Both for ad-hoc and evolu-
tionary changes, change patterns exist that spec-
ify how control and data flow of processes can
be changed (Reichert and Dadam, 1998; van der
Aalst, 2001; Weber et al., 2008; W
¨
orzberger et al.,
2008).
4.2 Visualization Approaches
Business processes are usually visualized as directed
graphs to make the flow of resources, tasks and time
visible. In general, different graph layout algorithms
exist (e.g., see (Eades et al., 1993; Sugiyama, 2002;
Hong et al., 1998; de Fraysseix et al., 1988)) as well
as layout approaches tailored for business process
graphs (e.g., see (Effinger et al., 2009; Albrecht et al.,
2010; Diguglielmo et al., 2002; Zhao et al., 2009; Six
and Tollis, 2002)).
Orthogonally, several approaches suggest to visu-
alize business processes in 3D such as (Sch
¨
onhage
et al., 2000; Brown and Recker, 2011; Betz et al.,
2008; Brown, 2010; Eichhorn et al., 2009). The ques-
tion to visualize processes in 2D or 3D is intensely
IVAPP 2012 - International Conference on Information Visualization Theory and Applications
586

discussed in the research community. One point of
view is that the third dimension is a possibility to en-
code further information and enables interaction with
larger business process models (Brown and Recker,
2011). For example, (Betz et al., 2008) state that a
2D representation of business processes is limited in
regard to the amount of information which can be in-
tegrated in an understandable way. Furthermore, the
authors mention that 2D representations of process in-
formation interfere each other. Another point of view
is that the third dimension has the effect to make the
visualization and interaction more difficult (e.g., cer-
tain information might be hidden). For users who are
not familiar it is more difficult to interpret the data
with a 3D visualization. A well-organized 2D rep-
resentation is more easily accessible and accepted by
business people (Sch
¨
onhage et al., 2000).
Another challenge addressed in literature is the
visualization of complex business processes due the
multitude of different information such as control
flows, data flows, or resources contained within one
process model. Generally, it is hard to visualize all
the information effectively without introducing new
problems (e.g., cluttered or overcrowded view). Some
approaches (e.g., see (Bobrik et al., 2007; Bobrik
et al., 2006; Bobrik and Bauer, 2007; Matkovi
´
c et al.,
2002; Jablonski and Goetz, 2008; Polyvyanyy et al.,
2008)) propose to visualize different perspectives on
business processes for breaking down the complex-
ity of business processes and to improve the com-
prehensibility of the process structure. For example,
(Jablonski and Goetz, 2008) present a business pro-
cess visualization approach which enables to be flex-
ible with respect to the different perspectives of busi-
ness processes. (Polyvyanyy et al., 2008) introduce
an approach - named Abstraction Slider - which en-
ables users to control the abstraction levels of process
models. A further approach is described by Provi-
ado (Bobrik et al., 2007; Bobrik et al., 2006; Bobrik
and Bauer, 2007) which enables different views on the
process and related data with an adapted visualization
and a customized granularity of information that re-
flects interests and needs of different user roles.
Animation is a typical way to visualize how busi-
ness processes are executed (Rinderle et al., 2006)
and is used in tools such as ARIS or IBM WBI Mod-
eler. Furthermore, several research studies point out
that the usage of animations can help users to trace
changes and to understand the process flow more eas-
ily (e.g., see (Burkhart and Fusco, 1996; Eichhorn
et al., 2009)). However, there is also criticism on us-
ing animation. (Beck et al., 2009), for example, point
out that the cognitive load is the major problem for an-
imations, because humans can only see a single image
and therefore it is not possible to follow all changes
in the visualization. Visually keeping track of busi-
ness process changes has been addressed only by few
approaches such as (Kabicher et al., 2011). The ques-
tion, if a static or dynamic graphical representation is
more suitable to visualize changes in data sets can not
be answered at this point, because it depends on the
type of dynamic data and on the decision which tasks
should be performed.
5 SURVEY
The primary goal of conducting a survey was to gain
more information about users’ experiences and expec-
tations.
5.1 Sample
The invitation of the online survey for participation
was sent via mailing lists to persons who had at least
basic knowledge with business process models and/or
process visualization. Fifteen persons responded to
the questionnaire. The participation was voluntary
and anonymous.
5.2 Survey Design
The design of the survey is inspired by questionnaire
guidelines, such as (Lumsden, 2005; Stone et al.,
2005; Wilson, 2007). The participants can control the
survey and have the possibility to skip questions if
s/he does not want to answer it. Additionally to an
introduction and a description about the purpose of
the questionnaire, the questions are classified into the
following categories:
• Background Questions. This category includes in-
troductory questions to identify more about the
users’ background. This information should help
us to classify users’ characteristics to get a gen-
eral picture about particular user groups. For ex-
ample the category contains questions how they
would rate their knowledge of business processes
or with which of the visualization techniques they
are familiar.
• Experience Questions. This category includes
questions to analyze users’ experiences in regard
to process visualization and change visualization.
Furthermore, the category contains questions to
find out the experiences with visualization tools
and what they like or dislike about these tools.
The answers will give us the possibility to find out
what works well and what works not so well.
CHANGE VISUALIZATIONS IN BUSINESS PROCESSES - Requirements Analysis
587

• Expectations Questions. The last category con-
tains questions about expectations in regard to
change representations.
5.3 Results
The results are based on quantitative and qualitative
analysis. For the responses from the open-end and
combined questions, we applied the qualitative con-
tent analysis to evaluate participants’ answers. The
findings of the survey are classified into the three
questionnaire categories listed in the previous subsec-
tion.
5.3.1 Background Questions
The findings of the survey are based on the answers
of seven experts, five semi-experts and three non-
experts. In our case experts are persons who have
a high knowledge about business processes and are
occupied with them very often and intensive. Semi-
experts describe persons who have basic knowledge
about business processes and use them only some-
times. Non-experts are persons with low knowledge
about business processes and use them rarely.
The participants stated that they would describe
their role in regard to business process management
as researcher (6 statements), analyst (3 statements),
designer (2 statements), business leader/manager (2
statements) and two persons did not define their role.
We also wanted to know how familiar they were
with different visualization approaches (e.g., graphs,
different diagram types, 3D representation, and ani-
mation). The responses showed that most participants
stated that they were very familiar with node-link rep-
resentations (see Figure 2). The responses to the ques-
tion which of the visualization techniques they pre-
ferred showed very well that graphs (rated by 20% of
the particpants) and diagramm types (especially bar
charts with 16%, pie charts with 14% and Gantt charts
with 9%) were the clear favourites. A possible rea-
son for this result could be that most of the business
process tools use usually node-link representations in
combination with different digram types and therefore
other visualization techniques (e.g., icon techniques)
are not so popular to the user.
5.3.2 Experience Questions
86.67% of the participants stated that they used
tools to visualize processes and the responses showed
a wide range of tools. Following tools were
named (in alphabetical order): Adobe Illustrator,
AdoBEN, ADONIS, ADOit, ADOlog, ADOscore,
AdoXX, ARIS Express, AristaFlow, BonitaSoft, Dia,
eduWeaver, @enterprise Reporting Component, Free-
Mind, IBM WebSphere ILOG JRules, IBM Web-
Sphere MQ Workflow, Intalio, Microsoft Excel, Mi-
crosoft PowerPoint, Microsoft Project, Microsoft Vi-
sio, MindMap, OpenOffice Draw, Oryx, SeMFIS, Po-
seidon for UML, VisualParadigm, Yaoqiang BPMN
Editor, and YAWL. The most named tools were Mi-
crosoft Visio (8 nominations), Microsoft Excel (5
nominations), Microsoft PowerPoint (4 nominations)
and ARIS Express as well as ADONIS (3 nomina-
tions each). Most of the named tools used node-link
representations and/or different digram types such as
bar charts, Gantt charts, or pie charts. Furthermore,
the result showed that also draw tools were named
(e.g., Adobe Illustrator, Microsoft Visio, OpenOffice
Draw, and Dia) which usually are not suitable to visu-
alize large processes.
Although the relevance to visualize change infor-
mation was noted by the practitioners, e.g., for shared
processes or when a process model is changed while
other instances are still alive, only 40% of the par-
ticipants stated that they already had experiences with
tools which visualized change information about pro-
cesses. The following tools were named: ADONIS
as well as Aristaflow (2 nominations each) and SeM-
FIS, IBM Blueworks as well as @enterprise Report-
ing Component (1 nomination each). According to
the question how the changes were visualized, two ap-
proaches were listed: (1) the usage of color to make
changes transparent in graphs and (2) the usage of ta-
bles/textual form to list process changes (4 statements
each). They stated that the change visualization was
a good possibility to analyze and to compare possible
scenarios depending of the performed modifications.
However, only half of the 40% of the participants
(who already had experience with change visualiza-
tion) stated that they had the feeling that the visualiza-
tion gave them a good support to track the changes.
They criticized that changes can not be tracked be-
tween the different versions or shared processes.
Although 53.33% of the participants stated that
they used version visualizations, most of them (75%
from the 53.33% of the participants) listed only tools
to maintain current and historical versions of files
such as source codes, web pages, and documenta-
tions. The most named tools were: Microsoft Word,
SmartGit and Apache Subversion (3 nominations).
Only ADONIS, ADOit, ADOlog as well as Process-
Wiki (1 nomination each) were stated for tools which
would support version representation for processes.
The possibility to track changes and the accept/reject
options in Microsoft Word were stated as most named
advantage to use such version visualizations (3 nomi-
nations). Furthermore they liked if changes were col-
IVAPP 2012 - International Conference on Information Visualization Theory and Applications
588
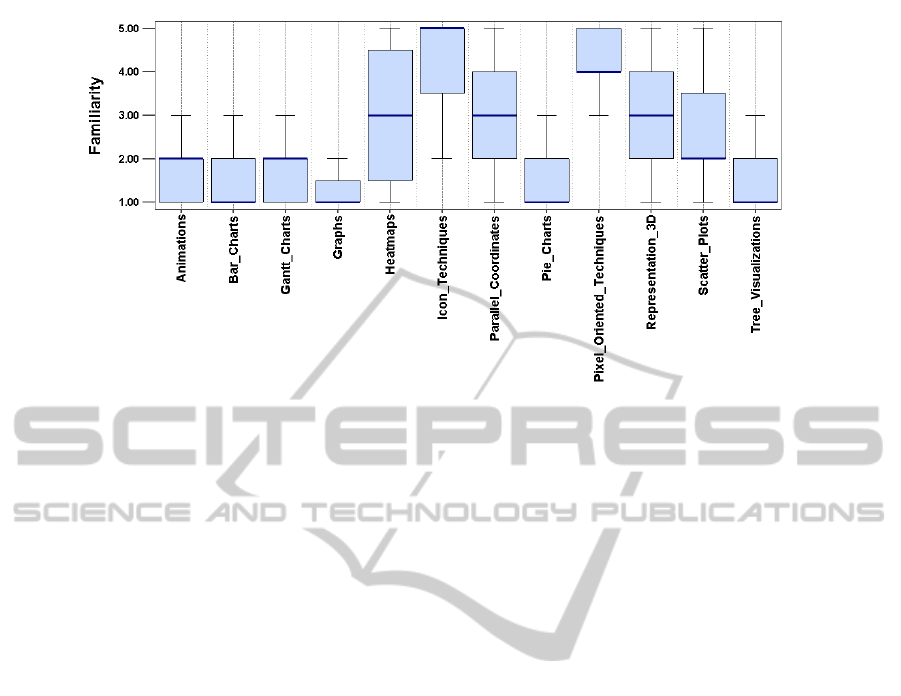
Figure 2: Familiarity of the participants with different visualization techniques (from Excellent (1) to Not Familiar (5)).
ored in version visualizations to make the changes
faster visible. However, they noted if more changes
should be visualized, the version visualizations may
overcrowd soon. In this case it would be not clear
where the changes occured and the graphical repre-
sentation could be confusing for long-running pro-
cesses with many changes (beause of a long history).
5.3.3 Expectations Questions
The participants were asked what they generally ex-
pect from a change visualization and the responses
can be divided into the following categories:
• Clear Representation (11 Statements): Partici-
pants expected that the visualization should give
them a fast, simple and clear overview about the
changes in process models as well as instances
and the changes between the different process ver-
sions. Furthermore, it was noted that it should be
avoided that the representation is overloaded with
too much information. For example, it was stated
that the visualization should provide a show/hide
function to enable which information should be
visible or slide shows of a series of pictures on the
same subject along the time line can be used to
slide the time back or forth.
• Change Information (4 Statements): Participants
stated it would be helpful to have the possibility
to not only see the different kinds of changes but
also to see additional change information such as
a short description why the business process was
changed or the name from the person who made
the change.
• Effects of Changes (3 statements): Participants ex-
pected that the graphical visualization of changes
should make effects in processes visible to see
how the changes affect the whole process and to
detect possible problems or conflicts.
• Version Visualization (2 Statements): Two partic-
ipants noted that they would also expect that a
change visualization should support them to com-
pare changes between different process versions.
6 REQUIREMENTS
The literature review shows us that there exist sev-
eral visualization approaches to make changes in data
transparent, but the responses of the survey indicate
that process changes are often only highlighted (e.g.,
via color) in the process graph or they are listed in tex-
tual form in practice. Moreover, the survey shows us
that change information (e.g., which person changed
what elements in the processes) is often missed. Of-
ten tools are used which are only suitable to visualize
small parts of the process and not to comprehend the
whole processes or to see the relationships between
different versions.
Based on these observations, we discuss in this
section different change visualization requirements
and give possible directions for further work.
6.1 Clear Change Representation
All changes in processes should be recorded and the
visualization should support users to get a fast and
clear view about the changes between the different
process versions. One big challenge is to visualize
changes prominently enough to draw users’ attentions
to them and that they understand the logic behind a
CHANGE VISUALIZATIONS IN BUSINESS PROCESSES - Requirements Analysis
589

process to comprehend possible effects/consequences
in the case of changes (Rinderle et al., 2006; Chen,
2005). For an effective usage of such visualizations
it is necessary to find a user-friendly design which al-
lows users to track the changes between the different
versions of the models without being overwhelmed
with change information.
Usually, file comparison tools apply change marks
to make the changes between different versions visi-
ble. This approach can be adopted to make changes in
processes transparent. For example, visual properties
(e.g., color, size, shape, and texture) and icons can be
used to highlight process changes between different
versions. It is important that the change marks sup-
port users to see the change information quickly and
therefore visual properties should not be used as dec-
orative elements or as unnecessary graphical effects.
Not all visual properties work well for each kind of
process visualization and therefore the choice how the
changes should be visualized depends strongly on dif-
ferent aspects. For example, the usage of shapes and
textures is restricted because shapes or textures often
strongly depend on the used business process model-
ing notations. Although colors can be used to make
change information clearly visible, it is necessary to
consider that it is often insufficient to code the in-
formation with colors only, because, e.g., users can
be color blind (Stone et al., 2005). Moreover, tradi-
tional or existing icons should be used and the repre-
sentation of the icons should be clear such that users
can see for which function or action the icon stands
for (Galitz, 2002).
6.2 Visibility of Relationships between
Versions
All process versions should be taken into considera-
tion not only the latest version of the process and there
should be an easy way for users to see the dependen-
cies between the different process versions. The rep-
resentation of interconnections between the process
versions makes it more comprehensible for the users
and allows to make comparisons between them.
A version graph (or version tree) is a well-known
approach to make relationships between versions
transparent (e.g., see (Diehl, 2007; Freire et al.,
2006; Ther
´
on et al., 2007; Gulla, 1992; Kejser and
Grønbæk, 2004)). The graphical view of the version
history as graph can be used to get a general view of
the different process versions and can make branched
and merged information visible.
In addition to specific version information (e.g.,
comments, time stamps, and names of the persons
who changed the processes), the version graph should
also enable users to compare how the processes have
changed between different versions. For example,
Figure 3 shows a concept how the version graph for
processes can be combined with the process graph to
make change information visible. The version graph
presents the versions of the process as nodes and the
relationships between the versions as edges. Delta
∆ describes the differences between subsequent ver-
sions. In the case a node is selected in the version
graph the corresponding process graph is presented
(see (a) and (c) in Figure 3). If two nodes are selected
in the version graph then the corresponding processes
are merged and the changes are highlighted (see (b)
in Figure 3).
6.3 Different Views
Only highlighting of changes is often not sufficient
for users to comprehend the changed processes or to
identify further consequences. However, designing a
visual representation, which combines different infor-
mation in a single view, is limited. Displaying in-
formation about changes in multiple views simplifies
the design. The different views should be linked to-
gether to support users’ understanding of the infor-
mation (e.g., selected objects in one view should also
be highlighted in corresponding views) (Green et al.,
2008; North, 2001; Roberts, 1998).
Multiple levels of abstraction are needed to ana-
lyze changes from different angles. For example, one
view can present additional change information (e.g.,
revision date, author of revision, number of changed
elements, short description about the reason for the
changes). It can be helpful for users to see each oth-
ers work (e.g., who is working on which part, and who
made what changes) so that they know whom to ask if
there is any understanding problem. Or another view
can support users to analyze effects in processes and
to see if the changed element is in conflict with other
elements or the planned change is not valid. Moreover
multiple views can be helpful to coordinate the above-
mentioned combination of the version graph with the
process graph with the corresponding change infor-
mation (see Figure 3).
6.4 Interaction
Although the presented visualization approaches in
Section 4.2 support different levels of interactivity,
the results of the literature review show that the
description of the different approaches concentrate
primarily on the visual representation and less on
the used interaction strategies. However interaction
strategies play an important role for analyzing change
IVAPP 2012 - International Conference on Information Visualization Theory and Applications
590

Figure 3: Combination of version graph with change information in the process graph: (a) process version is selected, (b) the
two selected processes are merged and colors are used to visualize the change information between the both processes (color
green for new elements and color red for deleted elements) and (c) subsequent version is selected.
information between different process versions. Be-
cause of the limited screen space it is only possible
to represent a small portion of information in more
detail and a visual representation alone is often not
sufficient in many cases.
Especially, the visualization of change informa-
tion should be organized in a meaningful and useful
way for easy navigation and switching between the
different views. There exist several interaction strate-
gies (e.g., brushing and linking, zooming and pan-
ning, or scrolling) which can be used for analyzing
process changes. Moreover, it is necessary that users
can manipulate the visualization to decide which in-
formation should be visualized. It is important to find
manipulation strategies, e.g., if more than two pro-
cess versions should be analyzed or for long-running
processes with many changes. The responses of our
user survey show us that the strategy from Microsoft
Word to track and manipulate changes with the help
of accept and reject options is a good possibility to
manipulate changes in documentations. This strategy
can also be applied to manipulate the change infor-
mation between different process versions. Further-
more, the visualization should provide filter functions
to enable users to decide how long change informa-
tion should be visualized in the processes. For exam-
ple, users should be able to decide if it is sufficient
to visualize only the change information between the
two selected process versions or if it is necessary to
visualize also change information from the previous
versions.
7 CONCLUSIONS
The motivation of this paper was to support researcher
to identify directions for further work to bring forward
process change visualizations. In this paper, visual-
ization requirements were presented with the focus
on supporting users in comparing changes between
different process versions. However, before we dis-
cussed visualization requirements, we conducted a lit-
erature review to get an overview about the different
characteristics of changes in processes and about al-
ready existing visualization approaches. Furthermore,
we combined the literature review with a user sur-
vey to obtain additional insights about users’ experi-
ences and expectations in this field. The responses
showed that the used visualization tools only high-
light changes in processes but they do not allow to
track changes between the different versions. In ad-
dition to clear change representation, users expected
that visualization should also make the effects of
changes in processes (e.g., to detect conflicts) and ad-
ditional change information (e.g., author of revision)
visible.
The identified requirements will enable possible
directions for further research. We will concentrate
to find out which forms of presentation are best suited
for analyzing change information in processes and de-
sign solutions to make changes in processes suitable
regarding users’ needs. For example, we will investi-
gate the graphical representation of version graphs to
support the management of large process collections.
Further, we intend to refine change visualizations in
regard to further aspects such as actors (e.g., person
who made the changes) and time (e.g., temporal rela-
tions). Additionally, extensive evaluations of our so-
lutions are planned.
CHANGE VISUALIZATIONS IN BUSINESS PROCESSES - Requirements Analysis
591

REFERENCES
Aguilar-Sav
´
en, R. S. (2004). Business process modelling:
Review and framework. International Journal of Pro-
duction Economics, 90(2):129–149.
Albrecht, B., Effinger, P., Held, M., and Kaufmann, M.
(2010). An automatic layout algorithm for bpel pro-
cesses. In Proc. of the 5th International Symposium
on Software Visualization, pages 173–182. ACM.
Beck, F., Burch, M., and Diehl, S. (2009). Towards an aes-
thetic dimensions framework for dynamic graph vi-
sualisations. In Proc. of the 13th International Con-
ference Information Visualisation, pages 592–597,
Washington, DC, USA. IEEE Computer Society.
Betz, S., Eichhorn, D., Hickl, S., Klink, S., Koschmider,
A., Li, Y., Oberweis, A., and Trunko, R. (2008). 3d
representation of business process models. In Loos,
P., Nttgens, M., Turowski, K., and Werth, D., editors,
MobIS, LNI, pages 73–87. GI.
Bobrik, R. and Bauer, T. (2007). Towards configurable pro-
cess visualizations with proviado. In Proc. of the 16th
IEEE International Workshops on Enabling Technolo-
gies: Infrastructures for Collaborative Enterprises
(WETICE 2007, pages 367–369.
Bobrik, R., Bauer, T., and Reichert, M. (2006). Proviado -
personalized and configurable visualizations of busi-
ness processes. In Proc. of the 7th International Con-
ference on Electronic Commerce and Web Technolo-
gies (EC-WEB’06), Lecture Notes in Computer Sci-
ence, pages 61–71. Springer.
Bobrik, R., Reichert, M., and Bauer, T. (2007). View-based
process visualization. In Proc. of the 5th International
Conference on Business Process Management, pages
88–95. Springer.
Brown, R. A. (2010). Conceptual modelling in 3d virtual
worlds for process communication. In Proc. of the
7th Asia-Pacific Conference on Conceptual Modelling
- Volume 110, APCCM ’10, pages 25–32.
Brown, R. A. and Recker, J. C. (2011). Using virtual worlds
for collaborative business process modeling. Business
Process Management Journal, 17:In Press.
Burkhart, B. J. and Fusco, M. E. (1996). Using animation
to aid process flow visualization. In Proc. of the Con-
ference Companion on Human Factors in Computing
Systems: Common Ground (CHI’96), pages 21–22.
ACM.
Chen, C. (2005). Top 10 unsolved information visualization
problems. IEEE Comput. Graph. Appl., 25:12–16.
de Fraysseix, H., Pach, J., and Pollack, R. (1988). Small
sets supporting fary embeddings of planar graphs. In
Proc. of the 20th annual ACM Symposium on Theory
of Computing, pages 426–433. ACM.
Diehl, S. (2007). Visualizing the evolution of software
systems. In Software Visualization, pages 129–147.
Springer.
Diguglielmo, G., Durocher, E., Kaplan, P., Sander, G., and
Vasiliu, A. (2002). Graph layout for workflow appli-
cations with ilog jviews. In Proc. of the 10th Interna-
tional Symposium on Graph Drawing, pages 362–363.
Springer.
Eades, P., Lin, T., and Lin, X. (1993). Two tree drawing con-
ventions. Int. J. Comput. Geometry Appl., 3(2):133–
153.
Effinger, P., Siebenhaller, M., and Kaufmann, M. (2009).
An interactive layout tool for bpmn. In Proc. of IEEE
International Conference on Commerce and Enter-
prise Computing, pages 399–406, Los Alamitos, CA,
USA. IEEE Computer Society.
Eichhorn, D., Koschmider, A., Li, Y., Sturzel, P., Ober-
weis, A., and Trunko, R. (2009). 3d support for busi-
ness process simulation. In Proc. of the 33rd Annual
IEEE International Computer Software and Applica-
tions Conference, volume 1, pages 73–80. IEEE Com-
puter Society.
Freire, J., Silva, C., Callahan, S., Santos, E., Scheidegger,
C., and Vo, H. (2006). Managing rapidly-evolving
scientific workflows. In Moreau, L. and Foster, I.,
editors, Provenance and Annotation of Data, volume
4145 of Lecture Notes in Computer Science, pages
10–18. Springer.
Galitz, W. O. (2002). The Essential Guide to User Interface
Design: Introduction to GUI Design Principles and
Techniques. Wiley & Sons.
Green, T. M., Ribarsky, W., and Fisher, B. (2008). Visual
analytics for complex concepts using a human cogni-
tion model. In Proc. of the IEEE Symposium on Visual
Analytics Science and Technology (VAST 2008), pages
91–98. IEEE Computer Society.
Gulla, B. (1992). Improved maintenance support by multi-
version visualizations. In Proc. of the 8th Interna-
tional Conference on Software Maintenance (ICSM
1992), pages 376–383. IEEE Computer Society.
Hong, S.-H., Eades, P., Quigley, A., and Lee, S. H. (1998).
Drawing algorithms for series-parallel digraphs in two
and three dimensions. In Proc. of the 6th Interna-
tional Symposium on Graph Drawing, pages 198–209.
Springer.
Jablonski, S. and Goetz, M. (2008). Perspective oriented
business process visualization. In ter Hofstede, A.,
Benatallah, B., and Paik, H.-Y., editors, Business Pro-
cess Management Workshops, volume 4928 of Lecture
Notes in Computer Science, pages 144–155. Springer.
Kabicher, S., Kriglstein, S., and Rinderle-Ma, S. (2011).
Visual change tracking for business process models.
In Proc. of the 30th International Conference on Con-
ceptual Modeling (ER 2011). Springer.
Kejser, T. and Grønbæk, K. (2004). The gaia frame-
work: Version support in web based open hyperme-
dia. IADIS International Journal of WWW/Internet,
2:17–33.
Kettinger, W. J., Teng, J. T. C., and Guha, S. (1997). Busi-
ness process change: A study of methodologies, tech-
niques, and tools. MIS Quarterly, 21(1):55–80.
Lu, R. and Sadiq, S. (2007). A survey of comparative busi-
ness process modeling approaches. In Proc. of the
10th International Conference on Business Informa-
tion Systems, pages 82–94. Springer.
Lumsden, J. (2005). Guidelines for the design of online-
questionnaires. Technical Report NRC 48231, Na-
tional Research Council (of Canada).
IVAPP 2012 - International Conference on Information Visualization Theory and Applications
592

Matkovi
´
c, K., Hauser, H., Sainitzer, R., and Gr
¨
oller, M. E.
(2002). Process visualization with levels of detail. In
Proc. of the IEEE Symposium on Information Visu-
alization (InfoVis’02), pages 67–70. IEEE Computer
Society.
North, C. (2001). Multiple views and tight coupling in visu-
alization: A language, taxonomy, and system. In Proc.
of the International Conference on Imaging Science,
Systems, and Technology Workshop of Fundamental
Issues in Visualization, pages 626–632. CSREA Press.
Nurcan, S. (2008). A survey on the flexibility require-
ments related to business processes and modeling arti-
facts. In Proc. of the 41st Annual Hawaii International
Conference on System Sciences, pages 378–387. IEEE
Computer Society.
Nurcan, S. and Barrios, J. (2003). Enterprise knowledge and
information system modelling in an evolving environ-
ment. In Proc. of the First International Workshop on
Engineering Methods to Support Information Systems
Evolution in Conjunction with OOIS’03, pages 1–14.
Polyvyanyy, A., Smirnov, S., and Weske, M. (2008). Pro-
cess model abstraction: A slider approach. In Proc.of
the 12th International IEEE Enterprise Distributed
Object Computing Conference, pages 325–331. IEEE
Computer Society.
Rajabi, B. A. and Lee, S. P. (2010). Modeling and analysis
of change management in dynamic business process.
International Journal of Computer and Electrical En-
gineering, 2(1):181–189.
Reichert, M. and Dadam, P. (1998). Adeptflex – sup-
porting dynamic changes of workflows without losing
control. Journal of Intelligent Information Systems,
10:93–129.
Rinderle, S., Bobrik, R., Reichert, M., and Bauer, T. (2006).
Business process visualization - use cases, challenges,
solutions. In Proc. of the 8th International Conference
on Enterprise Information Systems, pages 204–211.
Rinderle, S., Reichert, M., and Dadam, P. (2004). Correct-
ness criteria for dynamic changes in workflow sys-
tems – a survey. Data and Knowledge Engineering,
50(1):9–34.
Roberts, J. C. (1998). On encouraging multiple views for
visualisation. In Proc. of the International Confer-
ence on Information Visualisation, pages 8–14. IEEE
Computer Society.
Schonenberg, H., Mans, R., Russell, N., Mulyar, N., and
van der Aalst, W. (2008). Process flexibility: A sur-
vey of contemporary approaches. In Proc. of the 4th
International Workshop CIAO! and 4th International
Workshop EOMAS, Lecture Notes in Business Infor-
mation Processing, pages 16–30. Springer.
Sch
¨
onhage, B., van Ballegooij, A., and Elli
¨
ens, A. (2000).
3d gadgets for business process visualization - a case
study. In Proc. of the 5th Symposium on Virtual Real-
ity Modeling Language (Web3D-VRML), pages 131–
138. ACM.
Six, J. M. and Tollis, I. G. (2002). Automated visualization
of process diagrams. In Revised Papers from the 9th
International Symposium on Graph Drawing, pages
45–59. Springer.
Stone, D., Jarrett, C., Woodroffe, M., and Minocha, S.
(2005). User Interface Design and Evaluation. Mor-
gan Kaufmann.
Sugiyama, K. (2002). Graph drawing and applications
for software and knowledge engineers. Series on
software engineering and knowledge engineering,11.
World Scientific Publishing Company.
Ther
´
on, R., Gonz
´
alez, A., Garc
´
ıa, F., and Santos, P. (2007).
The use of information visualization to support soft-
ware configuration management. In Baranauskas,
C., Palanque, P., Abascal, J., and Barbosa, S., edi-
tors, Human-Computer Interaction INTERACT 2007,
volume 4663 of Lecture Notes in Computer Science,
pages 317–331. Springer.
van der Aalst, W. (2001). How to handle dynamic change
and capture management information? an approach
based on generic workflow models. International
Journal of Computer Systems, Science and Engineer-
ing, 16(5):295–318.
van der Aalst, W. and Jablonski, S. (2000). Dealing with
workflow change: Identification of issues an solu-
tions. Int’l Journal of Comp. Systems, Science and
Engineering, 15(5):267–276.
Weber, B., Reichert, M., and Rinderle-Ma, S. (2008).
Change patterns and change support features - enhanc-
ing flexibility in process-aware information systems.
Data Knowl. Eng., 66:438–466.
West, T. G., Uhl, J. J., and Martinez, J. (2006). Seeing
the unseen: visualization in education. In ACM SIG-
GRAPH 2006 Educators Program. ACM.
Wilson, C. E. (2007). Designing useful and usable ques-
tionnaires: you can’t just ”throw a questionnaire to-
gether”. interactions, 14:48–63.
W
¨
orzberger, R., Ehses, N., and Heer, T. (2008). Adding
support for dynamics patterns to static business pro-
cess management systems. In Proc. of the 7th Inter-
national Conference on Software Composition, pages
84–91. Springer.
Zhao, X., Han, J., and Huang, Y. (2009). An automatic lay-
out function in bpel visual modeling tool. In Proc.
of the ACIS International Conference on Software
Engineering, Artificial Intelligence, Networking, and
Parallel/Distributed Computing, pages 14–17. IEEE
Computer Society.
CHANGE VISUALIZATIONS IN BUSINESS PROCESSES - Requirements Analysis
593
