
NON-PARAMETRIC ACQUISITION OF NEAR-DIRAC PIXEL
CORRESPONDENCES
Bradley Atcheson and Wolfgang Heidrich
Department of Computer Science, The University of British Columbia, Vancouver, Canada
Keywords:
Pixel Correspondences, Bloom Filter, Environment Matting, Structured Light.
Abstract:
Many computer vision and graphics applications require the acquisition of correspondences between the pixels
of a 2D illumination pattern and those of captured 2D photographs. Trivial cases with only one-to-one cor-
respondences require only a few measurements. In more general scenes containing complex inter-reflections,
capturing the full reflectance field requires more extensive sampling and complex processing schemes. We
present a method that addresses the middle-ground: scenes where each pixel maps to a small, compact set
of pixels that cannot easily be modeled parametrically. The coding method is based on optically-constructed
Bloom filters and frequency coding. It is non-adaptive, allowing fast acquisition, robust to measurement noise,
and can be decoded with only moderate computational power. It requires fewer measurements and scales up
to higher resolutions more efficiently than previous methods.
1 INTRODUCTION
Many problems in computer vision require the estab-
lishment of correspondences between camera pixels
and either a single or multiple points on scene ob-
jects or illuminants. For example, in 3D scanning it is
common to project a sequence of light stripes or en-
coded patterns onto an object in order to reconstruct
the geometry via the observed displacement of pro-
jector pixels. In these settings, each camera pixel re-
ceives only contributions from a single point on the
illuminant, i.e. the point spread function (PSF) is a
Dirac peak. Binary encodings such a Gray codes (Bit-
ner et al., 1976) can solve this pixel correspondence
problem. In practice however, they suffer from errors
since the PSFs are rarely perfectly Dirac, and such
binary codes do not readily admit subpixel-accurate
correspondences. At the other extreme, various sim-
plifications of the full 8D reflectance field (Debevec
et al., 2000) can be employed to obtain the low fre-
quencies.
In our work, we focus on the intermediate problem
of small, near-Dirac point spread functions which
must be captured with high subpixel precision. For
such applications it is not only necessary to estimate
small but finite-sized PSFs, but we must do so ro-
bustly, and with high accuracy. Due to their high-
frequency anisotropic nature, a non-parametric de-
scription of the PSFs is preferable to the axis-aligned
box (Zongker et al., 1999) or oriented Gaussian mod-
els (Chuang et al., 2000) used in environment matting.
Bloom filters are extremely space-efficient data
structures for probabilistic set membership test-
ing (Bloom, 1970). We show how such structures
can be optically constructed in the context of the
pixel correspondence problem, and then inverted us-
ing heuristics and compressive sensing algorithms. To
this we add a frequency-based environment matting
scheme (Zhu and Yang, 2004), but modified to in-
crease efficiency. It naturally handles one-to-many
pixel correspondences in a non-parametric fashion.
The result is a combined binary/frequency-based non-
adaptive coding scheme that requires a comparatively
small number of input images while being robust un-
der noise. Processing time is on the order of minutes
on a desktop machine, which is significantly faster
than the general light transport acquisition methods
based on compressed sensing.
2 RELATED WORK
Structured Light Scanning applications typically
employ efficient encodings such as Gray codes (Bit-
ner et al., 1976) that require only a small num-
ber of images. For scanning moving objects,
other codes have been developed which allow track-
247
Atcheson B. and Heidrich W..
NON-PARAMETRIC ACQUISITION OF NEAR-DIRAC PIXEL CORRESPONDENCES.
DOI: 10.5220/0003825002470254
In Proceedings of the International Conference on Computer Vision Theory and Applications (VISAPP-2012), pages 247-254
ISBN: 978-989-8565-04-4
Copyright
c
2012 SCITEPRESS (Science and Technology Publications, Lda.)

ing over time (Hall-Holt and Rusinkiewicz, 2001;
Rusinkiewicz et al., 2002). These stripe encodings
are efficient for the purpose of structured light scan-
ning, but have shortcomings. They can only deter-
mine one-to-one pixel mappings. While acceptable
for many 3D scanning purposes, the inability to deal
with mixtures of pixels can result in artifacts.
Scharstein and Szeliski (2003) projected both
Gray-coded stripes and sine waves of different spatial
frequencies. They note that binary codes can be dif-
ficult to measure in the presence of low scene albedo
or low signal-to-noise ratio and overcame this by pro-
jecting both the binary code and its inverse. In gen-
eral though, binary codes are very robust. Methods
based on absolute amplitude measurements are highly
dependent upon accurate radiometric calibration and
consistent scene albedo.
Environment Matting estimates the occlusion-free
light transport matrix between a 2D background and
camera image. Zongker et al. (1999) used binary
stripe patterns both horizontally and vertically to ob-
tain correspondences in the form of rectangular axis-
aligned regions on the background for each camera
pixel. This method suffers from ambiguities in cases
where two disjoint regions on the background map to
a single camera pixel Chuang et al. (2000) proposed a
number of improvements to this algorithm, including
one that generalizes the axis-aligned boxes to oriented
Gaussian regions of influence, and one that resolves
the bimodal distribution ambiguity via additional (po-
tentially redundant) diagonal sweeps.
For specular correspondences with small spatial
support, it is possible to derive algorithms that require
significantly fewer images by employing learning ap-
proaches (Wexler et al., 2002) or even single images
by optical flow (Atcheson et al., 2008).
Peers and Dutr
´
e (2003) proposed the use of
wavelets as illumination patterns for environment
matting. Their initial algorithm was adaptive, i.e. it
required processing the results of captured images to
decide which patterns to project next, drastically in-
creasing the acquisition time. This disadvantage was
remedied in a later work (Peers and Dutr
´
e, 2005), in
which the authors use sparsity priors to project re-
sults obtained with a fixed set of illumination patterns
into a new wavelet representation. While this method
produces excellent results for wide point spread func-
tions, it is less applicable to sharp PSFs.
Zhu and Yang (2004) have proposed a temporal
frequency-based coding scheme whereby the inten-
sity of each pixel is set according to a 1D signal (a
sinusoid). Our intra-tile coding scheme is based on
this method but employs a second carrier, ninety de-
grees out of phase of the primary sinusoid, to double
the information density at no extra cost. The use of
only integral frequencies satisfies the Nyquist ISI cri-
terion and allows for very fast, easy and robust DFT-
based decoding. We choose to uniquely code individ-
ual pixels (within each tile) rather than coding whole
rows and columns of the illuminant. This allows
our method to scale up to higher illuminant resolu-
tions, and to naturally handle PSFs of arbitrary (small)
shape, rather than assuming a parametric form.
Light Transport Matrix. Recent papers have fo-
cused on the general problem of estimating the light
transport matrix between illuminant and camera pix-
els. Most employ strategies similar to those used
in environment matting. Sen et al. (2005) propose
a hierarchical decomposition into non-interfering re-
gions. The adaptive approach requires many images
to resolve PSFs overlapping multiple regions.
Garg et al. (2006) note that the light transport ma-
trix is often data-sparse. They exploit this, along with
its symmetry due to Helmholtz reciprocity, in their
adaptive acquisition algorithm that divides the matrix
into blocks and approximates each with a rank-1 fac-
torization. Wang et al. (2009) similarly seek a low-
rank approximation to the full matrix. However, they
do so by densely sampling rows and columns of the
matrix (which requires a complex acquisition setup)
and then using a kernel Nystr
¨
om method to recon-
struct the full matrix. These methods assume the ma-
trix to be data-sparse (compressible).
Methods based on compressed sensing are begin-
ning to appear. Sen and Darabi (2009) and Peers et al.
(2009) both describe promising, non-adaptive, meth-
ods that transform the light transport into a wavelet
domain in which it is more sparse. While these meth-
ods allow for capturing very complex light trans-
port, they still require on the order of hundreds to
thousands of images at typical resolutions, and many
hours of decoding time to obtain results.
Our method combines advantages of many of the
aforementioned works in that it is both scalable and
robust, while being conceptually simple and easy to
implement. For typical configurations we require on
the order of a few hundred images that can be ac-
quired non-adaptively in seconds and then processed
in minutes on a standard desktop computer. Unlike
more advanced light transport acquisition methods,
we cannot acquire large, diffuse PSFs (one-to-many
correspondences). But for the case of small, finite
PSFs, those methods require many images to resolve
high frequency detail. In contrast, our method effi-
ciently captures accurate data at much lower cost in
terms of acquisition and processing time.
VISAPP 2012 - International Conference on Computer Vision Theory and Applications
248
3 ALGORITHM
We propose a combined binary/frequency-coded
structured light pattern for estimating pixel corre-
spondences. Appropriate acquisition setups are sim-
ple and inexpensive. All that is required is a spatially-
addressable background illuminant (projector or LCD
monitor), a camera and a reflective or refractive scene.
Projected patterns are acquired by a synchronized
camera and then decoded offline.
The detection algorithm is divided into two
phases. First, the background is partitioned into small
rectangular tiles (we use 8 ×8 pixels). Each tile is as-
signed a unique temporal binary code. A sequence of
images is acquired where the tiles flash white or black
according to their bit pattern. Since each camera pixel
maps to a small area of the background, the measured
signal consists of the superposition of these bit pat-
terns. The task is then to determine which codes are
present in the observed signal. We use sparsity and
spatial coherence heuristics to solve it.
In the second phase we obtain per-pixel weights
corresponding to the PSF. Each pixel within a tile is
assigned a unique integral frequency and phase com-
bination. We then acquire a sequence of patterns in
which each pixel’s intensity varies according to the
amplitude of its corresponding sinusoidal waveform.
The first phase (inter-tile coding) may optionally
use a frequency encoding similar to that of the sec-
ond phase, but at higher resolution. We describe this
method first in Section 3.1 and note that it performs
very well in simulation. However, with real data that
may not be subject to our simulated assumptions of
additive white noise, we turn instead to the Bloom
filter-based method described in Section 3.2. The sec-
ond phase (intra-tile) is then described in Section 3.3.
3.1 Inter-tile Frequency Coding
As previously mentioned, we assign each tile a unique
code. By enumerating tiles this way in 2D, we avoid
the ambiguity suffered by methods that partition the
background into rows and columns (Zongker et al.,
1999; Chuang et al., 2000). In those schemes, a
pixel containing contributions from rows x
1
6= x
2
and
columns y
1
6= y
2
has four possible intersection points.
The actual beam may have struck two, three or four
of these points, and the natural way to eliminate the
phantom points is to perform an additional scan pass
using a different orientation (e.g. diagonal lines).
However, for the unambiguous beams this pass is re-
dundant and reduces efficiency.
The disadvantage of using 2D enumeration is that
there are usually far more tiles requiring unique iden-
δ
f
δ
φ
normalized frequency (f)
2π
phase offset (φ)
0
0.5
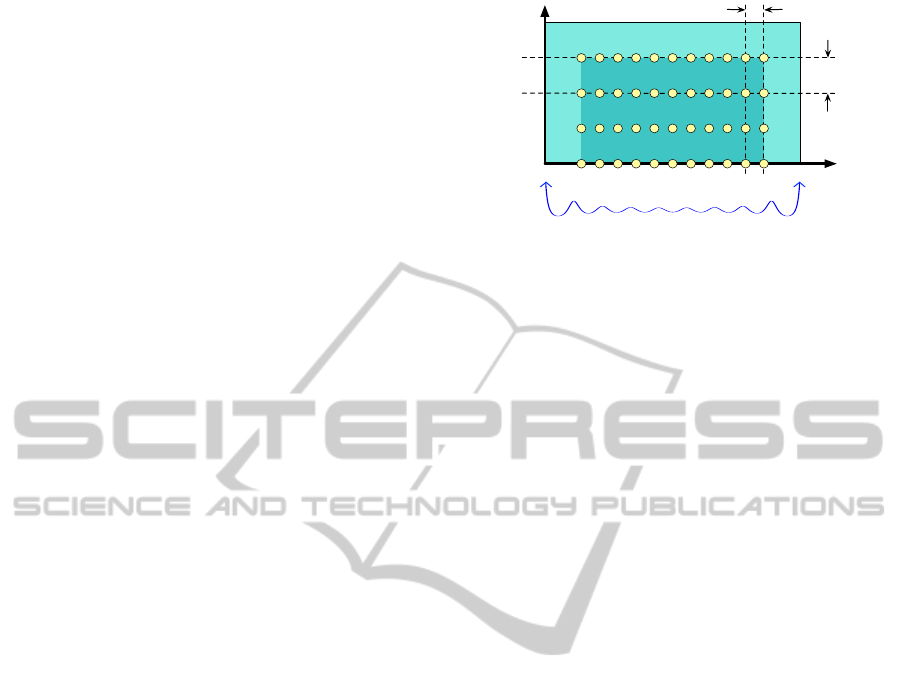
Figure 1: Sample points in frequency/phase space. δ
f
and
δ
φ
may be arbitrarily small. The graph below represents the
Cram
´
er-Rao Bound for the variance on frequency estimates.
Note that accuracy degrades significantly near the 0 and 0.5
cycles/sample limits.
tifiers than either rows or columns. For example, a
1600 ×1200 monitor could be partitioned into 30,000
tiles of size 8 × 8. Were we to directly employ
frequency-based environment matting (Zhu and Yang,
2004) on these, we would have a maximum frequency
of 30kHz and thus require more than 60,000 cap-
tured images. Even the improvement we describe
in Section 3.3 only halves this. But this does as-
sume only integral frequencies and only two phases.
We are in fact free to choose any appropriate fre-
quency/phase sampling resolution. Figure 1 shows an
example sampling lattice in frequency/phase parame-
ter space. In the diagram a regular grid is used, with
buffer regions in the very low and very high frequen-
cies. Frequency estimation accuracy in these bound-
ary regions is degraded, as predicted via the Cram
´
er-
Rao Bound (CRB), which places a lower bound on the
variance of an unbiased estimator (Kay, 1993). While
the CRB suggests that an optimal lattice would be
nonuniformly spaced with frequency sampling den-
sity varying according to f , in practice the oscillations
are small and we prefer a regular grid for simplicity.
However, frequencies near 0 Hz and the Nyquist limit
should nevertheless be avoided.
This very dense sampling requires a signal param-
eter estimation algorithm that can very accurately de-
tect the frequencies. Periodograms, as used in the
intra-tile coding step, are most useful when only inte-
gral frequencies are present. Otherwise, spectral leak-
age interferes. In higher resolution scenarios, better
accuracy can be obtained via subspace methods such
as ESPRIT (Roy and Kailath, 1989). Based on eigen-
decomposition of the signal covariance matrix, it is
particularly well suited to the case of sinusoidal pa-
rameter estimation in a signal corrupted by additive
white Gaussian noise.
Despite their great accuracy, subspace methods
can fail when signals contain multiple components
of very similar frequency. This is likely to occur if
NON-PARAMETRIC ACQUISITION OF NEAR-DIRAC PIXEL CORRESPONDENCES
249

we number the tiles in row- or column-wise order
and map these directly to consecutive points in fre-
quency/phase space, because many beams will strike
near the tile boundaries and receive contributions
from adjacent tiles. To ensure that spatial neigh-
bors are not also frequency/phase-space neighbors it
is necessary to label them according to a random, or
low discrepancy sequence.
Our simulations in Section 4 indicate that 225,000
unique codes can be represented in 64 images. Unfor-
tunately, real-world experiments could not reproduce
these synthetic results. One possible explanation is
that Gaussian noise is a poor model of the actual mea-
surement noise and response-curve linearization error
in our acquisition setup. While we believe that high
resolution spectral methods show promise for pixel
coding, our experiments suggest that too many im-
ages need be captured in order to obtain accurate es-
timates. For this reason we also developed the better-
performing binary coding scheme described next.
3.2 Inter-tile Binary Coding
A set of N distinct tiles can easily by coded as consec-
utive natural numbers, whose binary representations
require the acquisition of only log
2
N images. This
scheme suffers from reliability problems, in that a sin-
gle incorrectly-read bit can drastically alter the num-
ber. Gray codes ameliorate this problem by ordering
the binary codes such that successive codes differ in
only a single bit (Bitner et al., 1976; Scharstein and
Szeliski, 2003). This ensures that adjacent tiles have
bit patterns that differ in only one position. Camera
beams that strike a boundary between two tiles will
measure the superposition of two very similar codes,
and the most likely error to occur (in the bit position
that differs between the two tiles) will result in a lo-
calization error of at most one tile. In general though,
the superposition of binary codes separated by large
Hamming distances leads to measurements that are
difficult to interpret and that lack a reliability metric.
The Bloom filter is an extremely space-efficient
data structure for probabilistic set membership test-
ing (Bloom, 1970). It is represented as a vector of
m bits, all initialized to 0. To insert an object, one
computes k independent hash values, all in the range
[1,m] and sets the corresponding bits to 1. To query
whether an object is in the set, one computes its hash
values and checks whether those bits are all on (an
O(1) operation). False negatives are impossible (as-
suming no error in reading the bit values), although
there is a probability of approximately
f =
1 −
1 −
1
m
kn
!
k
(1)
of returning a false positive, when the set contains n
elements. This probability is minimized by choosing
k = b(m/n)ln 2c to arrive at a false positive rate of
approximately f = (0.6185)
m/n
(Kirsch and Mitzen-
macher, 2006).
In the context of our pixel (tile) correspondences,
the Bloom filter is constructed optically. We decide
beforehand on an acceptable error rate f or else a
fixed image acquisition budget m, and compute the
optimal k value. Each tile is then assigned a binary
code based on those k uniformly-distributed hash val-
ues. Because the number of tiles is smaller than the
universe of
m
k
keys, it is feasible to explicitly enu-
merate them all as the columns of a “code matrix” C,
as depicted in Figure 2.
The camera acquires a sequence of images, which
are then thresholded to binary values. Each pixel
therefore records a signal vector y that corresponds
to a Bloom filter containing the hash codes of all the
tiles struck by that camera beam. By our assump-
tion of near-Dirac PSFs, there is an upper bound of
4 on the number of elements in the set (n). With 64
images, this gives a false probability rate of approx-
imately 0.05%. Since they are sparsely distributed,
these errors can be detected via a spatial median filter.
Decoding the measured signals y
i
is a matter of
inverting the Bloom filter. Since we have the matrix
C, this can be done by solving the equation
y
i
= (Cx > 0). (2)
The underdetermined system can only be solved by
assuming that x is sparse, which is the case for near-
Dirac PSFs. This is similar to the standard basis pur-
suit problem
min
x
||x||
1
subject to y
i
= Cx (3)
encountered in compressed sensing problems. Having
chosen the columns of C independently to be sparse
binary vectors, they are incoherent (mutually orthogo-
nal), satisfying the restricted isometry property (Can-
des and Tao, 2005). The primary difference between
Equation 2 and basis pursuit is that we cannot mea-
sure Cx directly and must make do with only its spar-
sity pattern. In practice, solutions can be found with
the aid of heuristics. To solve the equation we first
compute
v
i
= C
T
y
i
. (4)
Since the matrices are sparse and binary, this can be
done for each pixel y
i
reasonably efficiently. The re-
sult is an integer-valued vector v
i
. The indices of
entries of v
i
equal to k correspond to a superset of
codes that make up the solution. Extracting only those
columns of C to form C
0
allows us to instead solve the
much smaller problem
y
i
= C
0
x > 0. (5)
VISAPP 2012 - International Conference on Computer Vision Theory and Applications
250

001000101 1
1
0
0
0
1
0
1
�
�
1
0
0
Figure 2: Binary temporal codes. Each tile is assigned a
unique binary code across the projected image sequence.
The codes form the columns of the code matrix.
Due to partial overlap it is possible for codes to be er-
roneously included in C
0
. For example, given binary
codes U = (0,1,1), V = (1,1, 0) and W = (1,0, 1)
then a ray striking tiles coded by U and V will produce
the measurement X = (1, 1,1). W will then be in-
cluded in C
0
since W ·X = 2 = k. Our objective there-
fore is to find a minimal subset of the active codes that
adequately explain the measurement.
Any algorithm for solving the basis pursuit prob-
lem will give us an estimate of the solution. We ad-
ditionally impose the constraint that 0 ≤ x ≤ 1. Un-
fortunately, since overlapping nonzeros in the codes
produce values that exceed the range of y
i
, an exact
solution is unlikely and we must instead threshold the
resultant x at an empirically-determined value (0.1 in
our experiments).
Another heuristic is to enforce spatial coherence,
which will be satisfied by all near-Dirac beams. The
tile coordinates corresponding to the codes in C
0
are
clustered according to a Chebychev distance thresh-
old of 1. This gives us separate islands of tiles, each
of which is checked to see if its constituent tile codes
can account for all the observed “on” pixels. If so,
then that one island is a solution to Equation 5.
During processing, any pixels that cannot be de-
coded are recorded for further examination during
the postprocessing phase. At that time, the neigh-
bors have been determined, so any tile islands that lie
suffiently close to any of the neighbors are considered
to be valid solutions, even if a few code bits do not
match (the result of thresholding errors during acqui-
sition).
3.3 Intra-tile Coding
When a camera beam neither splits into multiple
paths, nor spreads out over a large area, we expect
a small PSF lying either entirely within one tile, or
across the boundaries of two, three or four neighbor-
ing tiles. Because the pixels struck by a beam within
a tile are somewhat analogous to the tiles struck on
1 5 1 5
2 6 2 6
3 7 3 7
4 8 4 8
5
6
7
8
1
2
3
4
5 51 51 1
8 84 84 4
cos(3 × 2πt)
−sin(3 ×2πt)
1 5 1 5
2 6 2 6
3 7 3 7
4 8 4 8
1 5 1 5
2 6 2 6
3 7 3 7
4 8 4 8
1 5 1 5
2 6 2 6
3 7 3 7
4 8 4 8
1 5 1 5
2 6 2 6
3 7 3 7
4 8 4 8
1 5 1 5
2 6 2 6
3 7 3 7
4 8 4 8
1 5 1 5
2 6 2 6
3 7 3 7
4 8 4 8
1 5 1 5
2 6 2 6
3 7 3 7
4 8 4 8
Beam footprint
0 2 4 6 8 10 12 14 16
−1.0
−0.5
0.0
0.5
1.0
Orthogonal 3Hz signals
0 2 4 6 8 10 12 13 16
−2.0
−1.5
−1.0
−0.5
0.0
0.5
1.0
1.5
2.0
Temporal superposition
0 1 2 3 4 5 6 7 8 9
0.0
0.2
0.4
0.6
0.8
1.0
Amplitude spectrum (real)
0 2 4 6 8 10 12 13 16
−2.0
−1.5
−1.0
−0.5
0.0
0.5
1.0
1.5
2.0
Temporal superposition
0 1 2 3 4 5 6 7 8 9
0.0
0.2
0.4
0.6
0.8
1.0
Amplitude spectrum (real)
FFT
Subpixel peak
Figure 3: Left: Sample 4x4 tile. In this case, f
max
= 8Hz.
The phase is 0 in the left half of the tile and π/2 in the right.
Right: Temporal superposition of signals under the beam
footprint.
the background, we could use the same strategy for
detecting them: uniquely coding each pixel within a
tile. There are however, two key differences here that
call for a different method. First, a greater proportion
of the pixels within a tile will be struck than the pro-
portion of tiles struck within the background. Both
inter-tile coding methods break down when too many
codes are superimposed. Second, there are relatively
few pixels in total within each tile, making a more
direct, non-parametric method feasible.
In particular, we use the frequency coding method
described by Zhu and Yang (2004), but modify it to
require only half as many images. Figure 3 shows an
example of a tile surrounded by segments of its eight
neighbors. The N ×N tile is split vertically in half,
and each side is enumerated as indicated. The label of
the k’th pixel corresponds directly to its temporal fre-
quency f
k
. The spatial location is encoded by setting
the frequency and phase of a complex exponential
s(t) = Ae
i(2π f t+φ)
, t ∈ [0,1) (6)
and modulating the intensity s of each background
pixel over time as
s
0
(t) = b0.8D/2cs(t) + D/2 (7)
in order to take the effective dynamic range D of the
display into account (D = 256 for an 8-bit LCD). The
factor 0.8 is chosen empirically to avoid the extremes
of the display’s intensity range, where clipping can
occur. The pixel’s location is hence transmitted as a
sampled waveform. The maximum frequency f
max
is
N
2
/2Hz and so we set F
s
= 2( f
max
+ 1) to satisfy the
Nyquist rate, and the sampling rate to T
s
= 1/F
s
. The
projected frames then correspond to discrete times
n ∈ {0,T
s
,2T
s
,. .. ,1 −T
s
}. If the phase were unre-
stricted we could generate a discrete sequence of pixel
intensities for the k’th pixel as
NON-PARAMETRIC ACQUISITION OF NEAR-DIRAC PIXEL CORRESPONDENCES
251

s
0
k
[n] = s
0
(s
k
[n]) = s
0
Ae
i(2π f
k
t+φ
k
)
. (8)
But we can ease the spectral estimation by allowing
only two phases spaced exactly one quarter-period
apart, chosen for convenience to be 0 and π/2. Hence
we assign the following signals within a tile:
s
k
[n] =
cos(2π f
k
n), left half,
−sin(2π f
k
n), right half.
(9)
The encoder assigns to all signals a unit magnitude
(A = 1) so that we can easily recover relative contri-
butions from multiple frequencies when camera rays
strike multiple pixels. The receiver measures a su-
perposition of signals from the p pixels struck by the
beam, corrupted by what we model as additive white
Gaussian noise w:
x[n] =
p
∑
l=1
A
l
e
i(2π f
l
n+φ
l
)
+ w[n] (10)
Our goal is to estimate the parameters f
l
and φ
l
,
which together encode the position of each compo-
nent pixel, and A
l
which will represent the relative
amount of light arriving at the sensor from it. To
estimate these spectral parameters we use the pe-
riodogram, which represents the magnitude-squared
Fourier transform of the signal, divided by the number
of time samples (Kay, 1993). After performing a per-
pixel FFT, we scale by T
s
and discard the redundant
copy of the spectrum. The real component (in-phase
channel) then directly corresponds to the relative con-
tribution A
k
towards the PSF from pixels in the left
half and the imaginary component (quadrature chan-
nel) likewise corresponds to contributions from the
right. The PSF can be directly visualized by plotting
these results as an NxN intensity plot, as in Figure 3
(right, top). It is thus described non-parametrically,
and a subpixel-accurate location of the peak may be
interpolated and added to the tile’s global coordinates.
An approximate interpolant may be obtained via the
amplitude spectrum’s centroid, or a local 3 ×3 Gaus-
sian fit (Thomas et al., 2005).
A complication arises if the beam crosses a tile
boundary. Previous methods for handling boundary
overlaps in tile-based schemes have involved scan-
ning additional passes with translationally offset tile
grids (Sen et al., 2005) and considering only one of
these passes: that which finds the PSF fully enclosed
by a single tile. Our method requires only a single
pass, as long as the PSF is smaller than a single tile.
We locate the maximum value in the magnitude spec-
trum and circularly shift this to the centre of the tile,
recording the shift vector so that we can subtract it and
still obtain an absolute position in global coordinates.
Figure 4: Background distortion through a poorly-
manufactured wineglass. The rightmost images show log
magnitude of vertical and horizontal apparent displacement
of background pixels when viewed through the glass. The
scale is 0.01 to 250 pixels.
4 RESULTS
We first demonstrate successful capture of simple en-
vironment mattes using the binary/frequency coding
method, then present simulations indicating the ex-
pected performance of a method based on high reso-
lution spectral estimation. We include them since they
suggest a way to increase the information throughput
for a given image aquisition budget, but note that a
more accurate measurement setup would be necessary
to achieve such results in practice.
To test the algorithm we computed optical flow by
comparing the correspondences before and after plac-
ing a refracting object in front of the camera. Figure 4
shows the displacement vectors and a sample photo-
graph of the scene (from a different viewpoint). The
Bloom filter parameters for this dataset were m = 60
and k = 4. Aside from missing data in regions of total
internal reflection, the errors are few and easily fil-
tered out.
In some cases we require a single corresponding
point on the background for each camera pixel, in
others we require the whole PSF. Figure 5(a) shows
how our method can provide both an accurate non-
parametric PSF, as well as a reasonably accurate point
correspondence. Since the precise location of non-
Dirac PSFs is undefined, we choose it to be the cen-
troid of the neighborhood around the brightest pixel.
In a moving scene one may compute the optical flow
between PSFs from one time step to the next, without
needing to know their precise location. Figure 5(a)
also shows a near-failure case where too few binary
code images were captured (m = 40, k = 4), resulting
in many undetectable pixels.
Unlike Gray codes, our method is capable of de-
tecting PSFs composed of multiple near-Dirac com-
ponents. Figure 5(b) shows an example where a
beamsplitter (mounted inside the occluding housing)
and mirror combination are used to direct camera
VISAPP 2012 - International Conference on Computer Vision Theory and Applications
252

(a) (b)
Figure 5: (a) Examples of spread-out, bimodal and point-
like point spread functions. The color gradient indicates the
vertical component of the detected background pixels’ co-
ordinates. (b) Multipath correspondences. A beamsplitter
inside the occluder reflects some light onto a mirror that di-
rects it to another point on the illuminant. The bottom row
of images show a closeup of the central region (the beam-
splitter) on a different color scale.
rays to two distinct points on the illuminant. This
example shows only the inter-tile binary coding re-
sult, since frequency-based intra-tile coding would
require larger tiles when acquiring larger, or multi-
component, PSFs. In this case, we eliminate the tiles
and apply binary coding to each pixel. The result is
that fewer images need be captured, at the cost of los-
ing subpixel precision.
Capture paramaters were m = 112 and k = 10. We
assumed that at most 8 tile codes would be present
in any one Bloom filter to accommodate the worst
case of both beams striking at the intersection of four
neighboring tiles. The false positive probability in
this case is 0.098%.
To verify the accuracy of our frequency estima-
tions and to determine appropriate parameter values,
we conducted simulations under expected conditions.
Figure 6 shows the results. In the leftmost graph,
we analyzed the impact of measurement noise for
the case where only a single frequency is embed-
ded in the signal. The graphs show median abso-
lute error, relative to the Nyquist frequency, so an up-
per error value of 0.5 ×10
−3
indicates that we could
choose a sampling lattice spacing of double this, i.e.
δ
f
= 0.001 ×N/2 Hz. Error values asymptotically
approach a lower bound as the number of captured
images increases, but going beyond 100 images leads
to diminishing returns. Too few images however, lead
to very high error, indicating that ESPRIT would not
be suitable for detecting frequencies within a tile.
Next, we investigated how superposition of sig-
nals degrades performance. The second graph shows
cases with up to four simultaneous frequencies, cho-
sen randomly, but spaced far enough apart so as not
to be strongly correlated. The amplitudes were all set
to 1.0 and the simulation was run at an SNR of 30dB.
Accuracy does degrade as more signals are added, but
the effect becomes relatively small as N increases.
The third graph shows that we are unable to de-
tect phase as accurately as frequency. For this reason,
the sampling interval δ
φ
depicted in Figure 1 must be
much larger than δ
f
. The vertical axis in this graph is
relative to π rad/sample.
The final graph shows amplitude accuracy, at
which we obtain similar performance to phase (as is
to be expected, since both values result from the so-
lution of the same linear system). The vertical axis is
relative to the unit input signal amplitude.
Given these results, we can determine the number
of tiles than can adequately be coded given a fixed im-
age acquisition budget. For a typical case of N = 64
images taken at an SNR of 30dB, when four sinu-
soids are present, frequency can reliably be detected
to within 0.0004 ×N/2 = 0.0128Hz, and the phase
is accurate to within 0.005 ×π rad/sample. Avoid-
ing the lower 5% and upper 5% of frequencies, and
covering this space with a lattice of points spaced
δ
f
= 2 ×0.0128 Hz and δ
φ
= 2 ×0.005π rad/sample
apart gives us 225k sample points, i.e. 64 images is
enough to support 225k tiles, so long as no more than
four of them are superimposed at one pixel.
5 CONCLUSIONS
Most prior methods for establishing pixel correspon-
dences are based on matching spatio-temporal inten-
sity patterns. These produce qualitatively good vi-
sual results, but lack guarantees on correctness. We
have proposed instead to assign unique codes on the
tile level and then demultiplex them after transmis-
sion through the optical projector-camera multiplexer.
This opens up the possibility of using tools from dig-
ital signal processing to ensure that each code is ac-
curately read. One possible direction for future work
would be to insert error detection and correction codes
into the signals.
Our current binary signal decoding scheme em-
ploys compressed sensing and spatial heuristics to de-
multiplex signals. We have introduced the Bloom
filter as an optical computing tool for determining
one-to-few pixel correspondences. However, without
more advanced DSP techniques, we cannot accom-
modate one-to-many correspondences. To circumvent
this problem, we group pixels into tiles, and apply a
separate frequency-based coding scheme to map the
pixels within each tile. To this end, we have improved
upon existing methods by halving the required num-
ber of images, eliminating redundant sweep scans,
and allowing for subpixel precision with nonparamet-
ric point-spread functions.
NON-PARAMETRIC ACQUISITION OF NEAR-DIRAC PIXEL CORRESPONDENCES
253
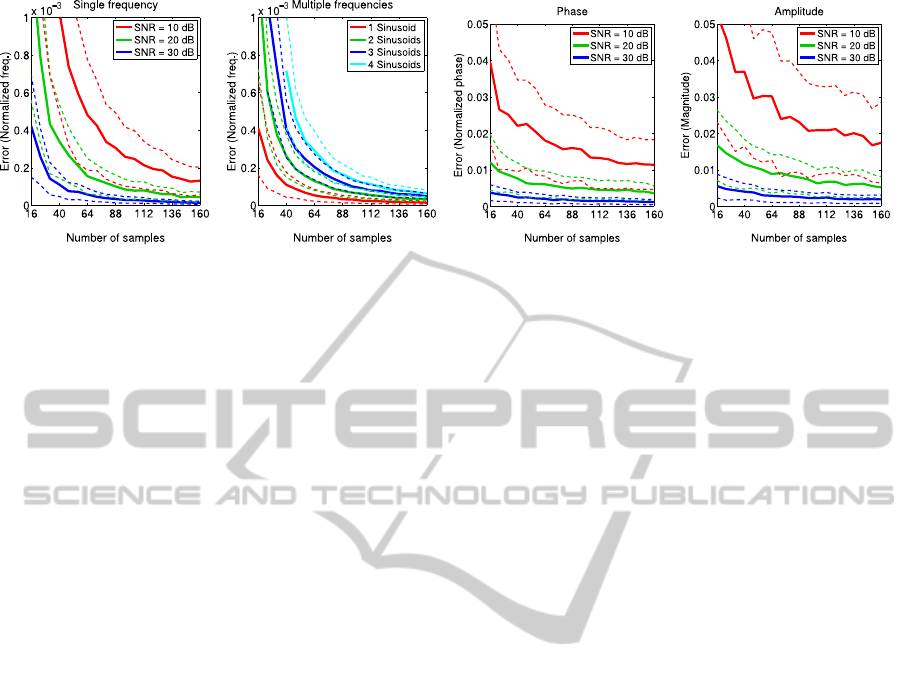
Figure 6: Synthetic experiment results. Solid lines show the median absolute error, while dashed lines indicate the median
absolute deviation. 500 trials were performed for each tested sample size.
REFERENCES
Atcheson, B., Ihrke, I., Heidrich, W., Tevs, A., Bradley, D.,
Magnor, M., and Seidel, H.-P. (2008). Time-resolved
3D capture of non-stationary gas flows. ACM Trans.
Graphics, 27:132.
Bitner, J., Ehrlich, G., Reingold, E., and 1976 (1976). Ef-
ficient generation of the binary reflected Gray code
and its applications. Communications of the ACM,
19:517–521.
Bloom, B. H. (1970). Space/time trade-offs in hash coding
with allowable errors. Communications of the ACM,
13:422–426.
Candes, E. J. and Tao, T. (2005). Decoding by linear pro-
gramming. IEEE Transactions on Information The-
ory, 51:4203–4215.
Chuang, Y.-Y., Zongker, D. E., Hindorff, J., Curless, B.,
Salesin, D. H., and Szeliski, R. (2000). Environ-
ment matting extensions: Towards higher accuracy
and real-time capture. In Intl Conf. on Computer
Graphics and Interactive Techniques, pages 121–130.
Debevec, P., Hawkins, T., Tchou, C., Duiker, H.-P., Sarokin,
W., and Sagar, M. (2000). Acquiring the reflectance
field of a human face. In SIGGRAPH ’00, pages 145–
156.
Hall-Holt, O. and Rusinkiewicz, S. (2001). Stripe boundary
codes for real-time structured-light range scanning of
moving objects. In Proc. ICCV, volume 2, pages 359–
366.
Kay, S. M. (1993). Fundamentals of statistical signal pro-
cessing, Volume I: Estimation theory. Prentice Hall
PTR.
Kirsch, A. and Mitzenmacher, M. (2006). Less hashing,
same performance: Building a better bloom filter. In
Algorithms - ESA 2006, volume 4168, pages 456–467.
Springer.
Peers, P. and Dutr
´
e, P. (2005). Inferring reflectance func-
tions from wavelet noise. In Bala, K. and Dutr
´
e, P.,
editors, Proc. EGSR, page 173182.
Roy, R. and Kailath, T. (1989). ESPRIT-estimation of sig-
nal parameters via rotational invariance techniques.
IEEE Trans. Acoustics, Speech, and Signal Process-
ing, 37:984–995.
Rusinkiewicz, S., Hall-Holt, O., and Levoy, M. (2002).
Real-time 3D model acquisition. ACM Trans. Graph-
ics, 21:438–446.
Scharstein, D. and Szeliski, R. (2003). High-accuracy
stereo depth maps using structured light. In Proc.
CVPR, volume 1, pages I–195—-I–202.
Sen, P., Chen, B., Garg, G., Marschner, S. R., Horowitz,
M., Levoy, M., and Lensch, H. P. A. (2005). Dual
photography. ACM Trans. Graphics, 24:745–755.
Thomas, M., Misra, S., Kambhamettu, C., and Kirby, J.
(2005). A robust motion estimation algorithm for piv.
Measurement Science and Technology, 16:865–877.
Wexler, Y., Fitzgibbon, A., and Zisserman, A. (2002).
Image-based environment matting. In Proc. 13th Eu-
rographics Workshop on Rendering, pages 279–290.
Zhu, J. and Yang, Y.-H. (2004). Frequency-based environ-
ment matting. In Proc. Pacific Graphics, pages 402–
410.
Zongker, D. E., Werner, D. M., Curless, B., and Salesin,
D. H. (1999). Environment matting and compositing.
In Intl Conf. Computer Graphics and Interactive Tech-
niques, pages 205–214.
VISAPP 2012 - International Conference on Computer Vision Theory and Applications
254
