
COMAV - A COMPONENT APPLICATION VISUALIZATION TOOL
Use of Reverse Engineering and Interactivity in Visualization
for Component Software Comprehension
Jaroslav
ˇ
Snajberk and P
ˇ
remek Brada
Department of Computer Science and Engineering, Faculty of Applied Sciences,
University of West Bohemia, Pilsen, Czech Republic
Keywords:
Component, Visualization, Interactivity, Reverse Engineering.
Abstract:
Visualization of software applications plays an important part in the process of comprehending new software
systems and is even more important due to its increasing complexity. Component-based development works
with complex structure of black-box units and paradoxically there is not much choice in terms of both notation
and tooling when one needs to visualize structure of these component-based applications. Reverse engineering
is available for only a few component models and the state of the practice in visualization is the simple
and static component diagram introduced in UML 2.0. In this paper we present a tool that is generic and
it is therefore usable for any component-based application. This tool works with an advanced meta-model
(ENT) as an intermediate data model to store all the reverse-engineered information about these applications.
This information is then available for further visualization. A new notation based on this meta-model is also
suggested in this paper which uses several interactive techniques to enhance the comprehension process.
1 INTRODUCTION
Both visualization and reverse engineering of
component-based applications are a problematic
tasks, because of differences between component
models. There are dozens of component models in
Java only like OSGi
1
, EJB
2
, SOFA 2
3
, COSi
4
and
others. The main problem lies in the absence of
united representation of components that would pro-
vide some details about them; there are also no re-
lated methods to reverse-engineer the structure of
component-based applications. A united representa-
tion ensures the readability of diagrams across differ-
ent component models. When one needs to visual-
ize the structure of reverse-engineered application it
would also be highly appropriate to provide him with
more information than just component boxes and re-
lations between them.
There are of course tools that are able to recon-
struct the structure of component-based software, but
they are closely bound to specific component mod-
1
www.osgi.org
2
www.oracle.com/technetwork/java/javaee/ejb/index.ht
ml
3
http://sofa.ow2.org/
4
www.assembla.com/wiki/show/cosi
els in both the visualization and reverse-engineering
abilities. For example: SOftware MOdel eXtractor
(SoMoX), (Becker et al., 2010) visualizes only Palla-
dio component model (Becker et al., 2009), SaveIDE
(Sentilles et al., 2009) visualizes only SaveCCM
(Hansson et al., 2004) and Plug-in Dependency Vi-
sualization
5
visualizes Eclipse plug-ins (OSGi).
1.1 Related Work
Telea’s work on interactive visualization of
component-based software (Telea and Voinea,
2004) is generic and mostly similar to our work, but
it does not provide much details about component
themselves. Wettel’s visualization of software as
cities (Wettel and Lanza, 2007) could be easily used
on component software, but again it does not provide
details needed to get a full structure comprehension.
Interactivity should help in the first place with
the creation of a mental model, so that one will be
able to make decisions. It is important to lighten the
cognitive load, namely hide unnecessary details, as
Ric Holt highlighted with several examples in (Holt,
5
www.eclipse.org/pde/incubator/dependency/visualizati
on/
755
Šnajberk J. and Brada P..
COMAV - A COMPONENT APPLICATION VISUALIZATION TOOL - Use of Reverse Engineering and Interactivity in Visualization for Component
Software Comprehension.
DOI: 10.5220/0003827707550758
In Proceedings of the International Conference on Computer Graphics Theory and Applications (IVAPP-2012), pages 755-758
ISBN: 978-989-8565-02-0
Copyright
c
2012 SCITEPRESS (Science and Technology Publications, Lda.)
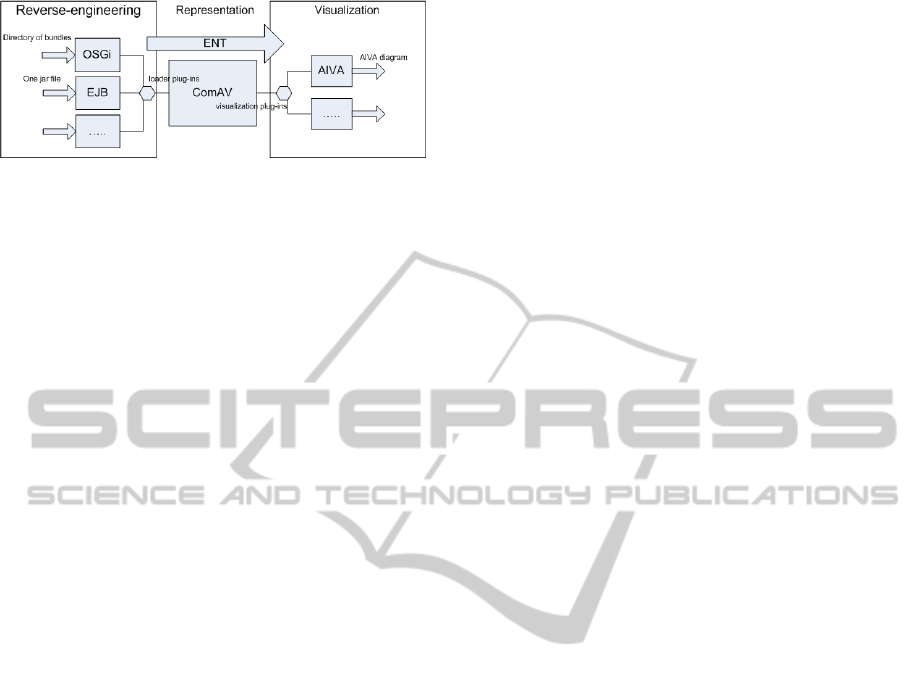
Figure 1: The structure of ComAV.
2002). The importance of interactivity for the ability
to make decisions over mental model is mentioned in
several studies, one of them is by Meyer et al. (Meyer
et al., 2010). He goes even further and defines new
science of visually enabled reasoning, implying that
interactivity is its key enabler.
1.2 Goal and Structure of This Paper
In this paper we present the ComAV (Component Ap-
plication Visualizer) tool and its AIVA (Advanced
Interactive Visualization Approach) plug-in as im-
plementation of our approach to the visualization of
structure of component-based applications. ComAV
is a platform for visualization and reverse-engineering
of component-based software, which provides simple
extension mechanism, so new component models can
be added easily and new visualization styles can be
used independently on the component models. AIVA,
implemented as ComAV plug-in, aims to improve ori-
entation in visualized software by adopting several in-
teractive techniques – mostly details on demand and
tracking features.
The structure and theory behind this generic plat-
form will be described in Section 2, while AIVA will
be described in detail in Section 3. Finally the con-
tribution of these two products will be discussed in
Section 4.
2 COMPONENT APPLICATION
VISUALIZER: COMAV
The purpose of ComAV is to create a generic
workspace for visualization and management of
component-based applications. ComAV can reverse-
engineer a component application written in any com-
ponent model, but it doesn’t support any component
model directly. Instead, it uses a uniform data struc-
ture as an exchange format, that is able to hold all
the information about both the component model and
the application. This exchange format is produced
by reverse-engineering plug-ins as an output, which
is saved by ComAV and which visualization plug-ins
can later use it as an input (see Figure 1). ComAV
user interface provides a project view where analyzed
applications are made available; a console, to keep the
track of what ComAV is doing; an editor view, where
visualization plug-ins provide its visual output; and
a menu, where reverse-engineering plug-ins can add
new component models.
The exchange data structure must be, in the
first place, component model independent and have
the ability to describe component in desired de-
tail. We chose the ENT meta-model (Snajberk and
Brada, 2011a) for this purpose, which is a generic
meta-model developed directly for the description of
component-based applications. Its most important
features are: faceted classification used to charac-
terize component’s elements; ability to describe any
component with required details; and coverage of
both component model and component-based appli-
cation structures. The advantage of faceted classifica-
tion is that visualization can make use of these charac-
teristics to improve layout or representation of com-
ponents.
Currently ComAV supports reverse-engineering
of OSGi, EJB or SOFA 2 component models. XML
is used to store the data. The workspace is an
RCP (Rich Client Platform) application based on the
Eclipse IDE, thus it is written in Java and it’s archi-
tecture is plug-in based. Development of new plug-ins
that would introduce support for any other component
model is therefore very simple. It is important to note
that these new plug-ins can be made without changing
anything in the existing implementation.
3 ADVANCED INTERACTIVE
VISUALIZATION APPROACH:
AIVA
AIVA uses oriented graph to visualize components
and their relations. Its notation is similar to the UML
component diagram, but unlike complete UML it is
focused only on component-based software to provide
more precise information. Moreover, it adopts inter-
active techniques to improve the process of software
comprehension. The principles of this approach are
described in (Snajberk and Brada, 2011b) and AIVA
is an implementation of these principles.
Its easy to understand visual notation is unified for
all component models – any component will look the
same, it will only vary in the inner elements of the
component. The differences and similarities can be
observed by comparing OSGi and EJB components in
Figure 2. To simplify the visual representation it uses
IVAPP 2012 - International Conference on Information Visualization Theory and Applications
756
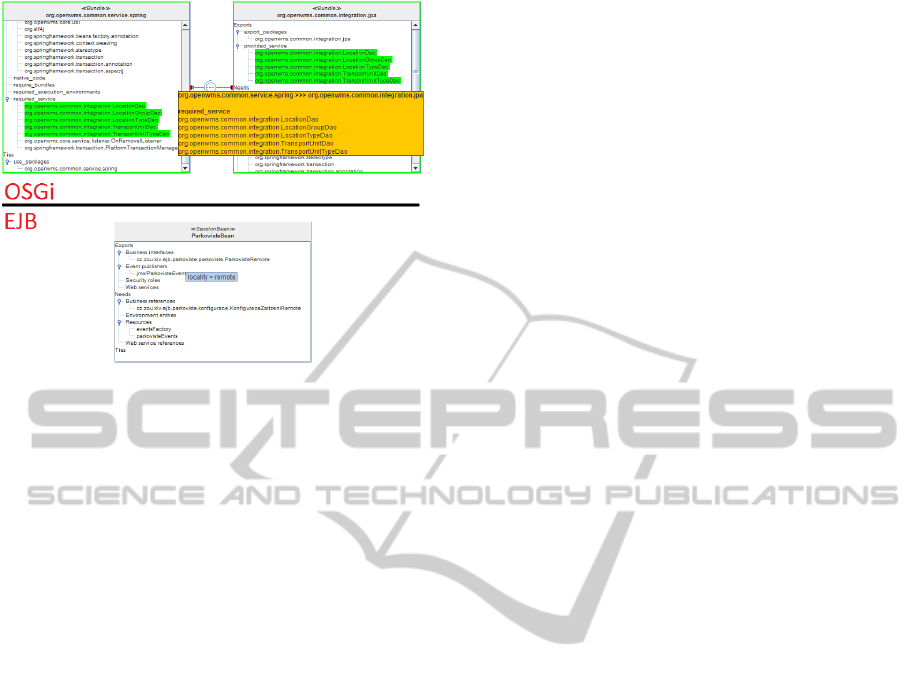
Figure 2: Detailed representation of components in OSGi
(top) and EJB (bottom).
a lot of information hiding and details-on-demand
features. For example, additional information about
component elements is provided as tooltips (Figure
2 EJB) or all relations between two components are
represented as only one line and additional details are
provided on demand (Figure 2 OSGi).
Grouping and Filtering of elements of the com-
ponent is possible thanks to the ENT meta-model,
which has a feature called CategorySet based on
ENT’s faceted classification used on elements. Cat-
egorySet can define several categories as sets of rules
that have to be satisfied in order to include an element
in the given category. Figure 3 shows a CategorySet
editor which is used for designing new sets of con-
ditions. The bodies of components are filtered using
the selected CategorySet. For example, compare the
panel in the bottom-left corner with Figure 2 OSGi
part where a different CategorySet was applied.
Conditional Formatting is yet another powerful
feature possible due the ENT meta-model. AIVA
is able to create conditional formatting based on
the name of component or its elements, but what
is more important, it can work with any other de-
tail about component or its elements hold by the
ENT meta-model like full name, version, required
environment, etc. For example: In OSGi all event
handling must go through provided service called
org.osgi.service.event.EventHandler, events
are then routed by setting the event topic inside the
service filter. AIVA can take in count the value of
this filter and visually highlight only those elements
or whole components that listen on certain topic.
Navigation/Explore interactive techniques are
represented by scrolling, zooming, panning, outline
view and quick search (move the view on component
in diagram, when selected in project overview). These
techniques should provide quick navigation through
the diagram for either looking up some component or
plain browsing of relations. The zoom function has
a special meaning in AIVA, because it does not pro-
vide the simple zoom in and out but also hides all de-
tails about the component itself, to provide cleaner
overview of the whole structure. These details are
shown again when one zooms in on 100%.
Selecting is more important in AIVA, because it
helps reveal and eye track more information. By se-
lecting a component, element or connection line one
can get more information about it. Selection stays ac-
tive even after reconfiguration (e.g layout changes).
Selected connection line also highlights connected
components even in diagram outline, so it is easier
to find them and their related components.
Reconfiguration, change of representation of
components, connection lines or layout of a diagram
is useful when a different point of view on a complex
software sytem is needed. AIVA supports several lay-
outs which can be switched on the fly – a standard fea-
ture displayed on the right side of Figure 3. However
it is also able to change the representation of the com-
ponents – while someone might find useful our pre-
sented tree representation of elements, others might
prefer classic UML representation. AIVA offers three
completely different representations of components
right now.
What is even more important, AIVA is able to
change the proposed collapsed representation of con-
nection lines to a more service-oriented representa-
tion, known from the UML – component has a lol-
lipop symbol attached to the outer edge, representing
one provided element (interface, package or anything
else, the representation is still the same) and other
components connect directly to it. In contrast with
UML, AIVA is able to track and highlight all the con-
nection lines and connected components, by clicking
on the lollipop symbol. This provides an immediate
overview of connected components and the location
where to find them in the diagram.
3.1 Summary
These techniques, features and described visual nota-
tion are not novel by their own. The innovative aspect
is their combined use, to bring quite new experience
to the analysis of the structure of component-based
applications.
AIVA is implemented as ComAV’s visualization
plug-in and JgraphX is used for diagram rendering
which is highly customizable and extendable library.
COMAV - A COMPONENT APPLICATION VISUALIZATION TOOL - Use of Reverse Engineering and Interactivity in
Visualization for Component Software Comprehension
757
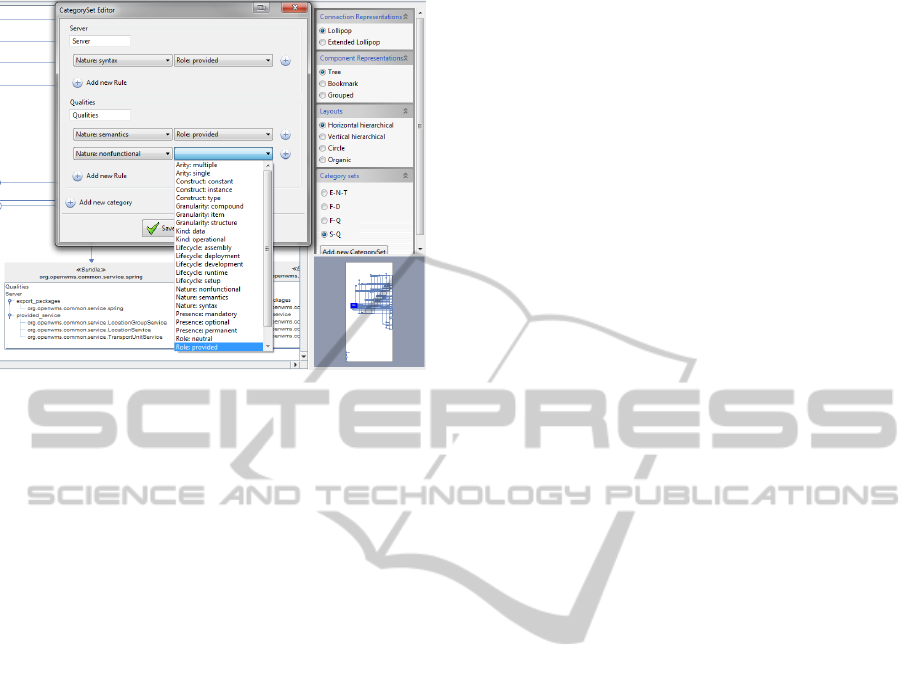
Figure 3: CategorySet editor with different distribution of
elements on background.
4 CONCLUSIONS
We see the main contribution of our work in providing
a novel visualization approach for component-based
software that is supported by an extendable reverse-
engineering mechanism. It is directed mainly at soft-
ware architects and developers.
Its implementation called ComAV is a universal
platform that can be used for visualization of any
component-based application and thanks to its use of
the ENT meta-model, the variety of visualization ap-
proaches can reach from simple diagramming to deep
analytic visualization, similar to (Wettel and Lanza,
2007) or (Telea and Voinea, 2004). ComAV thus of-
fers rich experience from absolutely different visual-
ization approaches applied over the same data.
The AIVA module then aims to offer quality visu-
alization of complex application structures. Its contri-
bution is in combining proven visual notation with in-
teractive techniques to accelerate the process of com-
prehension and to facilitate orientation in complex di-
agrams.
Both ComAV and AIVA are still under develop-
ment, thus neither of them is thoroughly evaluated.
They have however been successfully used to display
models of applications composed from about 60 com-
ponent. Scientific evaluation of the whole approach
will be provided as we will continue in our research.
ACKNOWLEDGEMENTS
The work was supported by the UWB grant SGS-
2010-028 Advanced Computer and Information Sys-
tems.
REFERENCES
Becker, S., Hauck, M., Trifu, M., Krogmann, K., and
Kofron, J. (2010). Reverse Engineering Component
Models for Quality Predictions. In Proceedings of the
14th European Conference on Software Maintenance
and Reengineering, European Projects Track, pages
199–202. IEEE.
Becker, S., Koziolek, H., and Reussner, R. (2009). The pal-
ladio component model for model-driven performance
prediction. Journal of Systems and Software, 82(1):3
– 22. Special Issue: Software Performance - Modeling
and Analysis.
Hansson, H., Akerholm, M., Crnkovic, I., and Tarngren, M.
(2004). SaveCCM - A Component Model for Safety-
Critical Real-Time Systems. In EUROMICRO, pages
627–635. IEEE Computer Society.
Holt, R. (2002). Software Architecture as a Shared Mental
Model.
Meyer, J., Thomas, J., Diehl, S., Fisher, B., and Keim, D. A.
(2010). From Visualization to Visually Enabled Rea-
soning. In Hagen, H., editor, Scientific Visualization:
Advanced Concepts, volume 1 of Dagstuhl Follow-
Ups, pages 227–245. Schloss Dagstuhl–Leibniz-
Zentrum fuer Informatik, Dagstuhl, Germany.
Sentilles, S., Pettersson, A., Nystrom, D., Nolte, T., Petters-
son, P., and Crnkovic, I. (2009). Save-ide - a tool for
design, analysis and implementation of component-
based embedded systems. In Proceedings of the 31st
International Conference on Software Engineering,
ICSE ’09, pages 607–610, Washington, DC, USA.
IEEE Computer Society.
Snajberk, J. and Brada, P. (2011a). ENT: A Generic Meta-
Model for the Description of Component-Based Ap-
plications. Electronic Notes in Theoretical Computer
Science, 279(2):59 – 73. Proceedings of the 8th
International Workshop on Formal Engineering ap-
proaches to Software Components and Architectures
(FESCA).
Snajberk, J. and Brada, P. (2011b). Interactive Component
Visualization. In Proceedings of International Confer-
ence on Evaluation of Novel Approaches to Software
Engineering, pages 218–225. SciTePress.
Telea, A. and Voinea, L. (2004). A Framework for Inter-
active Visualization of Component-Based Software.
In Proceedings of the 30th EUROMICRO Conference,
pages 567–574, Washington, DC, USA. IEEE Com-
puter Society.
Wettel, R. and Lanza, M. (2007). Visualizing software sys-
tems as cities. In In Proc. of the 4th IEEE Interna-
tional Workshop on Visualizing Software for Under-
standing and Analysis, pages 92–99. Society Press.
IVAPP 2012 - International Conference on Information Visualization Theory and Applications
758
