
AUGMENTED REALITY WITH AUTOSTEREOSCOPIC
VISUALIZATION
A Comparative Study using an Autostereoscopic Display versus a Common Display
Juan-J. Arino
1
, M.-Carmen Juan
1
, Santiago González-Gancedo
1
, Ignacio Seguí
2
and Roberto Vivó
1
1
Instituto Universitario de Automática e Informática Industrial (ai2), Universitat Politècnica de València,
C/ Camino de Vera, s/n Valencia, Spain
2
AIJU, Ibi, Alicante, Spain
Keywords: Augmented Reality, Autostereoscopy.
Abstract: In this paper, we present a system that combines Augmented Reality and autostereoscopic visualization. We
also report a study for comparing different aspects using an autostereoscopic display and a common display,
in which 44 children aged from 8 to 10 years old have participated. From our study, statistically significant
differences were found between both displays for the depth perception and for the sense of presence.
Several correlations have also been found when children used the autostereoscopic display. In our study, the
sense of presence is closely related with the depth perception; and the overall score of the game was also
closely related with the depth perception and the sense of presence.
1 INTRODUCTION
Augmented Reality (AR) refers to the introduction
of virtual content into the real world, that is, the user
is seeing an image composed of a real image and
virtual elements superimposed over it. The term
stereopsis was coined by Wheatstone in 1838
(Wheatstone, 1838). From this date onwards, a
stereoscopic system is one that shows a different
image in each eye. In his work about the binocular
vision, he built a stereoscope and presented the first
stereoscopic drawings. Autostereoscopic displays
provide stereo perception without users having to
wear special glasses. Nowadays, all autostereoscopic
displays are multiview. They work with several
images (usually from 5 to 9) that are visible from
different angles. Therefore, the 3D view can be
observed from different positions. In this work, we
experimented how the augmented image may seem
more real for end users by combining AR and
autostereoscopy. Several studies have compared the
use of autostereoscopic displays with other kind of
3D displays, such as 3D glasses or polarized
stereoscopic projection. However, to our knowledge,
this is the first work that combines autoestereoscopic
displays with AR, and compare its benefits with
common displays.
Nowadays, the images shown in autostereoscopic
displays tend to have less quality because of the
optic needed to create the 3D effect. In this work, we
have tried to determine if users prefer the 3D effect
versus quality for interacting with a virtual object.
2 BACKGROUND
A 3D display is a video display capable of
transmitting a three-dimensional image to the
viewer. Many solutions have been proposed to
achieve it. There are several 3D display systems
(Holliman, 2006), including volumetric,
holographic, stereoscopic and autostereoscopic 3D
displays.
Autostereoscopic displays are very attractive, as
they do not require any eyewear. According to Urey
(2011), there are many possibilities, including: two-
view (parallax barrier or a lenticular screen),
multiview, head tracked (with active optics), and
super multiview, which potentially can solve the
accommodation-convergence mismatch problem.
Previous studies for Virtual Reality visualization
techniques focused on comparing common desktop
monitors, Head Mounted Displays and optical see-
through displays. Sousa-Santos et al. (2008) found
that Head Mounted Displays provide an intuitive and
natural interaction with the virtual objects. However,
419
Arino J., Juan M., González-Gancedo S., Seguí I. and Vivó R..
AUGMENTED REALITY WITH AUTOSTEREOSCOPIC VISUALIZATION - A Comparative Study using an Autostereoscopic Display versus a Common
Display.
DOI: 10.5220/0003828204190425
In Proceedings of the International Conference on Computer Graphics Theory and Applications (GRAPP-2012), pages 419-425
ISBN: 978-989-8565-02-0
Copyright
c
2012 SCITEPRESS (Science and Technology Publications, Lda.)
in their tests, they found that the tasks were
performed more efficiently with common desktop
monitors. Froner et al. (2008) compared depth
perception on several 3D displays. They concluded
that the selection of 3D display has to be done
carefully for tasks that rely on human depth
judgment.
On the other hand, several studies have been
carried out to evaluate the use of autostereoscopic
displays to interact with 3D objects. Alpaslan et al.
(2006) compared 2D CRT, shutter glasses and
autostereoscopic displays measuring user preference.
Their results indicated that glasses were preferred to
autostereoscopic displays in a task that involved
only stereoscopic depth. Jin et al. (2007) evaluated
the usability of an autostereoscopic display in a
Virtual Reality scenario. One of the conclusions of
their study was that it was difficult to interact with
an autostereoscopic display with common devices
such as the mouse.
The use of autostereoscopic displays for
educational Virtual Reality applications have
recently been evaluated (Petrov, 2010). Petrov found
that with this kind of applications, the students could
perceive the objects being studied in a more natural
way than using a stereoscopic Head Mounted
Display.
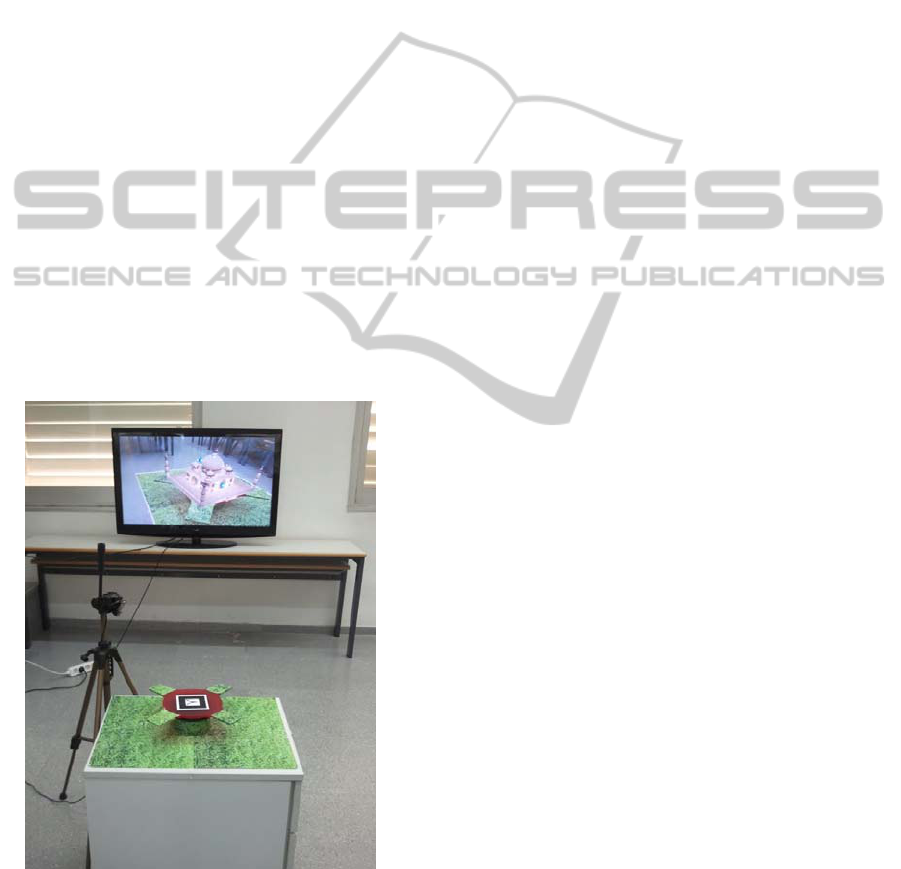
Figure 1: Table with the marker on the rotator support,
camera and autostereoscopic display.
Nowadays, autostereoscopic displays are being
greatly improved. One of the problems preventing
widespread use is that the optical grid needed to
generate the 3D view reduces the quality of the
image when it is used for 2D. However, several
solutions have been proposed to fix this problem
(Montgomery et al. 2001).
3 TECHNICAL
CHARACTERISTICS
As most AR systems, our AR system is based on
markers. A marker is a white square with a black
border inside that contains symbols or letters. The
system detects the marker and registers the virtual
object on it, scaling and orientating it correctly.
To better integrate the marker with the scene and
to make the manipulation of the marker easier, we
created a rotating support where the marker is
placed. The support and the table were decorated
according to the scene that was going to be shown
on top of the marker (Figure 1).
3.1 Hardware
A Logitech camera was used to capture the real
world scene, model C905, with the following
configuration: captured image size - 800 x600 at 30
fps; focal length - 3.7 mm., and automatic focus
adjustment.
An autostereoscopic XYZ display was used for
the visualization. The model used was
XYZ3D8V46, with a resolution of 1920x1080 pixels
(Full HD) and a size of 46”. This model could
generate 8 views. The technology used by this
screen to generate the views is known as
LCD/lenticular (Omura, 1998). The maximum pop-
out 3D effect was around 90 cm. and the range
where the 3D effect was correctly viewed was from
1.5 m. to 9 m.
3.2 Software
The osgART library was used to develop the game.
OsgART was developed by HITLab NZ
(www.artoolworks.com/community/osgart). It is a
C++ library that allowed us to build AR applications
using the rendering capabilities of Open Scene
Graph (OSG) and the tracking and registration
algorithms of ARToolKit. OSG is a set of open
source libraries that primarily provided scene
management and graphics rendering optimization
functionality to applications. ARToolKit is an open
source vision tracking library. We used OSG version
2.8 and osgART version 2.0. We used the Mirage
SDK (www.mirage-tech.com) for the
GRAPP 2012 - International Conference on Computer Graphics Theory and Applications
420
autostereoscopic visualization. This SDK calculated
an autostereoscopic view for the OSG scenes.
To generate the scene for the autostereoscopic
display, it was required to generate 8 different
views. To accomplish this goal, we added a new
layer to osgART, integrating the Mirage SDK with
osgART. An OSG scene is defined by a graph
composed by a hierarchy of nodes. The nodes can be
cameras, scenes, groups of models, transformation
matrix, etc. In our case, we created a graph to
integrate the real video with the virtual objects using
the transformation matrix provided by the marker
detection library (osgART), and the transformations
required to create the autostereoscopic image with
the use of a shader. We used the transformation
matrix calculated by osgART to place and scale the
virtual objects on the real scene. The scene models,
scene light and scene transformations depended on
the osgART AR transform. Therefore, all the virtual
objects composing the scene were translated and
scaled according to the marker. But, instead of using
osgART for rendering the scene, we built an OSG
graph where the scene was rendered for 8 virtual
cameras, and mixed into a 3D autostereoscopic view
with the help of the Mirage SDK.
The captured video was rendered as a
background video at the furthest position. Therefore,
the video had no 3D effect. This background is the
same for the 8 views. On top of the video and at the
marker position, the system rendered the virtual
object. Eight different views from 8 different virtual
cameras were calculated to achieve the 3D effect for
the virtual object. The virtual cameras were located
around the real camera position. Finally, the 8 views
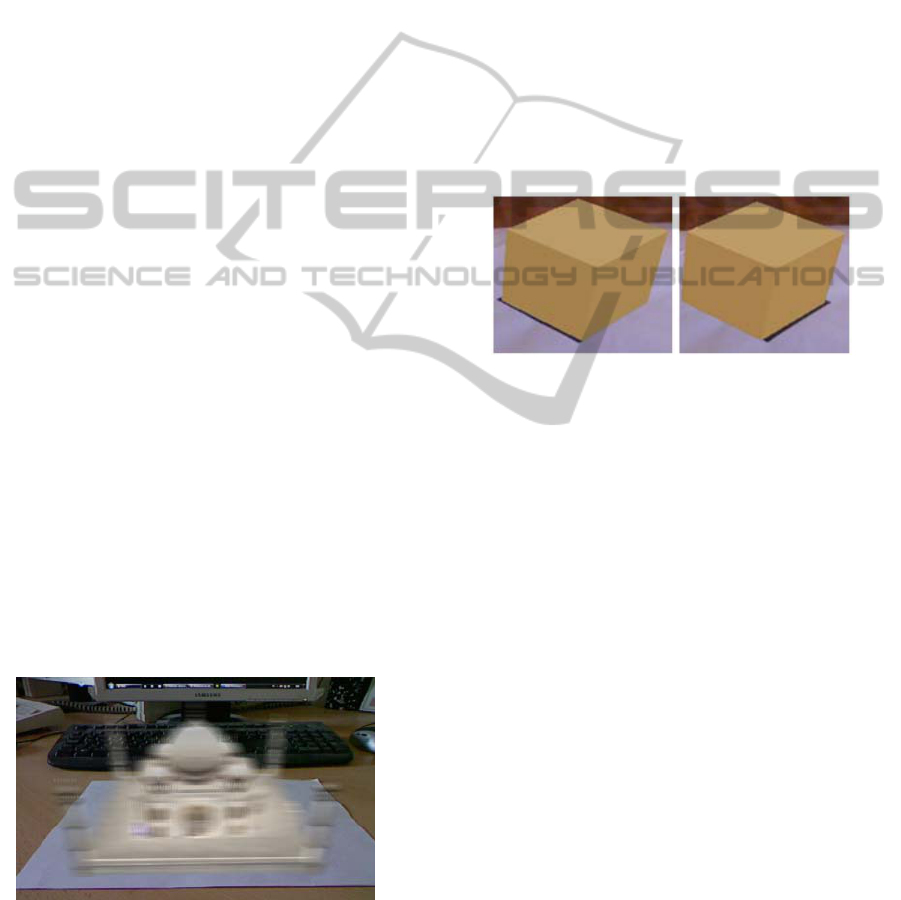
were mixed into one interlaced image. Figure 2
depicts an example in which the Taj Mahal was
shown on a common monitor. The 8 views of the Taj
Mahal were interlaced and it was not possible to see
it properly.
Figure 2: Visualization of a stereoscopic scene on a
common display.
With this technique, we got the effect of having
the virtual object floating “outside the TV” in front
of the viewer and at the marker position while the
captured video stream was displayed at the
background without 3D effect. As a consequence of
this technique and the characteristics of the
autostereoscopic display, if the user moved her head
slightly from left to right, or closed alternatively one
of her eyes, she could see how the virtual object
changed its position over the background video.
Figure 3 shows two of the eight views of a
virtual cube on the marker. The object was slightly
displaced on the marker from one view to another.
One drawback of this type of displays is that the
quality of the image is not as good as in 2D view.
We had to adjust the fusion distance parameter to
define how much the virtual object popped out of the
display. We tried to adjust the fusion distance
parameter to get a good and noticeable 3D effect,
but without too much loss of quality.
Figure 3: Details of two of the eight autostereoscopic
views.
4 STUDY
The aim of the study is to test if the use of
autostereoscopic displays in an AR application
improves the perception of reality and usability. For
this purpose, the same application was tested with
and without autostereoscopic view by two groups of
children. The AR application was a simple game
where a scene was displayed over a marker. The
children had to move the marker to find specific
objects within the scene. We chose a model of the
Taj Mahal in which we added some objects that had
to be found. The counting objects were placed so
that the user had to rotate the base in which the
marker was placed to have a complete view of the
scene.
4.1 Participants
A total of 44 children from 8 to 10 years old took
part in the study. They were attending the Summer
School of the Technical University of Valencia
(UPV).
AUGMENTED REALITY WITH AUTOSTEREOSCOPIC VISUALIZATION - A Comparative Study using an
Autostereoscopic Display versus a Common Display
421

4.2 Procedure
Participants entered in the activity room one by one
to avoid that a child's opinion could affect others.
Participants were divided in two groups of twenty-
two children depending on what they played first,
the AR application having the 3D view enabled, or
with the 3D view disabled.
Table 1: Initial questionnaire.
Q1
Did you have fun?
Q2
Did you like to see the Taj Mahal appearing on
the black square?
Q3
Did you find the game easy to play?
Q4
Would you like to use the rotatory control in
more games?
Q5
Would you like to use this TV in more games?
Q6
Rate from 1 to 7 the feeling of viewing the Taj
Mahal out of the screen.
Q7
Did you have the feeling of being able to touch
the Taj Mahal?
Q8
Evaluate the feeling of being in front of the Taj
Mahal.
Q9
Please rate the game from 1 to 10, where 10 is
the highest score.
Table 2: Second questionnaire.
Q1
Did you have fun?
Q2
Did you find the game easy to play?
Q3
Rate from 1 to 7 the feeling of viewing the Taj
Mahal out of the screen.
Q4
Did you have the feeling of being able to touch
the Taj Mahal?
Q5
Evaluate the feeling of being in front of the Taj
Mahal.
Q6
Please rate the game from 1 to 10.
Q7
Which game did you like the most? The options
were the game with the 3D view and the game
without the 3D view.
Q8
Why? Participant had to explain the reason for
choosing one game over the other.
Q9
What did you like the most of all the
experience? The goal of this question was to
know the overall impression.
The protocol is implemented as follows:
1) The participant came into the room where the
study took place. We started the application
with 3D or 2D view depending on the group,
and we let the child play for some seconds to
get used to the controller and to get a correct 3D
view angle (in case of 3D).
2) We let her know what she had to find and that
she had to count several objects in the scene.
After that, the time started to count.
3) If the answer given by the child was not correct,
she had to look for the objects and count again
until she was right.
4) The time used to complete the task was
recorded. After finishing the task, if the child
was interested, the person in charge let her to
play more.
5) The participant was asked to fill out a
questionnaire. The questionnaire had nine
questions (Table 1). Q1-Q5 used a 5-point likert
scale. Q6-Q8 used a 7-point scale. Q9 ranged
from 1 to 10. Highest score represented the
highest value.
6) The test was repeated, but, now switching 3D
on, if it was off before, or vice versa.
7) The participant was asked to fill out another
questionnaire for the second test (Table 2). This
test had nine questions. Questions from one to
six were questions that were already presented
in the previous test. Questions seven to nine
were new questions to get overall impression.
5 RESULTS
Table 3 shows the means and standard deviations
when comparing the results for the first test of the
participants that played first 3D or 2D game. All the
participants were considered. We performed all t-
tests assuming equality variances. The significance
level was set to 0.05 in all tests. From Table 3, with
regard to the experienced fun (Q1), no statistically
significant differences were found. However, the
mean score was higher for the use of 3D. In both
cases they liked to see the virtual object on the
marker (Q2) with very similar scores. For the
difficulty (Q3), it was as easy to play with 3D as
without 3D. Therefore, it seemed that the complexity
of the game was not increased with the 3D
autostereoscopic view. Q4 is related to the game
controller used to make easier to move the marker,
the participants seemed to like that kind of
controller, and there were no statistically significant
differences when it was used in 3D or 2D. Since it
was a big display, participants were enthusiast and
declared that they wanted to use that display with
more games similarly in both 3D and 2D (Q5).
However, the score was higher for the participants
that played with the 3D view enabled. When we
asked about the feeling of having the virtual object
out of the screen (Q6), there were statistically
significant differences between 2D and 3D view.
GRAPP 2012 - International Conference on Computer Graphics Theory and Applications
422

Table 3: Means and standard deviations for independent groups that played first 3D or 2D game, and t-tests assuming equal
variances.
Q1 Q2 Q3 Q4 Q5 Q6 Q7 Q8 Q9
3D
4.82 ±
0.15
4.72 ± 0.30 4.5 ± 0.54 4.63 ± 0.33 4.81 ± 0.15 6.36 ± 0.71 5.3 ± 4.32
5.76 ±
1.99
9.27 ±
0.96
2D
4.45 ±
0.64
4.81 ± 0.15 4.59 ± 0.53 4.63 ± 0.62 4.54 ± 0.35 4.72 ± 4.39 3.5 ± 3.94 5 ± 3.1
8.95 ±
1.66
t 1.91 -0.63 -0.40 0 1.79 3.39* 2.79* 1.54 0.91
p 0.062 0.53 0.684 1 0.08 0.001* 0.008* 0.129 0.36
* Significant differences.
This indicated that participants did not have any
problems to see the autostereoscopic image.
Regarding to the feeling of being able to touch the
virtual object (Q7), again, there was a statistically
significant difference. Users had a better sense of
realism with the 3D autostereoscopic view. In both
cases participants had the feeling of being in front of
the virtual object (Q8). Although the mean is higher
for the 3D view, the difference is not statistically
significant. Users rated higher the 3D game (Q9).
However, there was not a statistically significant
difference, probably because participants also liked
very much the 2D game and both scores were
around 9 out of 10.
For the time that the participants used to
complete the game, there have not been significant
differences between 2D and 3D with a mean of 41
seconds in 3D mode and 43 seconds in 2D mode.
We also calculated the means and standard
deviations according to the order of exposure for
participants that played with the 3D view enabled
first, and later played without the 3D enabled. Paired
t-tests were applied to the scores given to all of the
questions. Participants that played first with the 3D
game enabled, rated much lower the 2D game than
participants that played in first instance the 2D
game. It seemed that after playing the 3D version,
they were more critical with the 2D integration of
the virtual object with the real world. They found
easier to play with the 2D game (Q3/Q2, 4.81 ± 0.15
versus 4.5 ± 0.54), but since that was the second
time they played, it was expected. Therefore, it was
not possible to determine if this was due to the use
of the autostereoscopic view. Again, as expected,
they rated very high the feeling of viewing the
virtual object out of the display with the 3D view
enabled (Q6/Q3, 6.36 ± 0.71). There were
statistically significant differences for the questions
Q7/Q4 and Q8/Q5, according to the scores, they had
stronger feeling of being in front of the virtual object
and being able to touch it with the 3D
autostereoscopic view. There was also a statistically
significant difference about the rate they gave to the
game. In both cases the score was good, but it was
better 3D (9.27 ± 0.96 versus 8.68 ± 1.6).
We also analysed the results according to the
order of exposure: participants that played with the
2D view first and later played with the 3D enabled.
Paired t-tests were applied to the scores given to all
of the questions. From the results in which
participants played with the 2D view enabled first,
we could conclude that regardless the order of the
tests, the results were very similar. There were also
statistically significant differences for the questions
about the depth perception (Q6/Q3), sense of
presence (Q7/Q4) and overall impression (Q9/Q4).
For the sense of presence the questions were based
on the Slater et al. questionnaire (Slater et al., 1994).
For the question which game did you like the
most?, 84% declared their preference for the
autostereoscopic version. The main reasons were
that it seemed that you could touch the virtual object
(52); it was like having the virtual object very close
to you (27%); it was more real (21%). For the
participants that liked the 2D game more, the main
reasons were concerning to the quality of the image.
For the question, what do you like the most of all
the experience?, 33% of the participants gave
responses related to the 3D experience, 32% liked
the way of interacting with the virtual object, 30%
liked the game, and 5% gave other answers.
The correlation analysis for the responses given
by the participants that played the 3D game first
reported some interesting results. We found several
correlations between the questions. The results
indicated that viewing the object out of the screen
increased the feeling of being in front of the virtual
object and being able to touch it. We also found that
having the feeling of being able to touch the object
contributed to consider the game easier to play. The
global score is conditioned by the feeling of being in
front of the virtual object and to view it out of the
screen. We can conclude that the sense of presence
is closely related with the 3D autostereoscopic view.
We found very different correlations for the
answers given by the participants that played the 2D
AUGMENTED REALITY WITH AUTOSTEREOSCOPIC VISUALIZATION - A Comparative Study using an
Autostereoscopic Display versus a Common Display
423

game first. In this case, the global score for the game
depended on the experienced fun and if participants
liked to see the virtual object on the marker.
During the test, we found some curious behavior
of the participants when playing with the 3D
version. Some of them tried to touch the 3D object
extending their hand or moving it over the marker,
others walked around trying to watch the scene from
different perspectives.
6 CONCLUSIONS
We have combined AR and autostereoscopic
visualization, with the integration of osgART with
the Mirage SDK. We have also presented a study for
comparing different aspects using an
autostereoscopic display and a common display.
Forty-four children participated in this study. Our
initial goal was to develop the software for
developing an AR application with an
autostereoscopic display and to test it to evaluate if
this technology improved the AR experience. From
the results, we concluded that the participants
preferred the autostereoscopic view to a typical 2D
display view. The objective of our AR application
was to get a good integration between the real world
and the virtual objects. The autostereoscopic display
contributed to this integration. The user manipulated
the real objects touching them, and, although she
could not touch the virtual object, the 3D view
increased the realism and gave the user a perception
of being able to touch it. Several correlations were
found when children used the autostereoscopic
display. For the autostereoscopic visualization, the
sense of presence was closely related with the depth
perception. The overall score was also closely
related with the depth perception and the sense of
presence.
However, future studies should test if with
another type of AR applications the use of AR with
autostereoscopic displays still improves the AR
experience. A possible improvement could be to
display also the video in 3D using several cameras.
Some of the problems found by the participants
on the study were about the quality of the image on
the autostereoscopic display. Improvements on the
quality of autostereoscopic displays would
contribute to improve the AR experience.
Considering the good acceptance of the system
and all the possibilities, we believe that it could be a
good tool for different fields.
ACKNOWLEDGEMENTS
This work was funded by the Spanish APRENDRA
project (TIN2009-14319-C02).
For their contributions, we would like to thank
the following:
• The ALF3D project (TIN2009-14103-03) for
the autostereoscopic display.
• Rafa Gaitán, Severino González, M. José
Vicent, Juan Cano, Javier Irimia, Tamara
Aguilar, Noemí Rando, Juan Fernando Martín
for their help.
• The Summer School of the UPV.
• The children who participated in this study.
• The ETSInf for letting us use its facilities during
the testing phase.
REFERENCES
Alpaslan, Z. Y., Yeh, S., Rizzo III, A. A., Sawchuk, A. A.,
2006. Effects of gender, application, experience, and
constraints on interaction performance using
autostereoscopic displays. In Stereoscopic Displays
and Applications XVII Proceedings of SPIE, Vol.
6055, pp. 116-127.
Froner B., Holliman, N. S, Liversedge, S. P., 2008. A
comparative study of fine depth perception on two-
view 3D displays. In Displays, 29,440-450.
Holliman, N. S., 2006. Three-dimensional display
systems. In Handbook of Optoelectronics, Vol II.
Edited by Dakin JP, Brown RGW. Taylor and Francis.
Jin, Z X., Zhang, Y J., Wang, X., Plocher, T., 2007.
Evaluating the usability of an auto-stereoscopic
display. In Lecture Notes in Computer Science, Vol.
4551/2007, pp. 605-614.
Montgomery, D. J., Woodgate, G. J., Jacobs, A., Harrold,
J., Ezra, D., 2001, Analysis of performance of a flat
panel display system convertible between 2D and
autostereoscopic 3D modes. In Stereoscopic Displays
and Virtual Reality Systems VIII, Proceedings of SPIE,
Vol. 4297, pp. 148-159.
Omura, K., 1998, Lenticular Autostereoscopic Display
System: Multiple Images for Multiple Viewers”. In
Journal of the SID, Vol. 4/6, pp. 313-324.
Slater, M. Usoh, M., Steed, A., 1994. Depth of presence in
virtual environments. Presence: Teleoperators and
Virtual Environments, Vol. 3, pp. 130-144.
Petrov, E G. 2010, Educational Virtual Reality through a
Multiview Autostereoscopic 3D Display. In
Innovations in Computing Sciences and Software
Engineering, pp. 505-508.
Sousa-Santos, B., Dias, P., Pimentel, A., Baggerman, J.
W., Ferreira, C., Silva, S., Madeira, J., 2008. Head
Mounted Display versus desktop for 3D Navigation.
In Virtual Reality: A User Study, Multimedia Tools
GRAPP 2012 - International Conference on Computer Graphics Theory and Applications
424

and Applications, Vol. 41, Number 1, pp. 161-181.
Urey, H., Chellappan, K. V., Erden, E., Surman, P., 2011.
State of the Art in Stereoscopic and Autostereoscopic
Displays. In Proceedings of the IEEE, Vol. 99,
Number 4, pp. 540 – 555.
Wheatstone, C. Contributions to the physiology of vision.
-Part the first. On some remarkable, and hitherto
unobserved, phenomena of binocular vision, 1838.
Philosophical Transactions. Ed. the Royal Society of
London, Vol. 128, pp. 371–394.
AUGMENTED REALITY WITH AUTOSTEREOSCOPIC VISUALIZATION - A Comparative Study using an
Autostereoscopic Display versus a Common Display
425
