
DIFFUSION BEHAVIOR OF IEEE 802.15.4 UNSLOTTED CSMA/CA
IN A CELL OF PROXIMITY-BASED LOCALIZATION
APPLICATIONS
Chakib Baouche, Antonio Freitas and Michel Misson
Clermont Universit´e/Universit´e Blaise Pascal/LIMOS CNRS, Complexe Scientifique des C´ezeaux, 63177 Aubi`ere, France
Keywords:
WSN, IEEE 802.15.4, Unslotted CSMA/CA, Non Beacon-enabled Mode, Throughput.
Abstract:
This paper relates to a generic solution for localization and tracking applications using Wirelesssensor network
in confined areas where the GPS technology is no longer functional. The proposed solution exploits node
mobility by allowing stations to come into contact with other fixed or mobile stations to collect, transmit and
pass around their knowledge, which is a collection of ’contact events’. Each contact event being a way to
record the fact that a node has been in range of an another node. This event can also refer to a geographical
location. The amount of contact events that have been created depends on the effectiveness of the contact
detection mechanism and on the performance of the WSN medium access method. This leads us to study the
performance of IEEE 802.15.4 unslotted CSMA/CA when the offered load of a cell is only broadcast traffic.
Frames are not always received because of collisions or of unsuccessful transmission attempts. This leads
to a rupture of the current contact involving the creation of useless contact events for the same situation of
proximity between entities. The results obtained by simulation, determine the capability of a cell in terms of
number of mobiles and size of the exchanged frames for an acceptable rate of false contact detection.
1 INTRODUCTION
In this paper, WSN (Akyildiz and CanVuran, 2010)
are used for proximity-based localization applica-
tions. Each mobile is equipped with sensors and col-
lects data as it moves. When a mobile enters the cell
of another node, the mobile can upload its data or
download specific information about the area (for in-
stance, a fine-grained map of the area). This commu-
nication is performed while both nodes are in range of
each other. The key issue for such applications is the
contact duration, which includes the delay required
for the mobile to detect that it is in range of the other
mobile, and for the exchanges.
The duration of a contact between two nodes is
often computed by having the nodes sending peri-
odic signaling frames, called beacons in the follow-
ing. Each node can estimate the contact duration as
the time between the first and the last beacon received.
However, to determine which is the last beacon re-
ceived is difficult because beacons can be missed due
to changes in channel propagation conditions or due
to an overload of the traffic at this particular location
and at this particular instant. After having missed sev-
eral beacons in a row, a node would wrongly assume
that the contact is lost, although the node could still
be in range.
Our contributions are three-fold. Firstly, we quan-
tify the maximum number of mobiles such that the
risk of false contact failures is bounded by a given
threshold. Secondly, we show that in order to achieve
the maximum throughputfor diffused frames by using
unslotted CSMA/CA (Lauwens et al., 2010), mobiles
have to produce an offered load greater than the chan-
nel capacity. Thirdly, we propose a graphical way to
estimate the cause of frame losses.
2 PROBLEM DESCRIPTION
2.1 Application Scenarios
This study is carried out in order to localize peo-
ple or hazardous materials moving in a confined area
where the use of GPS (Zheng et al., 2010) system is
no longer possible. The solution we are dealing with
can be summarized as follows. WSN devices can be
spread over a confined area (such as mine galleries for
example) according to their type:
119
Baouche C., Freitas A. and Misson M..
DIFFUSION BEHAVIOR OF IEEE 802.15.4 UNSLOTTED CSMA/CA IN A CELL OF PROXIMITY-BASED LOCALIZATION APPLICATIONS.
DOI: 10.5220/0003838901190122
In Proceedings of the 1st International Conference on Sensor Networks (SENSORNETS-2012), pages 119-122
ISBN: 978-989-8565-01-3
Copyright
c
2012 SCITEPRESS (Science and Technology Publications, Lda.)

• Tag-nodes which are fixed nodes used to point out
particular locations in the gallery and are able to
store information such as a list of mobiles that
have been in such areas.
• Mobile nodes are able to exchange information
with other fixed or mobile nodes. The chronol-
ogy of the contacts with tag-nodes can be used to
deduce the trail of the mobile nodes.
• Collector nodes are usually fixed nodes. When a
mobile node moves in its range, a collector can
download a copy of the gathered information.
This is a similar version of the data mule con-
cept (Bhadauria et al., 2011), where mobile nodes are
mules, tag-nodes are mirrors and the collector node is
a sink or a base station. Our objective is not to provide
a fine-grained localization system but to determine if
an entity is still in range or has been near a given lo-
cation (typically the coverage of a small-sized cell of
a particular tag-node).
2.2 Contact Definition
The three types of nodes broadcast periodically their
identity in order to signal their presence (Baouche
et al., 2009) (Baouche et al., 2011). This allows nodes
to detect that they are close to each other when they
are in range. We say that they are in contact. When
a node detects the fact that there is another node in
range, a data structure, called contact event, contain-
ing the addresses of the two nodes involved in the
contact, a sequence number and the interval during
which both partners are in range. During this interval
of time, nodes can exchange their knowledge (a set of
contact events) to contribute to the passing around of
the information needed by the application.
2.3 Risk of False Contact Estimation
We focus now on the number of false contacts due
to the overload of a cell. Let p be the probability of
missing one frame and N
t
be the number of frames
lost consecutively. If, for example, N
t
equals 3 (three
consecutive frames lost), the probability of false cre-
ation of contact event is p
3
(
1−p
n+1
1−p
) (to take into ac-
count the losses of 4, 5, 6,...,n consecutive frames).
This will be approximated by p
3
in the following.
Let us set the periodicity of beacon diffusion to
100 ms and let us suppose that it takes 100 s for a
mobile to cross the coverage of the cell of a tag-node.
During this time, 1000 frames must be received.
Let us assume now that we tolerate at most one
false contact creation per node while it crosses the
coverage of a cell. This can be approximated by
1000∗ p
3
≤ 1, that is to say p ≤ 10%.
This formula is used in order to define the num-
ber of mobiles that can move simultaneously within a
cell while keeping the false contact risk under a given
threshold.
3 EVALUATION
3.1 Evaluation and Simulation Process
In this section, we study the behavior of CSMA/CA
802.15.4 in a cell progressively loaded by broadcast
traffic with a data rate of 250 Kbps. All the re-
sults given here have been obtained using NS-2 (Is-
sariyakul and Hossain, 2008) simulator. Our ap-
proach is to consider the cell coverage of a given
node: a tag-node for example. From 1 to N
m
(N
m
=
100) mobile nodes are introduced within the cell cov-
erage with a signalling frequency of
1
T
, T ∈ [0, 1]
(T = 100 ms for the results given here). The offered
load in the coverage zone is
N
T
frames and each mo-
bile starts its activity in a time interval of [0, T].
The evaluation of the throughput is based on the
computation of the average traffic received by each
mobile node. This throughput is compared to the of-
fered load within the cell, that is to say: (N
m
+ 1) ∗ 10
frames/s, where N
m
is the number of mobiles.
These simulations have been carried out for dif-
ferent frame sizes: short (4 bytes) corresponding to a
beacon, medium (60 bytes) and long (116 bytes) cor-
responding to beacons used to carry contact events.
We used p = 10% to identify the capacity of a cell.
Our objectiveis to have real contact events rather than
false contact events created by link failures due to the
cell overload.
3.2 Throughput
The study of the throughput was carried out for the
different lengths of frames. The results of the study
are given on Fig. 1 and Fig. 2. Each figure is com-
posed of three curves:
• The average traffic received by a node as a func-
tion of the submitted load to the MAC layer (de-
noted by to the mac). We can observe that the sat-
uration of the medium (145 kbps, 28 mobiles) on
Fig. 1 (long frames) is reached for an offered load
greater than the maximum capacity of the medium
(G = 1 for 250 kbps). This is due to the role of
the MAC layer: a certain number of frames are
dropped at the MAC layer after successive unsuc-
SENSORNETS 2012 - International Conference on Sensor Networks
120
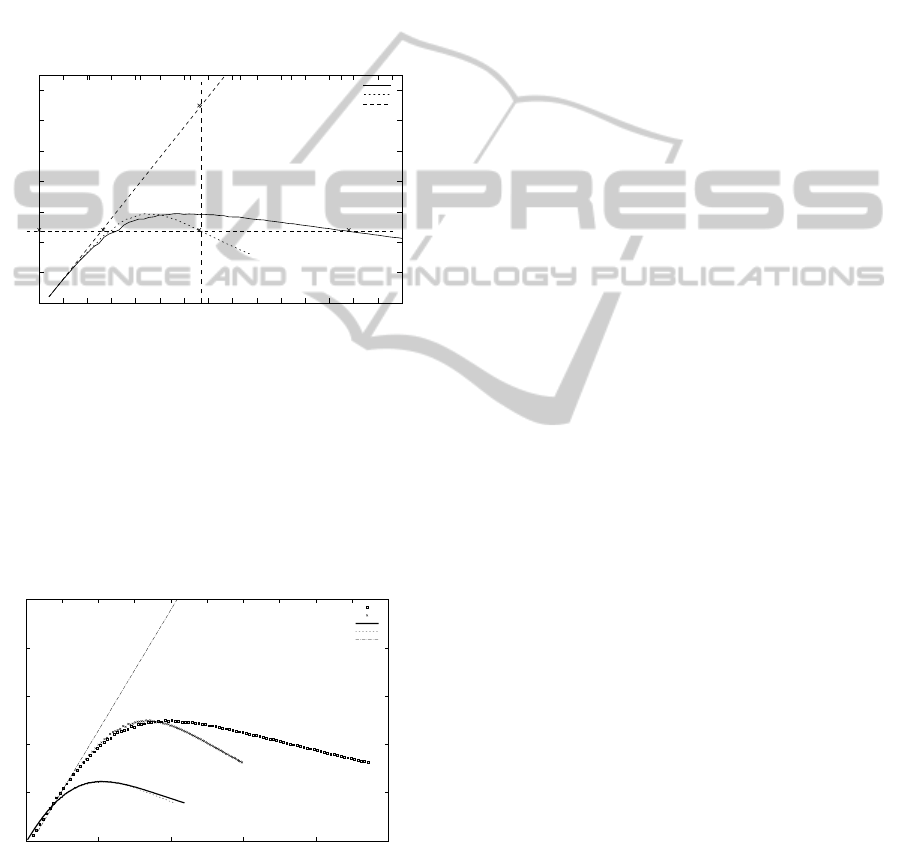
cessful transmission attempts.
• The average traffic received by a node as a func-
tion of the submitted load to the physical layer
(Fig. 1 by the phy). In this case, the saturation of
the medium is obtained by an offered load smaller
than the maximum capacity (G ≈ 0.8).
• The asymptotic line represents the maximum the-
oretical throughput that can be obtained (i.e., S =
G). We use it in the following in order to calculate
the number of collisions on the medium.
B(Xb,Yp)
C(Xb,Xb)
A(Xa,Yp)
Sp(0,Yp)
D(Xd,Yp)
0
0.2
0.4
0.6
0.8
1
1.2
1.4
0 0.2 0.4 0.6 0.8 1 1.2 1.4 1.6 1.8 2 2.2 2.4 2.6 2.8 3
0 10 20 30 40 50 60 70
S : Throughput
G : Offered load
nodes
to the mac
by the phy
best
Figure 1: Long frames.
The same representation for short and medium
frames is illustrated on Fig. 2. We note that the satu-
ration of the medium for the short frames is reached
with a throughput of 62 kbps for 96 mobiles (G =
0.5). The maximal throughput is obtained for the
medium frames with 125 kbps for 42 mobiles (G =
0.9).
0
0.2
0.4
0.6
0.8
1
0 0.5 1 1.5 2 2.5
0 10 20 30 40 50 60 70 80 90 100
S : Throughput
G : Offered load
nodes
to the mac(medium)
by the phy(medium)
to the mac(short)
by the phy(short)
best
Figure 2: Short and medium frames.
3.3 Study of the Cause of Frame Losses
In the following, we deduce from the previous simu-
lations (throughput vs. offered load) the number of
drops at the MAC layer, and the number of collisions
for broadcasted frames.
To do so, let us take again Fig. 1 giving the
throughput (S = F(G)) for long frames. From each
point A of the curve ’to the MAC’, an offered load
X
a
(on the x-axis) and a throughput S
p
(on the y-axis)
can be deduced. This particular throughput will be
used to define three other points as shown in Fig. 1.
Let us denote by (0, Y
p
) the coordinates of this point.
If A(X
a
, Y
p
) is the corresponding point on the curve
called ’to the MAC’, the same throughput is also used
to obtain the offered load X
b
submitted by the physical
layer to the medium. Let B(X
b
, Y
p
) be the correspond-
ing point of the curve called ’to the Phy’. It is also
possible to define points C(X
b
, X
b
) and D(X
d
, X
p
) on
the curve called ’best’, this curve being S = G. Let us
denote that the length of segment BC and segment BD
are the same. These points are used in the following
to evaluate the cause of the frame losses.
3.3.1 Frames Dropped by the MAC Layer
For each point A, it is possible to associate a point B.
The difference of the x-value of these two points gives
the number of dropped frames that have been queued
in the MAC layer.
Let F
1
be a function of G giving the number of
drops: F
1
(X
a
) = X
a
− X
b
. (1)
Figure 3 shows the number of drops on the MAC
layer for the four types of transmissions. We note in
this graph that the shape of the curves depends on the
length of the broadcast frames, so the highest number
of drops of frames is obtained for long-sized frames.
3.3.2 Effect of Collisions
In our simulations, we use the free space model to
model of propagation conditions, and all the mobiles
in our scenarios are in range of each other. We con-
sider that the frames handled and broadcast by the
physical layer are either received or affected by a col-
lision.
Let us take again the points defined previously:
B(X
b
, Y
p
) represents an offered load to the medium
that gives S
p
as throughput. The curve denoted by
’best’ gives us the throughput if all the broadcast
frames are correctly received. The number of colli-
sions is given by the difference between what is sub-
mitted to the medium and what is received (i.e., the
segment [DB]).
F
2
(X
b
) = X
b
− X
d
(2).
Figure 4 represents the number of collisions for
short, medium and long frames. We note that the
number of collisions increases quasi-proportionally
with the number of nodes in the network for the four
DIFFUSION BEHAVIOR OF IEEE 802.15.4 UNSLOTTED CSMA/CA IN A CELL OF PROXIMITY-BASED
LOCALIZATION APPLICATIONS
121

types of transmissions. The effect of dropping mech-
anism can be clearly seen for long frames: only a part
of the frames submitted to the MAC layer is sent.
3.4 Cell Capacity in Terms of Number
of Simultaneous Mobiles
We now focus on the maximum number max
Nb
of mo-
biles; a cell coverage can support before having false
creation of contact events. Our assumption is that we
tolerate at most one false creation during 100 seconds
(p ≤ 10%). To identify the value of max
Nb
for a given
length of frame, we consider the intersection between
the curve giving the throughput and a straight line
ET(x) representing what we are expecting: more than
90% of frames are received.
ET(x) = 0.9 ∗ (Ntx−
t
T
). (3),
where ET stands for expected traffic.
We deduce from this formula the values of 11 mo-
biles for long frames, 15 mobiles for medium frames
and 21 mobiles for short frames.
0
10000
20000
30000
40000
50000
60000
70000
0 10000 20000 30000 40000 50000 60000 70000 80000 90000 100000 110000
Drops [Frames]
Offered load [Frames]
short
medium
long
Figure 3: Number of drops.
0
0.2
0.4
0.6
0.8
1
1.2
0 10000 20000 30000 40000 50000 60000 70000 80000 90000 100000 110000
Collisions
Offered load [Frames]
short
medium
long
Figure 4: Number of collisions.
4 CONCLUSIONS
The particular point which is tackled in this paper is
the estimation of a contact duration, when fixed and
mobile nodes are in range of each other. This time
is used by nodes to exchange information about pre-
vious contacts for example. The risk of successive
frame losses leads us to evaluate the maximum num-
ber of mobiles that can be accepted in the coverage of
a cell in order to avoid a false contact duration estima-
tion. The method we proposed provides also a way to
estimate throughput and the effect of the discard pro-
cess of the MAC layer of IEEE 802.15.4 standard.
REFERENCES
Akyildiz, I. and CanVuran, M. (2010). Wireless Sensor Net-
works. John Wiley and Sons.
Baouche, C., Freitas, A., and Misson, M. (2009). Radio
Proximity Detection in a WSN to Localize Mobile En-
tities within a Confined Area. In JCM : Journal of
Communications, volume 4, pages 232–240.
Baouche, C., Freitas, A., and Misson, M. (2011). Routing
mechanism for a DTN using WSN nodes for localiza-
tion applications. In Proceedings of the IEEE Interna-
tional Conference on Networking, Sensing and Con-
trol, ICNSC 2011, Delft, The Netherlands11-13 April
2011, pages 514–519. IEEE.
Bhadauria, D., Tekdas, O., and Isler, V. (2011). Robotic
Data Mules for Collecting Data over Sparse Sensor
Fields. In Journal of Field Robotics, volume 28, pages
388–404.
Issariyakul, T. and Hossain, E. (2008). Introduction to Net-
work Simulator NS2. Springer Publishing Company,
Incorporated.
Lauwens, B., Scheers, B., and VanDeCapelle, A. (2010).
Performance analysis of unslotted CSMA/CA in wire-
less networks. In Telecommunication Systems, vol-
ume 44, pages 109–123.
Zheng, W., Zheng, Y., and Qiang, Y. (2010). Collaborative
location and activity recommendations with GPS his-
tory data. In Proceedings of the 19th international
conference on World wide web, WWW ’10, pages
1029–1038. ACM.
SENSORNETS 2012 - International Conference on Sensor Networks
122
