
ORIENTATION-BASED SEGMENTATION OF TEXTURED IMAGES
BY ENERGY MINIMIZATION
Maria Sagrebin-Mitzel and Til Aach
Institute of Imaging and Computer Vision, RWTH Aachen University, 52056 Aachen, Germany
Keywords:
Orientation-based Segmentation, Textured Images, Superimposed Oriented Patterns, Orientation Tensor,
Energy Minimization, Graph Cut.
Abstract:
We consider textured images, where the textures are composed of different numbers of additively superim-
posed oriented patterns. Our aim is to develop an energy minimization approach to segment these images
into regions according to the number of patterns superimposed. The number of superimposed patterns can
be inferred by testing orientation tensors for rank deficiency. In particular, the hypothesis that a local image
patch exhibits a given number of superimposed oriented patterns holds if the corresponding orientation tensor
is rank deficient by one. The tests can be carried out based on quantities computed from the eigenvalues of the
orientation tensors, or equivalently from invariants such as determinant, minors and trace. Direct thresholding
of these quantities leads, however, to non-robust segmentation results. We therefore develop energy functions
which consist of a data term evaluating tensor rank, and a smoothness term which assesses smoothness of the
segmentation results. As the orientation tensors and thus the data term depend on the number of orientations
tested for, we derive a hierarchical algorithm for approximate energy minimization using graph cuts. We show
the robustness of the approach using both synthetic and real image data.
1 INTRODUCTION
Various problems in the analysis of digital images re-
quire the analysis of textured image contents, such as
segmentation or classification (Jain and Farrokhnia,
1991; Randen and Husoy, 1999a; Randen and Husoy,
1999b; Liu and Wang, 2003; Lazebnik et al., 2005;
Lategahn et al., 2010). Basically texture classifica-
tion and segmentation deal with the discrimination of
regions which contain textures which are distinct ac-
cording to some criterion, while each region corre-
sponds to a homogeneous texture.
We consider here textures, which are composed
of different numbers of additively superimposed ori-
ented patterns. Such textures occur,forinstance, in X-
ray images of car tires, which contain different num-
bers of metal gratings superimposing each other (Fig.
1). Our goal is to segment these images into regions
according to the number of superimposed patterns.
The analysis of orientations is often based on orien-
tation tensors computed from image gradients, such
as in (Big¨un and Granlund, 1987; Kass and Witkin,
1987; Zenzo, 1986) for single oriented patterns, and
in (Aach et al., 2006; M¨uhlich and Aach, 2009) for
multiple orientations. The number of oriented patter-
ns superimposed across a local image patch can then
be determined by the rank of these tensors, specifi-
cally by testing orientation tensors for rank deficiency.
In particular, the assumption that a local image patch
exhibits a given number of oriented patterns holds if
the corresponding orientation tensor is rank-deficient
by one. The tests can thus be performed based on
criteria computed from the eigenvalues of the orien-
tations tensors, or from other invariants such as de-
terminants, minors and trace. One approach, taken
in (Aach et al., 2006; M¨uhlich and Aach, 2009) is to
sequentially test for one, two and more orientations
by hierarchical thresholding of these criteria. Such
purely data-driven thresholding, however, is prone to
generate isolated decision errors, in particular in more
noisy image data. To achieve robust segmentation re-
sults, we follow here the approach of deriving energy
functions consisting of a data term evaluating ten-
sor rank, and a smoothness term which assesses the
smoothness of the image regions. Similarly as above
for the thresholding approach, the data term depends
on the number of orientations tested for. We therefore
develop here a hierarchical algorithm to minimize the
energy using graph cuts (Boykov et al., 2001).
In the following, we first review the tensor-based
249
Sagrebin-Mitzel M. and Aach T..
ORIENTATION-BASED SEGMENTATION OF TEXTURED IMAGES BY ENERGY MINIMIZATION.
DOI: 10.5220/0003839602490258
In Proceedings of the International Conference on Computer Vision Theory and Applications (VISAPP-2012), pages 249-258
ISBN: 978-989-8565-03-7
Copyright
c
2012 SCITEPRESS (Science and Technology Publications, Lda.)

analysis of single and multiple orientations. We then
illustrate the hierarchical structure of our general ap-
proach. This is followed by a derivation of the data
energy terms. On each level of the hierarchy, the cor-
responding data term is complemented by a smooth-
ness term, specifically the Potts model, to assess re-
gion smoothness. The total energy is then approxi-
mately minimized by a graph cut algorithm. We eval-
uate the algorithm qualitatively and quantitatively us-
ing both synthetically generated and real image data.
2 ANALYSIS OF SINGLE AND
MULTIPLE ORIENTATIONS
Since orientation estimation plays an important role
in wide areas like texture analysis, adaptive filtering
and image enhancement, a number of different ap-
proaches have been proposed. These include among
others quadrature filter based methods (Knutsson and
Granlund, 1983; Granlund and Knutsson, 1995; Aach
et al., 1995), the structure tensor (F¨orstner, 1986;
Zenzo, 1986; Big¨un and Granlund, 1987; Kass and
Witkin, 1987; Big¨un et al., 1991) and its extensions to
orientation tensors for multi-oriented patterns (Aach
et al., 2006; M¨uhlich and Aach, 2009), the energy
tensor (Felsberg and Granlund, 2004) or the bound-
ary tensor (K¨othe, 2003). Yet another alternative, par-
ticularly for orientation-adaptive filtering and feature
detection by matched filtering, are single-steerable
(Freeman and Adelson, 1991; Jacob and Unser, 2004)
and multi-steerable filters (M¨uhlich et al., 2012).
In the following, we summarize the orientation-
tensor based approach to orientation analysis, and a
hierarchical, purely data-driven procedure for esti-
mating the number of superimposed oriented patterns.
2.1 Single Orientation
The bivariate gray-level image f (x) is said to be ori-
ented in a local region Ω if and only if
f (x) = f (x+ kv) ∀k ∈ ℜ and ∀x,x+ kv ∈ Ω (1)
where the case of f (x) being constant over Ω is ex-
cluded. The unit vector v = (cosθ,sinθ)
T
= v(θ) de-
scribes the orientation of f (x) in terms of the angle
θ.
Eq. 1 states that a given image is locally con-
stant with respect to v if its directional derivative
∂f
∂v
= h∇f,vi, i.e., the scalar product between the im-
age gradient ∇ f and v, is zero for all gradients com-
puted in the neighborhood Ω.
Because of noise in real image data and to allow for
slight model violations, one seeks to find the solution
of the following equation
θ = arg min
−π/2<φ≤π/2
Z
Ω
v
T
(θ)∇f (x)
2
dΩ (2)
which leads to the so-called structure tensor approach
for orientation estimation found in the pioneering
work of (Big¨un and Granlund, 1987), (Zenzo, 1986),
(Kass and Witkin, 1987) and others.
Using the image gradient ∇ f = ( f
x
, f
y
)
T
, we de-
fine the structure tensor T
(1)
: ℜ
N
→ ℜ
N×N
(where
N = 2 for bivariate images) as a local integration over
the outer product of the gradient
T
(1)
=
Z
Ω
(∇f)(∇f)
T
dΩ =
Z
Ω
f
2
x
f
x
f
y
f
x
f
y
f
2
y
dΩ
(3)
If the image signal is perfectly oriented according to
(1) over Ω, the structure tensor T
(1)
has one zero
eigenvalue and rank(T
(1)
) = 1. In the presence of
more than one orientation, both eigenvalues have a
high value and rank(T
(1)
) = 2. Only in the case of
f (x) being perfectly constant over Ω, both eigenval-
ues vanish and rank(T
(1)
) = 0.
2.2 Higher-order Orientations
As shown in (Aach et al., 2006) and (M¨uhlich and
Aach, 2009) the detection of higher-order oriented
structure can be treated in a similar manner. Let the
image f (x) be composed from several single oriented
signals f
i
(x), i ∈ [1,2,...,M] within a local region Ω:
f (x) =
M
∑
i=1
α
i
f
i
(x) ∀x ∈ Ω (4)
where the α
i
denote weighting constants.
For M = 2, the composite image f (x) then satis-
fies:
∂
2
f (x)
∂u∂v
= 0 ∀x ∈ Ω (5)
where the unit vectors u = (cosθ,sinθ)
T
= (u
x
,u
y
)
and v = (cosγ, sinγ)
T
= (v
x
,v
y
) denote the orienta-
tions of f
1
(x) and f
2
(x), respectively. In the same
way, (5) holds if the oriented patterns occur in mutu-
ally exclusive subregions Ω
1
and Ω
2
of Ω at a region
boundary according to
f (x) = f
i
(x) ∀x ∈ Ω
i
(6)
where
S
i
Ω
i
= Ω and
T
i
Ω
i
=
/
0.
Constraint (5) can be rewritten as the inner prod-
uct a
T
g
(2)
(x) = 0 ∀x ∈ Ω, where a is a three-
dimensionalvector encoding the orientations given by
a
T
= (u
x
v
x
,u
x
v
y
+ u
y
v
x
,u
y
v
y
)
= (cosθcosγ,sin(θ+ γ), sinθsinγ)
(7)
VISAPP 2012 - International Conference on Computer Vision Theory and Applications
250

and where g
(2)
can be viewed as a higher-order gradi-
ent given by
g
(2)
= ( f
xx
, f
xy
, f
yy
)
T
(8)
The components of a represent the mixed orientation
parameters, which, if needed, can be decomposed into
the sought orientation angles θ and γ as shown in
(M¨uhlich and Aach, 2009).
Constraint (5) can now be rewritten to
Q(a) =
Z
Ω
a
T
g
(2)
2
dΩ = 0, a
T
a > 0. (9)
Minimizing this expression subject to the constraint
a
T
a > 0 leads again to an eigensystem analysis, this
time of the orientation tensor T
(2)
defined as follows:
T
(2)
=
R
Ω
g
(2)
g
(2)
T
dΩ
=
R
Ω
f
2
xx
f
xx
f
xy
f
xx
f
yy
f
xx
f
xy
f
2
xy
f
xy
f
yy
f
xx
f
yy
f
xy
f
yy
f
2
yy
dΩ
(10)
Confidence in the double orientation hypothesis is
high if one eigenvalue is small and the other two
are large. Moreover, if the image f (x) exhibits two
ideal orientations in Ω, one eigenvalue is zero and
rank(T
(2)
) = 2.
In the case of three orientations, M = 3 and g
(3)
has the form
g
(3)
= ( f
xxx
, f
xxy
, f
xyy
, f
yyy
)
T
(11)
which leads to the 4 × 4 orientation tensor T
(3)
de-
fined as
T
(3)
=
Z
Ω
g
(3)
g
(3)
T
dΩ (12)
Again the presence of three different orientations in
the image region Ω can be tested for by an eigensys-
tem analysis of the above orientation tensor.
2.3 Hierarchical Orientation Estimation
Following the above discussion, the estimation of a
number of superimposed oriented patterns in a sin-
gle image patch can be achieved by testing the rank
of the orientation tensors, which was based above
on an eigensystem analysis. For M ≥ 2, calculat-
ing eigenvectors and eigenvalues of a tensor may re-
quire iterative numerical methods. To avoid this step,
(M¨uhlich and Aach, 2009) derived a hierarchical al-
gorithm where rank testing employs tensor invariants
such as determinant and trace.
The hierarchical testing of the algorithm was
achieved by comparing the ratios
s
M
=
M+1
q
λ
(M)
1
·· · λ
(M)
M+1
M
q
1
M+1
∑
M+1
i=1
λ
(M)
1
·· · λ
M
i−1
λ
(M)
i+1
·· · λ
M
M+1
(13)
against predefined thresholds ε
M
. λ
(M)
i
denotes the i-
th eigenvalue of the orientation tensor T
(M)
. Note that
both numerator and denominator can be computed
without an eigensystem analysis from quantities such
as trace, determinant and minors of the corresponding
tensor T
(M)
. Both the numerator and denominator of
s
M
can be interpreted as mean eigenvalues, with the
numerator being the geometric mean of all eigenval-
ues. The upper bound for s
M
is one, which is reached
when all eigenvalues are equal. The lower bound is
zero, which is obtained when at least one eigenvalue
vanishes.
The procedure for the hierarchical decision mak-
ing is as follows: Starting with M = 1, compute the
orientation tensor T
(M)
and the value of s
M
. If s
M
is smaller than the predefined threshold ε
M
, mark the
region as M-oriented. Otherwise increment M by one
and go to the next decision level by computing T
(M+1)
and the corresponding value s
M+1
.
Applying this procedurewith M
max
= 3 results in a
segmentation of the image into areas with one, two or
three orientations, plus a region with more than three
orientations. Fig. 1 (a) shows a part of a X-ray image
of a tire, revealing its internal metal grating structure.
Fig. 1 (b) shows the corresponding region map ob-
tained for ε
1
= 0.5, ε
2
= 0.6 and ε
3
= 0.7, where the
area in dark gray represents single orientations, the
area in medium gray double orientations and the area
in light gray three orientations.
(a) X-ray image of a tire. (b) Segmentation results.
Figure 1: Segmentation results based on the segmentation
procedure, proposed by (M¨uhlich and Aach, 2009).
While the overall estimated region structure cor-
responds well to the original image, the segmented
regions itself are corrupted by small isolated decision
errors. On these image parts, a different number of su-
perimposed oriented patterns have been assigned than
in the surrounding area.
This behavior is predominantly caused by the fact
that each decision considers only local information
from the data inside the small image patch Ω. This
purely data-driven approach thus ignores region as-
ORIENTATION-BASED SEGMENTATION OF TEXTURED IMAGES BY ENERGY MINIMIZATION
251
signments of neighboring image patches. In other
words, when making a decision at a specified im-
age patch, no context from decisions for neighboring
patches is taken into account (cf. (Besag, 1974; Har-
alick, 1983; Derin and Cole, 1986; Besag, 1986)).
However, in most applications the assumption of
real object being represented through coherent and
continuous regions in an image is valid. To incor-
porate this knowledge into the segmentation proce-
dure, we develop in the following an algorithm which
additionally to the data term also uses a regulariza-
tion term. This additional regularization term im-
poses further constraints concerning the sought seg-
mentation. It favors segmentation results with coher-
ent larger regions with smooth boundaries rather than
small, ragged regions.
The newly developed segmentation algorithm
consists of a hierarchy of energy functions, each con-
taining a data and a smoothness term. The definitions
of the data terms are based on the ratios defined in
(13). The smoothness term is the same in each func-
tion.
The hierarchical structure of the proposed ap-
proach is described in the next section.
3 APPROACH OVERVIEW
The hierarchical principle of the proposed approach
is motivated by the structure of the orientation esti-
mation algorithm discussed in the previous section.
On the first level of the hierarchy the image is seg-
mented into two regions corresponding to single and
higher order oriented image parts. Further segmen-
tation steps for the second and higher levels of the
hierarchy consider only image regions which did not
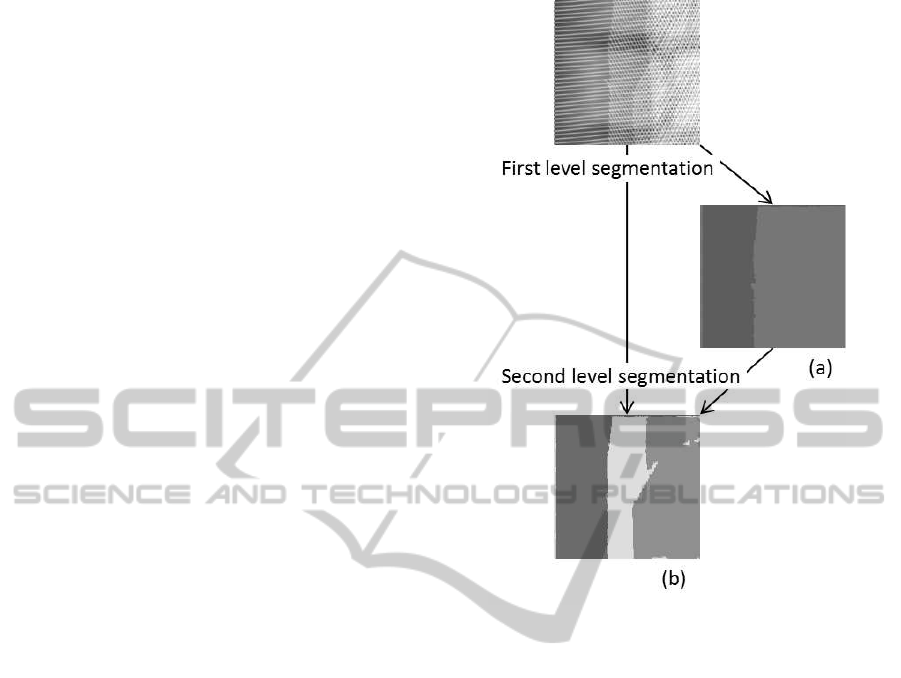
pass the test for a single orientation. Fig. 2 illustrates
this procedure exemplarily.
Figs. 2 (a) and (b) show the results of the first and
second level segmentation, respectively. In the first
step the image is segmented into two regions, where
the darker area corresponds to the image region with
a single orientation and the brighter area to the im-
age region containing a structure with more than one
orientation pattern.
On the second level of the hierarchy, only the im-
age part exhibiting more than one orientation is con-
sidered. This region is again divided into two regions,
one containing double orientations and the other one
containing more than two orientations. The image
part with a single oriented structure is disregarded
from this step onwards. Following this procedure
the segmentation step on the third level of the hier-
archy would divide the previously determined higher
Figure 2: Overview of the approach.
order oriented image part again into two regions cor-
responding to image areas with three orientations and
those with more than three superimposed patterns.
On every level of the hierarchy, the segmentation
is based on a minimization of a level dependent en-
ergy function. The data term of these functions in-
corporates the ratio s
M
defined in (13), where M cor-
responds to the level of the hierarchy. The regular-
ization term is the same in all functions and imposes
smoothness constraints on the segmentation results.
To not disturb the neighborhood relationships be-
tween adjacent regions, all energy functions of the de-
veloped approach are defined over P, which is the set
of all image pixels. When testing for a specified num-
ber of orientations at the corresponding level of the
hierarchy, all regions with a lower number of orienta-
tions should be left unchanged. This is achieved by an
appropriate definition of the energy function at each
level of the hierarchy.
4 ENERGY FUNCTIONS
The segmentation on each level of the hierarchy is
based on a minimization of an energy function via
VISAPP 2012 - International Conference on Computer Vision Theory and Applications
252
graph cuts. The basic idea behind this technique is
the construction of a graph such that the minimum
cut on the graph also minimizes the corresponding en-
ergy function (Boykov et al., 2001). Here, the optimal
segmentation of the underlying image is computed by
using the expansion algorithm, developed by (Boykov
et al., 2001). The energy functions they consider in
their work have the form
E (l) = E
data
(l) + E
smooth
(l) (14)
where l denotes the labeling of the observed data. For
image segmentation, l is a function which assigns to
each pixel p ∈ P the corresponding label l
p
∈ L. The
form of E
data
(l) is given by
E
data
(l) =
∑
p∈P
D
p
(l
p
) (15)
where D
p
measures how well label l
p
fits the pixel
p. E
smooth
(l) is the smoothness term of the energy
function and measures the extent to which the labeling
function l is not piecewise smooth. E
smooth
(l) has the
form
E
smooth
(l) =
∑
{p,q}∈N
V
p,q
(l
p
,l
q
) (16)
where N is the set of adjacent pairs of pixels and
V
p,q
(l
p
,l
q
) denotes the penalty for pixels p and q hav-
ing different labels.
The expansion algorithm seeks to find an optimal
labeling l
∗
such that the energy function given in (14)
is minimized. It starts with an initial labeling and
moves in every step toward the labeling with a lower
energy until it reaches its minimum. In this context
a new labeling l
new
is said to lie within a single α-
expansion move of l if only a finite set of pixels have
changed their labels to α, where α ∈ L. For more de-
tails on this approach, see (Boykov et al., 2001).
The main task is now the definition of appropriate
functions E
h
(l) , h ∈ [1, ··· ,h
max
] where h denotes the
segmentation level.
As already stated above, all energy functions
in our approach have the same smoothness term
E
smooth
(l). Here we have used the Potts model (Potts,
1952) as a discontinuity preserving function:
V (α,β) = K · T (α 6= β) (17)
where T (·) is 1 if its argument is true and otherwise 0.
This model encourages partitions consisting of larger,
smoothly shaped regions.
The definition of the corresponding data terms
E
data
(l) is given in the next sections.
4.1 First-order Data Term
As stated above, the data term E
data
(l) of an energy
function measures how well the given labeling l fits
the underlying image data. To obtain such an ini-
tial labeling, from which the necessary parameters
can be estimated as well as to derive an appropriate
data term, we applied the fuzzy c-means algorithm
(Bezdek, 1981) to the ratios s
M=1
(p) , p ∈ P defined
in (13), where p denotes the center of the image re-
gion Ω.
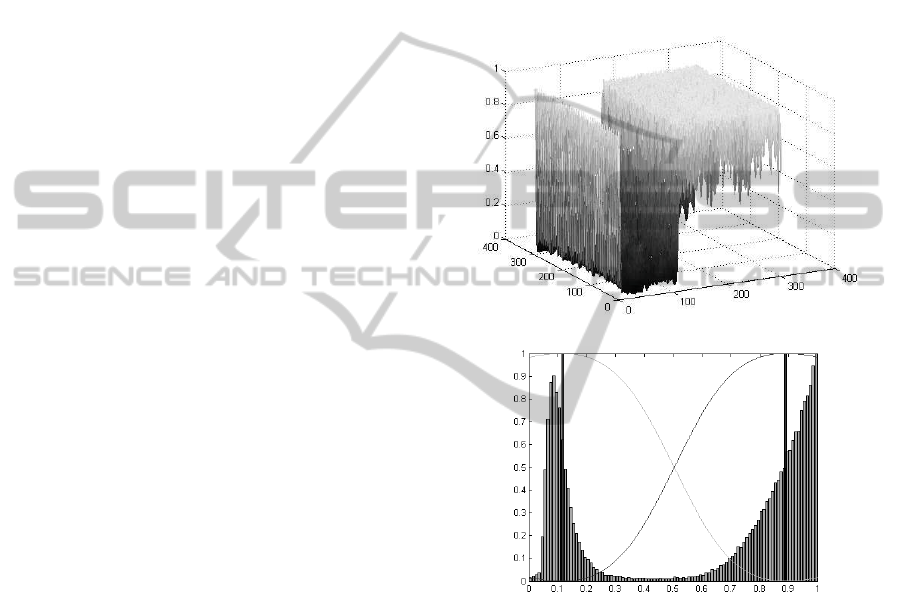
Fig. 3 shows the spatial distribution and the corre-
sponding histogram of the s
M=1
(p) values computed
from the original image shown in Fig. 1 (a).
(a) s
M=1
(p).
(b) Histogram.
Figure 3: Spatial distribution of the ratios s
M=1
(p) , p ∈ P
and the corresponding histogram with cluster centers and
membership functions.
Evidently, large values of s
M=1
(p) indicate a mul-
tiple oriented structure in an image, whereas small
values correspond to image areas with a single ori-
entation. The histogram in Fig. 3(b) reflects this situ-
ation by two clearly separable clusters.
Since in this context the order of the labeling set is
|L| = 2, we apply the fuzzy c-means algorithm to sep-
arate the values into two clusters, which correspond to
the labels l
single
and l
multi
, respectively. The results of
this clustering procedure are also shown in Fig. 3(b).
The two black bars correspond to the positions of the
computed centers, while the curves depict the mem-
bership functions µ
single
and µ
multi
of the respective
ORIENTATION-BASED SEGMENTATION OF TEXTURED IMAGES BY ENERGY MINIMIZATION
253
cluster:
µ
single
(s
M=1
(p)) : P → [0,1]
µ
multi
(s
M=1
(p)) : P → [0,1]
(18)
The results of a membership function are numerical
values in [0,1] that correspond to the degrees to which
the pixel p ∈ P belongs to one or the other cluster. A
large value complies with a high degree of affiliation
to the corresponding cluster.
We can now define the data term E
data
(l) of the first
energy function to
E
data
(l) =
∑
p∈P
(1− µ
l
p
(s
M=1
(p))) (19)
where
D
p
(l
p
) = (1− µ
l
p
(s
M=1
(p))) (20)
measures how well the label l
p
fits the pixel p. Since
we seek to minimize the overall energy function, a
good fit is represented by a small value.
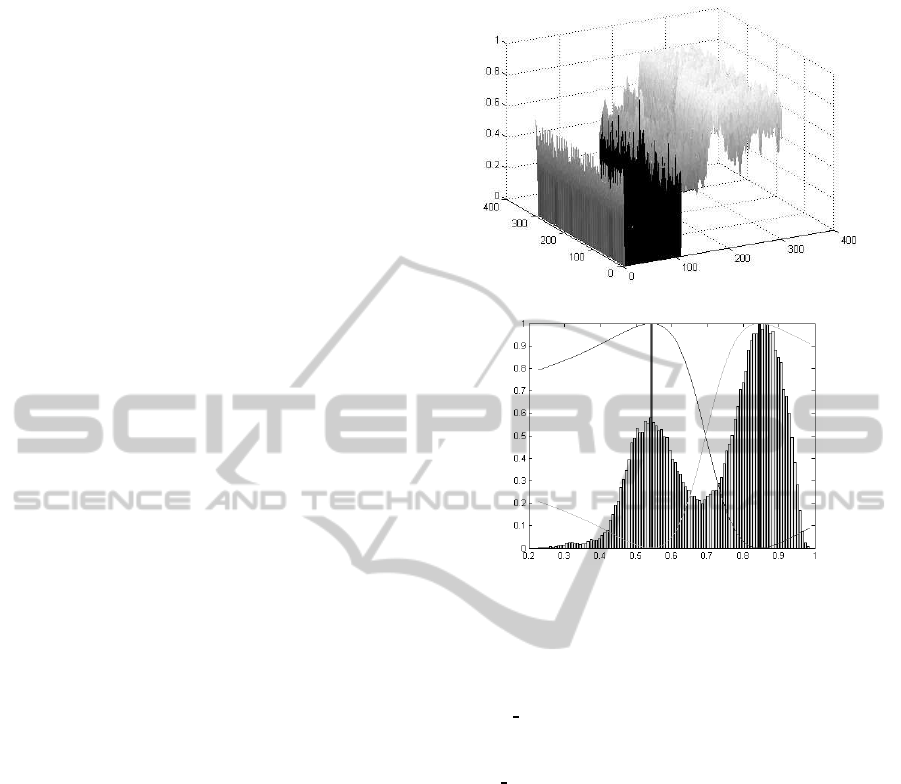
4.2 Second-order Data Term
The data term E
data
(l) of the second level energy
function is obtained similarly, with the fuzzy c-
means algorithm now being applied to the values
s
M=2
(p) , p ∈ P, where again p denotes the cen-
ter of the image region Ω. Fig. 4 shows the spatial
distribution and the corresponding histogram of the
s
M=2
(p) values computed from the original image
shown in Fig. 1 (a). As one can see, the s
M=2
(p) val-
ues have been computed only for pixels which have
been marked as belonging to the image area of multi-
ple orientations, p ∈ Ω
multi
⊂ P. Pixels of the single
oriented image part, p ∈ Ω
single
⊂ P, have been dis-
regarded in this step. The corresponding histogram
shows that in contrast to the s
M=1
histogram, the two
main clusters are here much closer to each other, hav-
ing their centers around 0.53 and 0.85, respectively.
Application of the fuzzy c-means to these values
results in two clusters and two membership functions
µ
double
and µ
multi
, which in this case correspond to the
labels l
double
and l
multi
, respectively.
To take into acount the neighborhood relation-
ships between the two regions Ω
multi
and Ω
single
, the
energy function E
h=2
(l) is defined over the entire
pixel set P. To leaveΩ
single
unchanged during this and
the following segmentation steps, this region is con-
sidered as being labeled by a fixed label l
img
, where
the corresponding membership function is defined as:
µ
img
(p) =
1, p ∈ Ω
single
0, p ∈ Ω
multi
(21)
Additionally, the two membership functions
µ
double
and µ
multi
are modified according to
(a) s
M=2
(p).
(b) Histogram.
Figure 4: Spatial distribution of the values s
M=2
(p) and the
corresponding histogram with cluster centers and member-
ship functions.
µ
double
mod
(p) =
0 , p ∈ Ω
single
µ
double
(s
M=2
(p)) , p ∈ Ω
multi
µ
multi
mod
(p) =
0 , p ∈ Ω
single
µ
multi
(s
M=2
(p)) , p ∈ Ω
multi
(22)
With these membership functions, the data term
E
data
(l) of the second level energy function can be
defined similarly to that of the first level energy func-
tion. Adding the third fixed label with the above
defined membership function (21) ensures that the
expansion algorithm does not relabel the single ori-
ented region and treats the neighborhood relation-
ships of the two regions Ω
single
and Ω
multi
in the same
manner as inside these regions.
4.3 Higher-order Data Terms
The data term of the higher-order energy function
E
h
(l) , h ∈ [3,·· · , h
max
] is defined in analogy to
that of the second order data term. After comput-
ing the membership functions of the two labels
l
h
and l
multi
, the support of the fixed label l
img
is
extended to cover all regions with an already detected
VISAPP 2012 - International Conference on Computer Vision Theory and Applications
254
number of orientations, with membership function
µ
img
(p) =
1, p ∈ Ω
h−1
0, p ∈ Ω
multi
where in the case of h = 3 the image region Ω
h−1
is
a union of the two image regions Ω
single
and Ω
double
.
Here, Ω
double
denotes the image region which was la-
beled as being double oriented in the previous hierar-
chy level.
The two membership functions µ
h
and µ
multi
are
also modified in analogy to (22):
µ
h
mod
(p) =
0 , p ∈ Ω
h−1
µ
h
(s
M=h
(p)) , p ∈ Ω
multi
µ
multi
mod
(p) =
0 , p ∈ Ω
h−1
µ
multi
(s
M=h
(p)) , p ∈ Ω
multi
As one can see the ratios s
M
are also computed de-
pending on the hierarchy level.
5 EXPERIMENTS AND RESULTS
To test the performance and robustness of the de-
scribed algorithm quantitatively and qualitatively, we
applied it to both synthetic and real image data to de-
tect up to three orientations. The regularization pa-
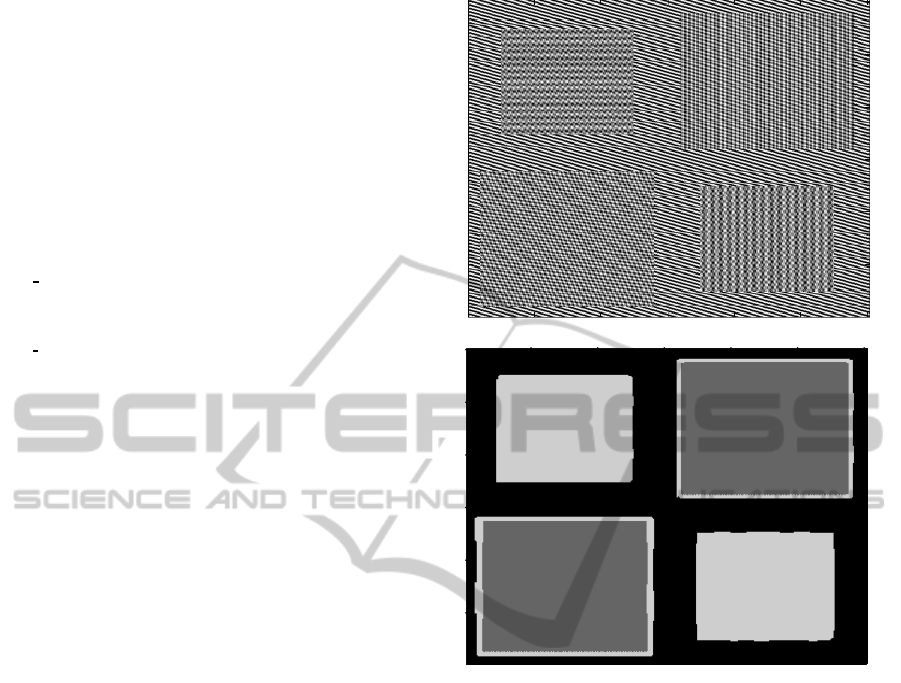
rameter K in (17) was set to K = 1 in all cases. Fig. 5
b) shows the segmentation result for the synthetically
generated image shown in Fig. 5 a).
This synthetic image contains several parts, each
with a different number of superimposed oriented pat-
terns. The structure consists of two additive orien-
tations in each of the two larger rectangles, whereas
in the two smaller rectangles the number of superim-
posed oriented patterns is three. The background of
the image is single-oriented.
Evidently, the algorithm segments the image well
into three different types of regions. The black area
represents the single-oriented image part. The area
in dark gray represents image regions where two dif-
ferent orientations have been detected, and the area
in medium gray corresponds to image regions con-
taining structures with three different orientations.
At the boundary between the double-oriented regions
and the single-oriented background, the algorithm
detects three occludingly superimposed orientations,
also represented by medium gray.
This segmentation result was obtained on the im-
age to which no noise was added. Decreasing the
signal-to-noise ratio (SNR) leads first to segmentation
results where the mentioned border region around the
double-oriented image parts starts to vanish. The uni-
formity of the regions is disturbed only when the SNR
(a) Synthetic image.
(b) Segmentation results.
Figure 5: Segmentation result for the synthetic image with
several multi-oriented regions. No noise was added to the
image.
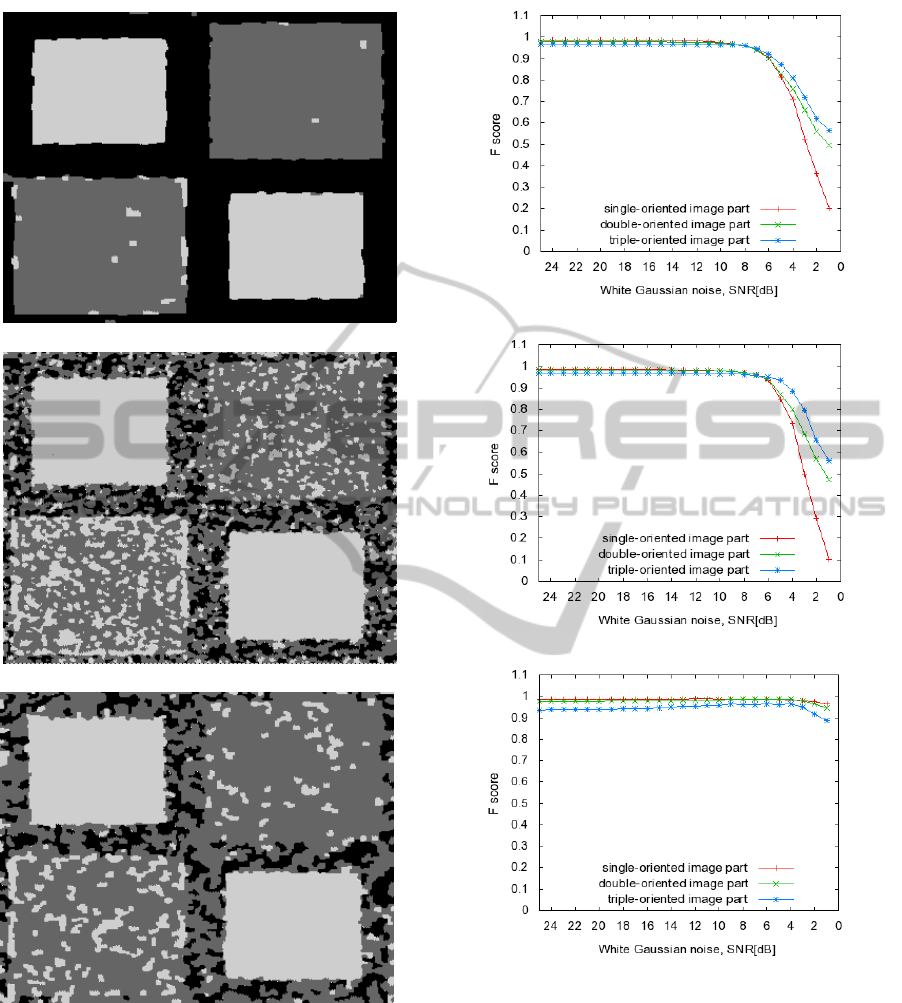
is as low as SNR = 3dB. Fig. 6 shows the segmen-
tation results obtained by three different approaches
including the one presented in this work.
Evidently, the described approach produces more sta-
ble results than the segmentation procedure based
solely on the comparison of the ratios in (13) with
the predefined thresholds, as a comparison between
Figs. 6 (a) and (b) shows. In Fig. 6 (b), only image
parts with three different orientations were segmented
properly. The rest of the image contains many mis-
classified regions. The subsequent application of the
expansion algorithm to these data, shown in Fig. 6
(c), could not reach the performance of our approach.
The initial labeling for the expansion algorithm was
in this case obtained by the hierarchical thresholding
algorithm developed in (M¨uhlich and Aach, 2009).
Additionally, Fig. 7 shows the development of
the F-score values (Frakes, 1992) computed from the
segmentation results while decreasing the SNR value
of the original image shown in Fig. 5 (a). The F-
ORIENTATION-BASED SEGMENTATION OF TEXTURED IMAGES BY ENERGY MINIMIZATION
255
(a) Proposed approach.
(b) (M¨uhlich and Aach, 2009).
(c) (M¨uhlich and Aach, 2009) + GraphCut.
Figure 6: Segmentation results for the synthetic image with
added noise (SNR = 3dB).
score is a measure of the segmentation accuracy. It
is computed from precision p and recall r via F =
2 · (pr)/(p + r). Each one of the three plots in Fig.
7 shows three different F-curves corresponding to
the segmentation accuracy of the single-, double- and
triple-oriented image parts, respectively.
(a) (M¨uhlich and Aach, 2009).
(b) (M¨uhlich and Aach, 2009) + GraphCut.
(c) Proposed approach.
Figure 7: F-score computed from the segmentation results
while decreasing the SNR value of the original image.
Obviously, SNR-values lower than 8 dB result in
a very poor segmentation when using the threshold-
ing procedure in (M¨uhlich and Aach, 2009). Subse-
quent application of a graph cut optimization tech-
nique could not improve these results substantially.
However, the F-score values shown in the third plot
testify that the segmentation results obtained with the
algorithm developed in this paper are significantly
VISAPP 2012 - International Conference on Computer Vision Theory and Applications
256
better. Another interesting point is the behavior of
the different F-curves relative to each other. In the
first two plots the F-curves corresponding to the sin-
gle oriented image parts decline faster than the other
two curves of the same plot. However, in the third plot
the F-curve correspondingto the triple oriented image
part declines faster, meaning that the segmentation ac-
curacy of the corresponding image regions is getting
worse. The following two facts are responsible for
this behavior. Adding Gaussian noise to the image
tends to lead to higher values of the ratio defined in
(13). Thresholding these values by the same thresh-
old leads therefore to a segmentation with more image
regions which have been assigned a double-oriented
structure. Since we used in our approach an adaptive
fuzzy c-means algorithm for the initial cluster label-
ing, no declining of the red F-curve can be observed
in the third plot. Still, experiments have shown that
the distance between the two clusters varies strongly
depending on which hierarchy level the segmentation
is performed. On the first level the distance is rel-
atively large, meaning that the centers lie in [0,0.5]
and [0.5,1] interval, respectively. On the second level,
both cluster centers were in [0.5, 1] interval, which
is the main reason for the poor segmentation of the
higher-order oriented image structures.
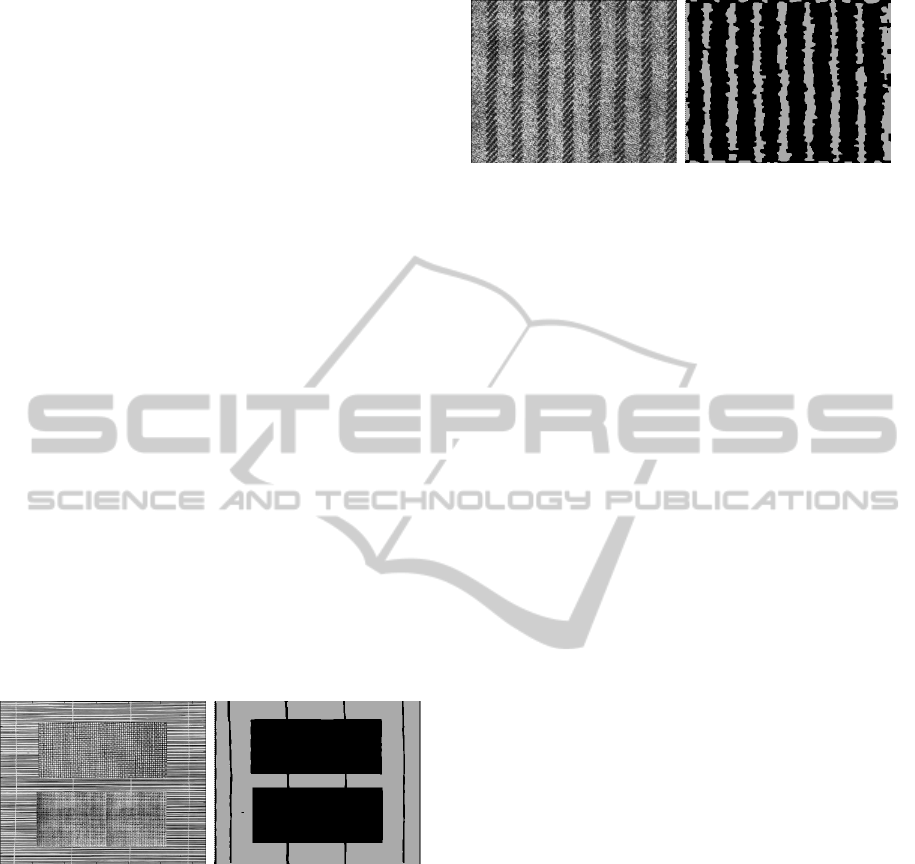
We tested our algorithm also on texture images. In
Fig. 8, the original image is composed of three differ-
ent textures. Both the background texture and the tex-
(a) Textured image. (b) Segmentation results.
Figure 8: Segmentation results of the textured image with
several multi-oriented regions.
ture on the lower part of the image were taken from
the Brodatz database. The resulting segmentation is
shown in Fig. 8 (b). It consists of two classes corre-
sponding to single- and multi-oriented image regions,
respectively.
Further results are provided in Fig. 9, where the pro-
posed segmentation approach could robustly separate
single- and multi-oriented regions.
(a) Textured image. (b) Segmentation results.
Figure 9: Segmentation results of the textured image taken
from the Brodatz database.
6 CONCLUSIONS
We have developed a hierarchical segmentation algo-
rithm, which separates an image into different regions
based on the number of superimposed oriented pat-
terns within each region. The algorithm combines
the tensor-based analysis of multiple oriented pat-
terns in (Aach et al., 2006; M¨uhlich and Aach, 2009)
with a Potts region model (Potts, 1952) and energy
minimization via graph cuts (Boykov et al., 2001).
On every level of the hierarchy, the segmentation is
thus achieved through a minimization of the corre-
sponding energy function. The data term of the en-
ergy function evaluates the hypothesis that a given
image part exhibits a particular number of superim-
posed orientations, and employs criteria testing the
rank of the corresponding orientation tensor. The
data term is complemented by a smoothness term de-
rived from the Potts model, which serves as a reg-
ularization term. The smoothness energy acts as a
discontinuity preserving term, encouraging labellings
where adjacent pixels exhibit identical labels except
across region boundaries. The energy functions were
minimized via graph cuts. The algorithm was evalu-
ated quantitatively and qualitatively on both synthetic
and real image data. The quantitative evaluation ver-
ified the robustness of the algorithm against image
noise in signal-to-noise ratios as low as 3dB. Simi-
larly, a strong performance of the algorithm was ob-
served in real image data, such as textures and tex-
ture mosaics from the Brodatz database. In partic-
ular, the occurrence of isolated segmentation errors
could be significantly reduced in comparison to the
non-regularized thresholding approaches in (M¨uhlich
and Aach, 2009).
We concentrated here on the segmentation of
single- and multi-oriented textures according to the
number of oriented patterns present in a region. We
therefore did intentionally not consider the orienta-
tions themselves, which are encoded in the eigen-
vectors (particularly in the eigenvector correspond-
ORIENTATION-BASED SEGMENTATION OF TEXTURED IMAGES BY ENERGY MINIMIZATION
257

ing to the lowest eigenvalue of an orientation tensor)
rather than the eigenvalues. Future work is directed
at including explicit orientation information into the
framework, thus allowing to divide a region with a
given number of orientations further according to the
orientation estimates.
ACKNOWLEDGEMENTS
The authors gratefully acknowledge funding of
this work by the Deutsche Forschungsgemeinschaft
(DFG, AA5/3-1).
REFERENCES
Aach, T., Kaup, A., and Mester, R. (1995). On texture anal-
ysis: Local energy transforms versus quadrature fil-
ters. Signal Process, 45:173–181.
Aach, T., Mota, C., Stuke, I., M¨uhlich, M., and Barth,
E. (2006). Analysis of superimposed oriented pat-
terns. IEEE Transactions on Image Processing,
15(12):3690–3700.
Besag, J. (1974). Spatial interaction and the statistical anal-
ysis of lattice systems. Journal Royal Statistical Soci-
ety B, 36(2):192–236.
Besag, J. (1986). On the statistical analysis of dirty pictures.
Journal Royal Statistical Society B, 48(3):259–302.
Bezdek, J. C. (1981). Pattern Recognition with Fuzzy Ob-
jective Function Algorithms (Modern Perspectives in
Energy). Springer Verlag.
Big¨un, J. and Granlund, G. H. (1987). Optimal orientation
detection of linear symmetry. In ICCV87, pages 433
–438.
Big¨un, J., Granlund, G. H., and J.Wiklund (1991). Mul-
tidimensional orientation estimation with applications
to texture analysis and optical flow. IEEE Transac-
tions on Pattern Analysis and Machine Intelligence,
13(8):775–790.
Boykov, Y., Veksler, O., and Zabih, R. (2001). Fast ap-
proximate energy minimization via graph cuts. IEEE
Transactions on Pattern Analysis and Machine Intel-
ligence, 23(11):1222 – 1239.
Derin, H. and Cole, W. S. (1986). Segmentation of textured
images using Gibbs random fields. Computer Vision,
Graphics, and Image Processing, 35:72–98.
Felsberg, M. and Granlund, G. H. (2004). Poi detection
using channel clustering and the 2d energy tensor. In
DAGM, pages 103–110. Springer Verlag.
Frakes, W. (1992). Information Retrieval Data Structure &
Algorithms. Prentice-Hall, Inc.
Freeman, W. and Adelson, E. (1991). The design and use of
steerable filters. IEEE Trans. PAMI, 13(9):891–906.
F¨orstner, W. (1986). A feature based corresponding algo-
rithm for image matching. Intl. Arch. of Photogram-
metry and Remote Sensing, 26:150–166.
Granlund, G. H. and Knutsson, H. (1995). Signal Pro-
cessing for Computer Vision. Dordrecht, The Nether-
lands:Kluwer.
Haralick, R. M. (1983). Decision making in context. IEEE
Transactions on Pattern Analysis and Machine Intel-
ligence, 5(4):417–429.
Jacob, M. and Unser, M. (2004). Design of steerable filters
for feature detection using Canny-like criteria. IEEE
Transactions on Pattern Analysis and Machine Intel-
ligence, 26(8):1007–1019.
Jain, A. K. and Farrokhnia, F. (1991). Unsupervised tex-
ture segmentation using Gabor filters. Pattern Recog-
nition, 24(12):1167–1186.
Kass, M. and Witkin, A. (1987). Analyzing oriented pat-
terns. Comput. Vis., Graph., Image Process., 37:362–
385.
Knutsson, H. and Granlund, G. H. (1983). Texture analy-
sis using two-dimensional quadrature filters. In IEEE
Workshop on Computer Architecure for Pattern Analy-
sis and Image Data Base Management, Pasadena, CA.
K¨othe, U. (2003). Integrated edge and junction detection
with the boundary tensor. In ICCV, volume 1, pages
424–431.
Lategahn, H., Groß, S., Stehle, T., and Aach, T. (2010).
Texture classification by modeling joint distributions
of local patterns with gaussian mixtures. IEEE Trans-
actions on Image Processing, 19(6):1548–1557.
Lazebnik, S., Schmid, C., and Ponce, J. (2005). A sparse
texture representation using local affine regions. IEEE
Transactions on Pattern Analysis and Machine Intel-
ligence, 27:1265–1278.
Liu, X. and Wang, D. (2003). Texture classification us-
ing spectral histograms. IEEE Transactions on Image
Processing, 12(6):661–670.
M¨uhlich, M. and Aach, T. (2009). Analysis of multiple ori-
entations. IEEE Transactions on Image Processing,
18(7):1424–1437.
M¨uhlich, M., Friedrich, D., and Aach, T. (2012). Design
and implementation of multi-steerable matched filters.
IEEE Transactions on Pattern Analysis and Machine
Intelligence, 34(2):279–291.
Potts, R. (1952). Some generalized order-disorder transfor-
mation. Proc. Cambridge Philosophical Soc., 48:106–
109.
Randen, T. and Husoy, J. H. (1999a). Filtering for texture
classification: A comparative study. IEEE Transac-
tions on Pattern Analysis and Machine Intelligence,
21(4):291–309.
Randen, T. and Husoy, J. H. (1999b). Texture segmentation
using filters with optimized energy separation. IEEE
Transactions on Image Processing, 8(4):571–582.
Zenzo, S. D. (1986). A note on the gradient of a
multi-image. Comput. Vis., Graph., Image Process.,
33:116–125.
VISAPP 2012 - International Conference on Computer Vision Theory and Applications
258
