TREE MODELING WITH DSM DATA
Keonsoo Park, Jehoon Park, Choi Ji-Hoon, Sun-Jeong Kim and Chang-Geun Song
Department of Computer Engineering, Hallym University, Gangwon-do, Korea
Keywords: LiDAR, Tree, Forest, DSM, DEM.
Abstract: This study aims to resolve the problem of not being able to directly examine forests or each individual tree
of a forest. In order to get the specific information on actual trees. Such as their locations, heights and the
number of trees. We used an aerial photograph that is 4096x4096 pixels. And process the DSM/DEM data
with a raw 16 bit-‘unsigned short’ data value. Through the collected information, we might model trees and
a forest.
1 INTRODUCTION
Tree modeling refers to acquiring important
information on trees such as location, height, width
and the number of trees. LiDAR (Light Detection
And Ranging) is a space information acquiring
technology where many laser pulses (70 KHz) are
shot from a plane and the reflected laser pulses are
used to acquire high definition height information of
the surface to create an accurate model of the laser.
It is a new measurement technology that can be used
to acquire high quality 3D digital data. Tree
modeling with LiDAR data will increase efficiency
when designing golf courses with lots of trees. This
study introduces a solution to not being able to
directly examine or explore forests and each
individual trees by using an 4096X4096 aerial
photograph and processed DSM/DEM data with a
raw 16 bit-‘unsigned short’ data value a tree
modeling method.
2 PREVIOUS STUDIES
Tree modeling has previously been studied in a
variety of different ways in the field of remote
sensing. First, there was the study where a sectional
maximum filter was applied to a certain band and
the satellite image resolution value was used to
predict the central point of trees. There was also the
study where an aerial photograph and LiDAR data
were converged and a division method was used to
estimate the height of each tree. Although both these
methods provided adequate solutions, they failed to
provide a way to isolate and explore individual trees
within the data collected.
3 METHOD AND RESULTS
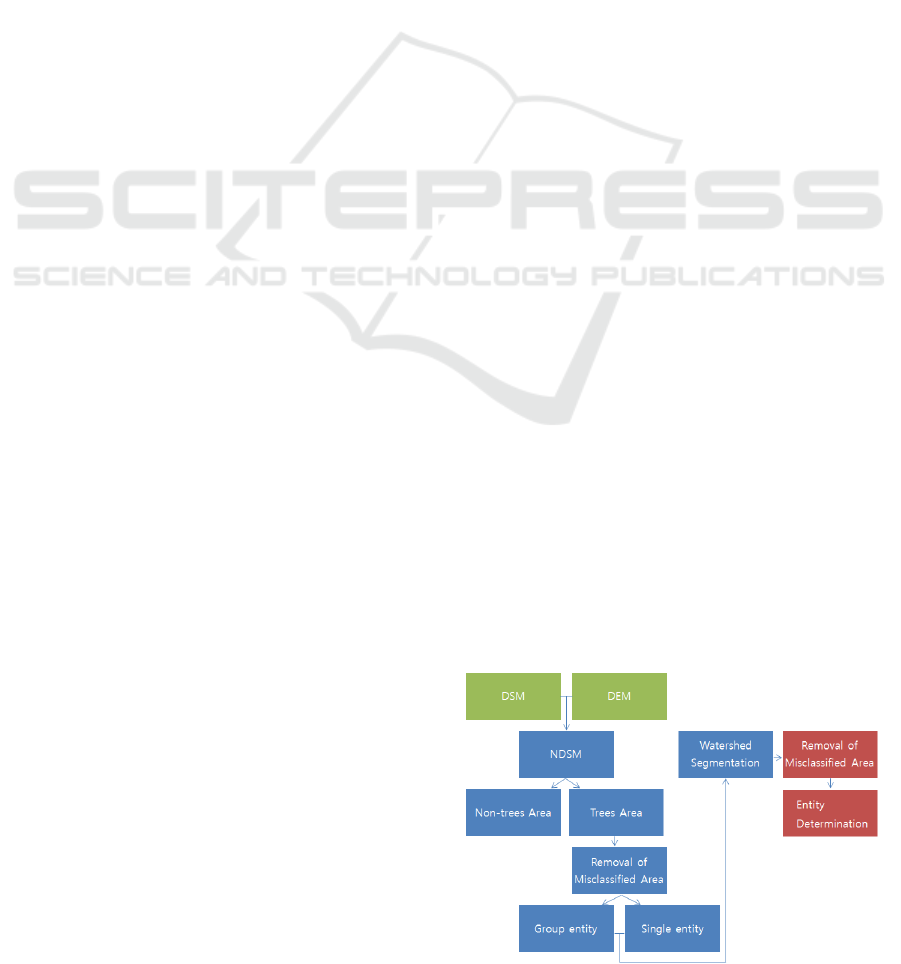
Figure 1 shows the process for tree modeling used in
this study. Previously, three parameters were
produced for modeling purposes location, height and
the number of trees. We expect to be able to enhance
the existing modeling techniques to be able to
differentiate the kinds of trees such as broadleaf or
needle leaf trees. Our method consists of 4 major
stages; First, extraction of areas where there are
predicted to be trees; second, calculation of eigen
value; third, elimination of errors in division; fourth,
division of basin.
Figure 1: Tree modelling process.
189
Park K., Park J., Ji-Hoon C., Kim S. and Song C..
TREE MODELING WITH DSM DATA.
DOI: 10.5220/0003840401890192
In Proceedings of the International Conference on Computer Graphics Theory and Applications (GRAPP-2012), pages 189-192
ISBN: 978-989-8565-02-0
Copyright
c
2012 SCITEPRESS (Science and Technology Publications, Lda.)
The tree modeling uses DSM input data that
consists of a raw data value that is a 16 bit –
‘unsigned short’ value. The entered DSM data is
used to establish an image pyramid, as shown in
Figure 2.
Figure 2: Image pyramid.
If an image pyramid as shown above is used,
areas where trees are expected to be found can be
sought out in advance from a smaller image. Then,
when the smaller image is used on a higher level,
areas that have already been processed will not go
through the process of finding areas with trees. This
process will result in increased processing speeds
and enhanced image data.
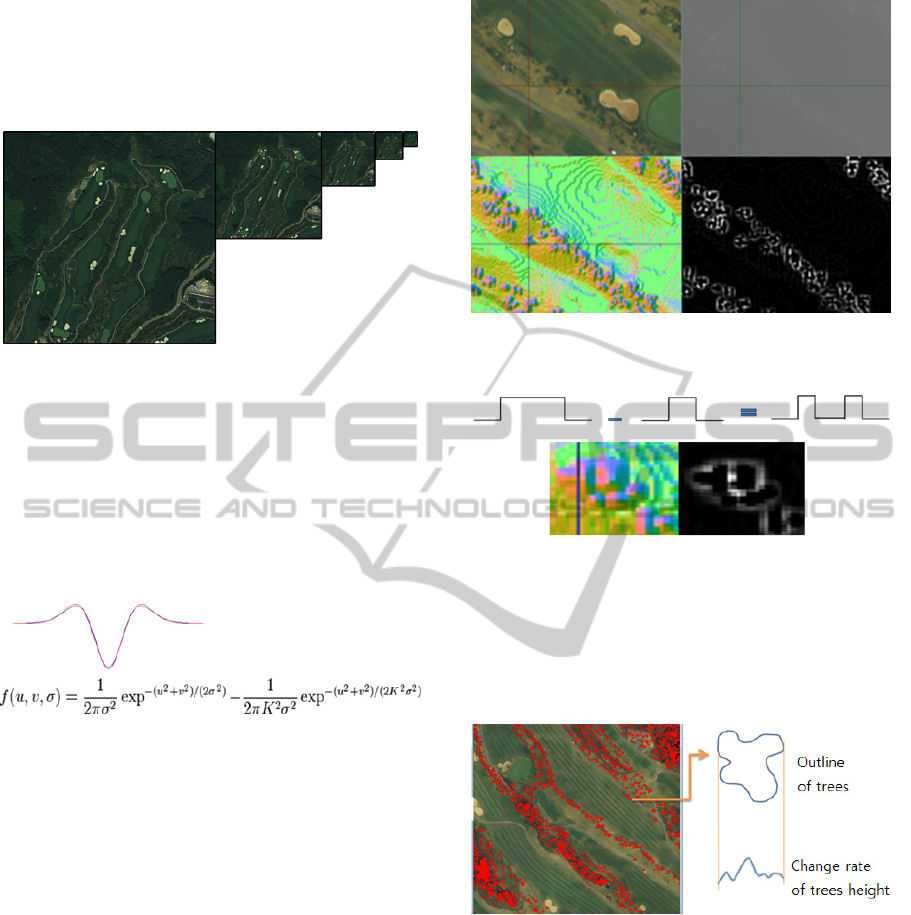
Figure 3: Difference of Gaussian.
Areas expected to have trees are found using a
DoG (Difference of Gaussian) filter with curve
characteristics as shown in Figure 3. From the image
that goes through DoG filtering we then looks for a
sectional maximum value or minimum value. The
image is a 16 bit height map, so exceptionally higher
or lower values than the surrounding areas are
extracted for areas with trees.
The top left block of Figure 4 shows part of a
color aerial image, and the top right is the DSM data
with a 16 bit height value that will be used for tree
modeling. The DSM data is used to calculate a
normal vector and create a visual presentation, and
the screen shot shown on the bottom left block is
gained. If a DoG filter is applied to the DSM data,
an image as shown on the bottom right appears. The
bright area in the center is the sectional minimum
value at [-65535, 0], and can be evaluated as the
location of trees. In addition, a simplified box filter
as shown in Figure 5 can be used instead of a
Gaussian filter for increased speed.
Figure 4: Visual presentation of areas expected to have
trees.
Figure 5: DoB (Difference of Box) results.
The location of trees is predicted by using the
sectional maximum or minimum values of an image
after it has gone through the DoG or DoB filters, so
creating a visual presentation of the predictions leads
to the image shown below in Figure 6.
Figure 6: Sectional maximum/minimum values.
The red areas in Figure 6 are areas predicted to
have trees. It shows both groups and individual
trees. The area is classified to be a group area when
the red area is greater than a predefined width. After
this processed, a watershed algorithm is applied to
divide it into individual trees. If the divided area is
less than a predefined minimal width, it is classified
as a single tree, and the process of finding out what
type of tree begins.
GRAPP 2012 - International Conference on Computer Graphics Theory and Applications
190
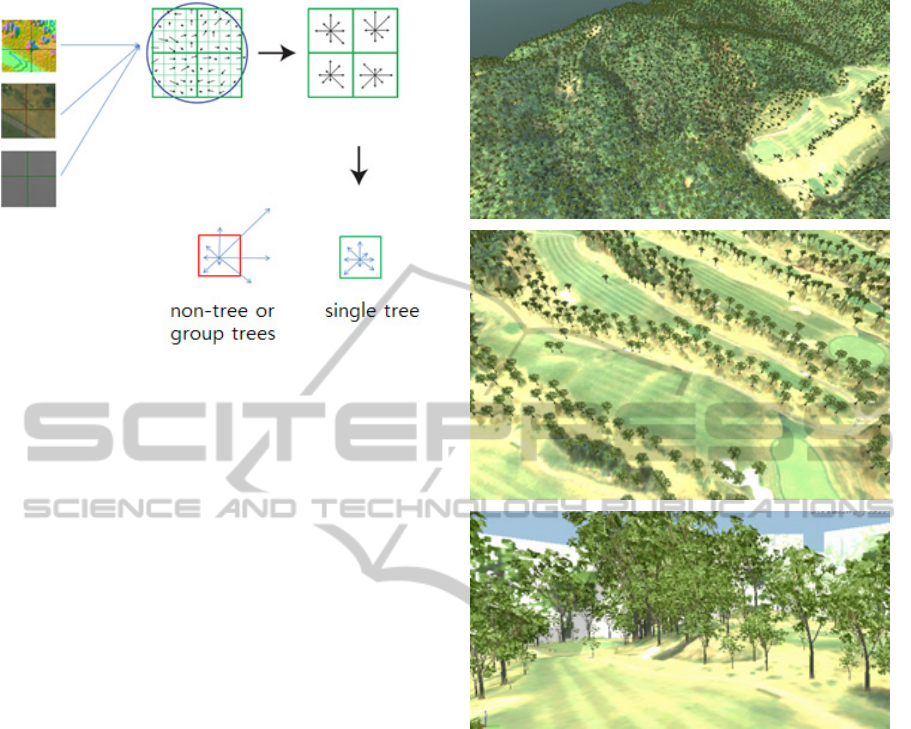
Figure 7: Classification of single tree and group trees.
4 CONCLUSIONS
An aerial photograph 4096x4096 in size and
processed DSM/DEM data with raw data value that
is a 16 bit-‘unsigned short’ value were used in this
study for tree modeling. This study used a
4096X4096 photo, processed DSM/DEM data, and a
raw 16 bit-‘unsigned short’ data value to create the
tree model, The process involves extracting areas
expected to have trees, and applying a basin division
algorithm is to extract results for tree modeling, but
stopped before identifying the type of tree. The
proposed process is largely divided into 4 steps- :
extraction of areas expected to have trees, eigen-
value calculation, elimination of errors in division,
and division of basin. The information on trees
gained through this process is used to output Figure
8 as a result.
The four processes proposed in this study are
used to gain important elements for tree modeling,
with the exception of identifying the type of trees.
Figure 8 has a random tree type because a specific
tree type analysis was not conducted. Tree modeling
may be improved in the future through studies on
identifying the type of trees.
ACKNOWLEDGEMENTS
This research was financially supported by the
Ministry of Education, Science Technology (MEST)
and National Research Foundation of Korea(NRF)
through the Human Resource Training Project for
Regional Innovation.
Figure 8: Results output.
REFERENCES
M. A. Wulder, J. C. White, K. O. Niemann, T. Nelson,
2004. Comparison of airborne and satellite high spatial
resolution data for the identification of individual trees
with sectional maxima filtering. Taylor & Francis vol
25.
Juan C. Suarez, Carlos Ontiveros, Steve Smith, Stewart
Snape, 2005. Use of airborne LiDAR and aerial
photography in the estimation of individual tree
heights in forestry. Computers & Geosciences 31.
Timothy L. haithcoat, Wenbo Song and James D. Hipple,
2001. Building Footprint Extraction and 3-D
Reconstruction from LIDAR Data. IEEE/ISPRS Joint
Workshop in Remote Sensing and Data Fusion over
Urban Areas.
Jean Cousty, Gilles Bertrand, Laurent Najman, and Michel
Couprie, 2010. Watershed cuts: thinnings, shortest-
path forests and topological watersheds. IEEE
Transactions on Pattern Analysis and Machine
Intelligence.
TREE MODELING WITH DSM DATA
191

Geun-sang Lee, Deok-gu Koh, Hyo-seok Chae, Young-ho
Shin, 2003. “A Comparative Study on DEM Errors
According to Resolution of Aerial Laser Measurement
Material,” Korean Geographical Information Society
Journal.
Open Source Computer Vision Library Reference Manual,
Intel., sourceforge.net/projects/opencv/.
Imagirae Takashi. DirectX 9 Shader Programming. Seoul:
Hanbit Publishing.
GRAPP 2012 - International Conference on Computer Graphics Theory and Applications
192
