
NON-INVASIVE MELANOMA DIAGNOSIS USING
MULTISPECTRAL IMAGING
Ianisse Quinz
´
an Su
´
arez
1
, Pedro Latorre Carmona
1
, Pedro Garc
´
ıa Sevilla
1
, Enrique Boldo
2
,
Filiberto Pla
1
, Vicente Garc
´
ıa Jim
´
enez
1
, Rafael Lozoya
2
and Guillermo P
´
erez de Luc
´
ıa
2
1
Institute of New Imaging Technologies, Jaume I University, Castell
´
on, Spain
2
Fundaci
´
on de la Comunidad Valenciana, Hospital Provincial de Castell
´
on, Castell
´
on, Spain
Keywords:
Melanoma detection, Multispectral images, Support Vector Machines, Class imbalance, SMOTE.
Abstract:
The early analysis of pigmented skin lesions is important for clinicians in order to recognize malignant
melanoma. However, it is difficult to differentiate it from benign skin lesions due to their similarity based on
their appearance. Since melanoma has a tendency to grow inside the skin and the depth of penetration of light
into the skin is wavelength dependent, a multispectral imaging acquisition and processing approach to clas-
sify pigmented lesions as melanoma seems appropriate. This paper presents a method to diagnose melanoma
lesions over a group of 26 samples acquired with a multispectral system, where 6 of them are melanomas, and
the other 20 are other types of pigmented lesions. A Leave-One-Out strategy is used to create the training/test
set. The classification imbalance problem inherent to this dataset is alleviated using a SMOT E technique. The
random component of the SMOT E methodology is dealt with running it 25 times and a Qualified Majority
Voting (QMV ) scheme is used to do the final classification, using SV M. Results show this strategy allows to
obtain competitive classification quality results.
1 INTRODUCTION
Melanoma is becoming an important health problem
worldwide. Just in Europe, 32107 cases for men and
35324 cases for women were detected in 2008, which
represents an Age Standardized Rate (European) per
100000 of 11.5 and 11.4, respectively (ECO, 2011).
Similar statistics appear in the United States (Jemal
et al., 2010).
The current procedure for the detection of skin
cancers in general is a clinical examination followed
by a tissue biopsy and histopathology. However, there
are several limitations associated to the process, and a
recent clinical study showed that approximately 40%
of suspicious biopsied lesions were classified as be-
nign by pathologists (Mogensen and Jemec, 2007).
Therefore, there is an urgent need for a real-time, non-
invasive diagnostic method that can reduce morbidity
and mortality for these cancers.
On the other hand, it is also crucial to diagnose
melanoma early in its evolution, because it has been
proven that its prognosis is directly related to the
depth of the lesion. The first attempts to make an
early diagnosis a reality came in 1985 with the ABCD
diagnosis procedure (Friedman et al., 1985; Rigel and
Friedman, 1993). Later, Abbasi (Abbasi et al., 2004)
revised this procedure adding a new parameter, E of
Evolving. Incorporation of the ABCD methodology
into the evaluation campaigns was made in the mid
1980s. Since then, mass screenings have been under-
taken. In the 1990s light-based visual technologies
were incorporated to augment the early diagnosis ca-
pability.
The depth of penetration of light into the skin is
wavelength dependent (Rigel et al., 2010). Informa-
tion found at different depths is useful in order to dif-
ferentiate benign pigmented skin lesions from malig-
nant lesions. Here lies the potential to use multispec-
tral imaging systems as noninvasive methods to help
distinguish melanoma from other lesions.
Traditionally, multispectral imaging systems have
been used in the field of remote sensing images of the
Earth taken from satellites, but this technology is in-
creasingly being introduced in other application fields
such as medicine, biology, and art, among others.
Medicine, and particularly dermatology, seems to
be a natural application field, because it can provide
tools of special interest for new types of diagnostic
tests and control treatments. It also has the advantage
that the necessary data acquisition application is fast,
386
Quinzán Suárez I., Latorre Carmona P., García Sevilla P., Boldo E., Pla F., García Jiménez V., Lozoya R. and Pérez de Lucía G..
NON-INVASIVE MELANOMA DIAGNOSIS USING MULTISPECTRAL IMAGING.
DOI: 10.5220/0003843803860393
In Proceedings of the 1st International Conference on Pattern Recognition Applications and Methods (PRARSHIA-2012), pages 386-393
ISBN: 978-989-8425-98-0
Copyright
c
2012 SCITEPRESS (Science and Technology Publications, Lda.)

simple and, above all, non-invasive. Besides, multi-
spectral images, in fact, may give us useful informa-
tion that can not be found in other parts of the wave-
length spectrum.
The aim of this paper is to present a method to
diagnose melanoma lesions over a group of samples
acquired with a multispectral system, where there is a
class imbalance problem alleviated using a technique
called SMOTE (Chawla et al., 2002). The structure
of the paper is as follows: Section 2 describes the
sate of the art in the diagnosis of melanoma and other
pigmented skin lesions. Section 3 explains multi-
spectral image acquisition and processing tools used.
Section 4 explains the classification method used and
the SMOT E technique, and results and discussion are
presented in Section 5. Conclusions are given in Sec-
tion 6.
2 MELANOMA DIAGNOSIS
As stated in Section 1, early melanoma detection has
traditionally been based on the ABCD/ABCDE sys-
tems, which provide a set of standards to facilitate vi-
sual recognition of these tumors. ABCDE stands for:
• A. Asymmetry: Melanoma lesions are typically
irregular (asymmetric), benign moles are usually
circular (symmetrical).
• B. Border: Melanoma lesions often have irregular
edges, whereas benign moles have smooth edges.
• C. Colour: Injuries have many brown and black
textured shapes. In the case of benign moles, usu-
ally only a brown spot appears.
• D. Diameter: Typically more than 6 millimeters
in diameter. The diameter in the case of moles is
usually much lower.
• E. Evolving: Comparison of the evolution of the
lesion with time.
However, in the early stages of melanoma the above
features are hardly visible and can lead to misdiagno-
sis. There have been various attempts to automatically
obtain the ABCD characteristics. The first problem in
these systems is the segmentation accuracy (Carrara
et al., 2005). Once the image has been segmented,
both morphological (Binder et al., 1998) as well as
texture features (Deshabhoina et al., 2003) have been
used. Segmentation following the ABCD rules has
been done on grey scale images as well as for each
band in multispectral images (Tomatis et al., 2003).
In the last decade, melanoma detection has in-
cluded other parameters of study apart from the
ABCD criteria, for example colour and spectral in-
formation. Cheng (Cheng et al., 2008) extracted a
group of 17 features, the first 2 of geometric type,
and the rest related to a relative colour space made
subtracting the average (R,G,B) values of the nor-
mal skin from the corresponding values of the lesion
image. After this, colour parameters related to the
mean colour and its standard deviation, as well as
skewness, energy and entropy, were assessed. R. Joe
Stanley (Stanley et al., 2007) also used a classifica-
tion strategy based on using a relative colour space.
In this case, they built a colour histogram based on
this space and classified the lesion as melanoma or
non-melanoma depending on the percentage of pix-
els considered as melanoma. A pixel is considered
as melanoma if it falls in the same histogram area
where training melanoma pixels are located. On the
other hand, Stoecker (Stoecker et al., 2011) used tex-
ture measures obtained from the co-occurrence ma-
trix and color features based on the RGB and XY Z
colour spaces (and their corresponding normalized
versions). Tenenhaus (Tenenhaus et al., 2010) de-
veloped a method to classify images as melanoma
or non-melanoma lesions under uncontrolled illumi-
nation conditions creating a 47 dimensional vector,
formed by 5 geometric and 42 colorimetric features.
The geometric features were obtained using a multi-
scale classification scheme, mimicking dermatolo-
gists’ approach who first look at the image as a whole
and then concentrate on local details to precisely lo-
calize the border.
Kuzmina (Kuzmina et al., 2011a; Kuzmina et al.,
2011b) developed a system consisting of a Nuance
EX (CRi) multispectral camera that acquired images
in the [450,950]nm spectral range using an internal
liquid crystal polarizer and three halogen lamps sur-
rounding the surface to be imaged. After image ac-
quisition and using a three-chromophore absorption
(regression) model they obtained the relative concen-
trations of oxy-hemoglobin, deoxy-hemoglobin and
melanin and considering the feature space of deoxy-
hemoglobin and melanin, they classified lesions as
melanoma or non-melanoma. Diebele (Diebele et al.,
2011) proposed a melanoma differentiation param-
eter based on the different behaviour of melanoma
from other lesions in terms of the Optical Density
(OD) value at 540, 650 and 950nm, using the ac-
quisition system proposed in (Kuzmina et al., 2011a;
Kuzmina et al., 2011b).
Garcia−Uribe (Uribe et al., 2011) developed an
oblique incidence diffuse reflectance spectrometer to
conduct in-vivo measurements of the optical prop-
erties of three different types of pigmented skin le-
sions (melanoma, dysplastic and common nevi). Both
NON-INVASIVE MELANOMA DIAGNOSIS USING MULTISPECTRAL IMAGING
387

absorption and reduced scattering coefficient spec-
tra were estimated from the images acquired in the
[455,765]nm range for 144 pigmented skin lesions
including 16 melanomas. Obtaining the extinction
coefficients of oxy-hermoglobin, deoxy-hemoglobin
and melanin allows to assess the total concentration
of hemoglobin and the oxygen saturation, using this
last figure as classification criteria for melanoma de-
tection.
Sorg (Sorg et al., 2005) used hyperspectral imag-
ing to study oxygen transportation using red fluores-
cent protein (RFP) to identify all tumor cells and
green fluorescent protein (GFP) to identify hypoxic
cells. In this way, maps were created, and (using
hemoglobin saturation) were able to classify each
pixel in the image as tumor cells (where only find
RFP) or hypoxic tumor cells (where they find RFP
and GFP).
Rajaram (Rajaram et al., 2010) used a CCD cam-
era, a xenon lamp for white illumination, a pulsed ni-
trogen laser at 337nm, and a pulsed nitrogen laser at
445nm for melanoma detection. White illumination
was used in combination with a model of diffuse re-
flectance spectroscopy to obtain parameters related to
the morphology of the tissue under analysis. Laser il-
lumination at 337 and at 445nm was used to activate
two components (NADH and FAD) which are related
to the tissue metabolic activity.
Mazzoli (Mazzoli et al., 2010) used a camera
modified to contain a LED lighting system able to ac-
quire images at 950nm and a Monte-Carlo simulator
able to infer the depth of the lesion from the acquired
images (at 950nm).
Nagaoka (Nagaoka et al., 2011) developed a hy-
perspectral imaging system using an imaging spec-
trograph (ImSpector V 8E, Specim) and a CCD cam-
era (iXon) with a 1.3nm step width resolution, cov-
ering the [380,780]nm interval. Melanoma detec-
tion was obtained assessing the spectral angle be-
tween the spectral curve corresponding to normal skin
and the curve of the skin lesion. From this angle, a
probability distribution was assessed and used as the
melanoma discrimination index. In particular, statis-
tically significant differences between the melanoma
and non-melanoma groups were analyzed using the
Mann−Whitney U− test.
Dhawan (Dhawan et al., 2005) developed an op-
tical imaging system based on multispectral transil-
lumination to provide images of skin lesions show-
ing sub-surface pigmentation and vascular architec-
ture based blood volume information, comparing their
method with the Epiluminescence Light Microscopy
method. Melanoma detection was made using image
segmentation techniques based on the CIE −L
∗
a
∗
b
∗
colour space.
Raposio (Raposio and et. al, 2007) developed a
system for the detection of melanoma using a mul-
tispectral linear camera that acquired images in the
[400,1000]nm range. They applied Principal Com-
ponent Analysis (PCA) to the image and selected the
first component. Then they assessed the local minima
of the image histogram and used them as threshold
values to segment the different image regions.
Melanoma detection is currently made not only
using colour cameras or multispectral or hyperspec-
tral systems. New fields of research are being opened
in ultrasound imaging, mRNA−based signature, and
electrical bioimpedance. For a complete survey of
current and new commercial and non-commercial
systems used the reader is referred to Table 1 (and
details therein) of (Rigel et al., 2010).
3 IMAGE ACQUISITION
A set of two systems, consisting of two different cam-
eras and two different Liquid Crystal Tunable Filters
(LCT F) were used to acquire the multispectral im-
ages of the patients’ skin lesions. Since they are tun-
able, the number of wavebands can be changed. A
spectral resolution of 10nm was fixed. The use of the
two filters is justified in order to cover the wavelength
range from 400nm to 1100nm, and the use of the two
cameras avoids the need to remove the filter from the
camera to cover the whole wavelength range. The first
camera was a CCD QImaging Retiga EX camera (12-
bit, Monochrome Cooled camera without IR Filter).
The sensor resolution is 1036 ×1360, down-sampled
to 516 ×676 pixels. The second camera was a Marlin
F080B model. The V IS filter was attached to the Mar-
lin camera, covering the [400, 720]nm spectral range.
The NIR filter was attached to the QImaging camera
and it covered the [650,1100]nm range (see Figure 1).
In both cases, a Canon TV zoom lens (whose focal
distance varies between 8 and 48mm) was used before
the filter, and a Macro Schneider system (SCHNEI-
DER, 2011) was used between the filter and the cam-
era.
The illumination system was a Fiber-Lite DC −
950 system (Dolan−Jenner industries) with a 150W
Quartz halogen lamp, and a 3250
◦
Kelvin colour tem-
perature, connected to the camera optics through a
fiber optic ring light guide. A white cylinder was
attached to the optical ring. This was done in order
to homogenize and concentrate light, significantly de-
creasing the exposure times required for each spectral
band. It also controlled the distance between the cam-
era and the lesion and prevented external light coming
ICPRAM 2012 - International Conference on Pattern Recognition Applications and Methods
388

Figure 1: Hardware for image acquisition.
into. The cylinder was 20cm long and 7.5cm in diam-
eter. At 20cm distance, an approximately 8 ·8 cm
2
square Field-of-View was achieved.
3.1 Camera Calibration
The acquisition time per band used for the LCT F fil-
ters was obtained using an ideal reflectance diffuser
object, called spectralon, which is built to reflect the
same amount of light in the whole wavelength spec-
trum. This time was adjusted so that the image ac-
quired of the spectralon were the same for all the im-
age pixels and for all bands.
In order to accomplish this aim, an automatic cal-
ibration method was implemented. For one band, the
acquisition time and grey level value are considered to
increase linearly, if illumination and distance to object
do not vary. The method consists of looking for two
(time,greylevel) pairs not allocated at extreme val-
ues, and then the exposure time is assessed based on
the linear relationship assumed for an expected grey
value.
3.2 Image Registration
Image registration is the process to obtain a mapping
that allows one image to be superimposed over an-
other image. Multispectral image acquisition is time
consuming, because an image per band has to be ac-
quired. During this time interval, involuntary move-
ments of the patient may happen, and therefore image
registration among spectral bands is a requirement.
A method based on the maximization of the mutual
information between two images (Maes et al., 1997)
(Pluim et al., 2003) was applied. In particular, let us
consider two images, A and B, of size (M +1)·(N +1)
pixels. Registering image B against A can be done
maximizing the following information criterion:
I(A,
e
B) =
∑
a
∑
b
e
p(a,b) ·log
e
p(a,b)
p(a) · p(b)
(1)
where:
e
p(a,b) =
1
M ·N
∑
x
∑
y
δ(a,A(x,y)) ·δ(b,
e
B(x,y)) (2)
where
e
B is the transformed version of B, a and b are
the possible grey level values of the image and x and
y, the pixel positions. δ is the delta function. p(a, b)
is the joint probability distribution of the grey levels
of both images, and p(a) (p(b)) is the probability dis-
tributions grey level a (b). The maximization of the
mutual information was achieved using the SIMPLEX
method (Press et al., 1992).
4 CLASSIFICATION
Multispectral image datasets related to melanoma
classification are intrinsically high dimensional and
low cardinality spaces where one of the classes
(melanoma) usually contains a lower number of sam-
ples than the others. Therefore, solving this problem
has to account for the relationships between the num-
ber of data points and the dimensionality of the fea-
ture spaces, on the one hand, and on the imbalance
among the classes, on the other hand.
4.1 Support Vector Machines
Support Vector Machines (SV Ms) is a classification
technique that is considered robust against datasets
of high dimensionality and low cardinality (Chang
et al., 1999). Given a labeled training data set
{(x
1
,y
1
),..., (b f x
n
,y
n
)}, where x
i
∈ R
N
and y
i
∈
{−1,+1} and a nonlinear mapping f , usually to a
higher dimensional space, f : R
N
→ H , the SVM
method solves:
min
w,ξ
i
,b
{
1
2
kwk
2
+ C
∑
i
ξ
i
} (3)
constrained to:
y
i
·(hf (x
i
),wi+ b) ≥ 1 −ξ
i
∀i = 1,..., n (4)
ξ
i
≥ 0 ∀i = 1,. . . ,n (5)
where w and b define a linear classifier in the feature
space. Transformation f is assessed in such a way
that the classification in the higher (transformed) di-
mensional space may be easier. The regularization
parameter C controls the generalization capability of
the classifier, and ξ
i
are positive variables controlling
the permitted errors.
4.2 Class Imbalance
Class imbalance constitutes one of the problems that
has recently received most attention in research ar-
eas such as Machine Learning, Pattern Recognition
NON-INVASIVE MELANOMA DIAGNOSIS USING MULTISPECTRAL IMAGING
389
and Data Mining (Fern
´
andez et al., 2011). A two-
class data set is said to be imbalanced if one of the
classes (the minority one) is represented by a very
small number of instances in comparison to the other
(the majority) class (He and Garcia, 2009). It has
been observed that class imbalance often leads to poor
classification performance, especially for the minor-
ity classes because these are often biased towards the
majority class. This issue is particularly important in
real-world applications where it is costly to misclas-
sify examples of the minority class.
Data level methods have been developed for deal-
ing with the class imbalance problem. These meth-
ods consist of balancing the original data set, either
by over-sampling the minority class and/or by under-
sampling the majority class until the problem classes
are approximately equally represented. Both strate-
gies can be applied in any learning system since they
act as a preprocessing phase, thus allowing the system
to receive the training instances as if they belonged to
a well-balanced data set. By using this strategy, any
bias of the learning system towards the majority class
due to the skewed class priors will hopefully be elim-
inated.
Several researchers have reported that over-
sampling in general obtains more accurate results than
the under-sampling methods (Batista et al., 2004),
(He et al., 2005), (Hulse et al., 2007). The simplest
method to increase the size of the minority class cor-
responds to random over-sampling, that is, a non-
heuristic method that balances the class distribution
through the random replication of positive examples.
Nevertheless, since this method replicates existing ex-
amples in the minority class, overfitting is more likely
to occur. Chawla et al (Chawla et al., 2002) proposed
an over-sampling technique that generates new syn-
thetic minority samples by interpolating between sev-
eral preexisting positive examples that lie close to-
gether. It first finds the k nearest neighbors (k-NN)
belonging to the minority class for each positive ex-
ample and then, the synthetic examples are generated
in the direction of some or all of the nearest neigh-
bors. This method, called Synthetic Minority Over-
sampling TEchnique (SMOTE), allows the classifier
to build larger decision regions that contain nearby
samples from the minority class. Depending upon the
amount of over sampling required, neighbors from the
k nearest neighbors are randomly chosen. Synthetic
prototypes are generated in the following way: take
the difference between the feature vector (instance)
under consideration and its nearest neighbor. Multi-
ply this difference by a random number between 0 and
1, and add it into the feature vector under considera-
tion.
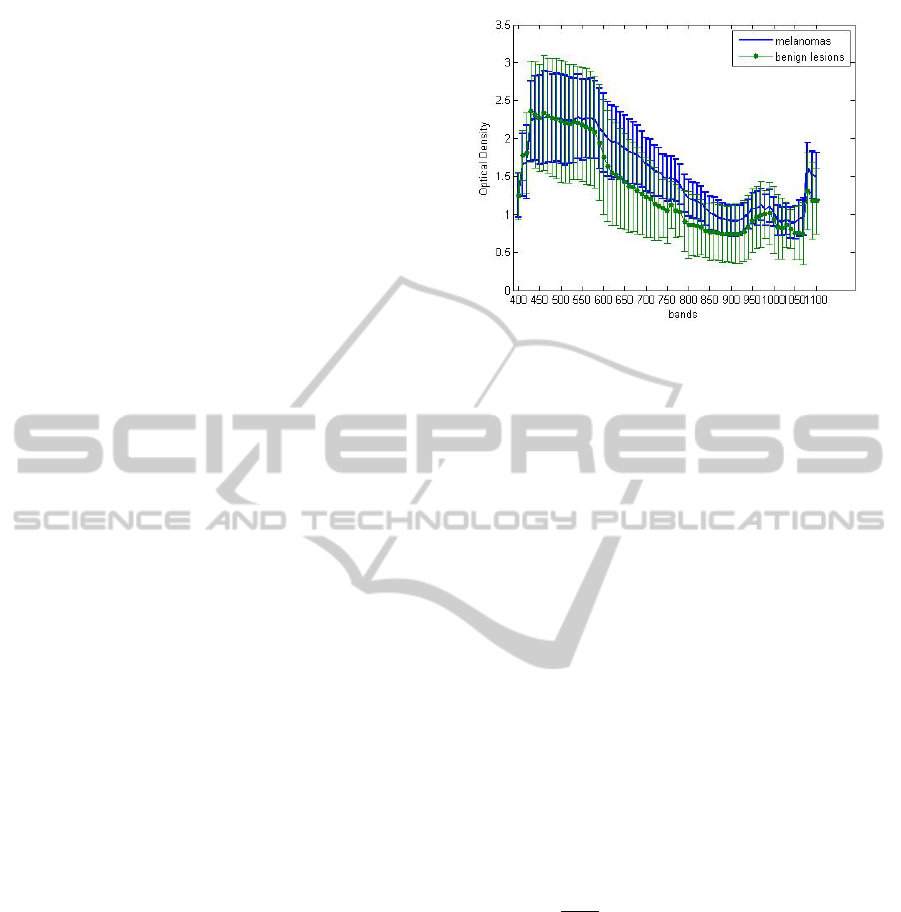
Figure 2: Optical Density curves of melanoma and a pig-
mented benign lesion.
5 EXPERIMENTAL RESULTS
A group of 26 samples (each one with the two avail-
able V IS and NIR components) of skin lesions was ac-
quired by the multispectral system. All of them were
preliminary classified as suspected pigmented lesions,
and all of them were biopsied. Biopsy determined that
6 of them were melanoma and the other 20 were other
types of lesions.
For each lesion, a region of interest was manually
selected, and the mean value (normalized between 0
and 1) for that region and for all bands was used as
feature vector. Since there is an overlapping spectral
interval in the [650,720]nm region between each pair
of images, a proportionality factor was applied to the
NIR spectral curve. This factor consisted in the mean
over the overlapping spectral interval of the ratios of
the V IS and NIR mean (over the region of interest)
signals.
Figure 2 shows the Optical Density, defined as:
OD = −log[
I
Skin
I
Spectr
] (where I
Skin
is the mean curve ob-
tained using a robust mean technique, over all the im-
ages in the database for the same class of lesion, and
I
Spectr
is the mean curve over a region of interest of
an image acquired of a spectralon) for a melanoma
lesion, and for a pigmented benign lesion. Figure 3
shows the different spectral behaviour (at 650, 800
and 900nm) of a melanoma (first row) and a non
melanoma (second row) lesion.
A Leave-One-Out strategy was selected (due to
the low number of samples in the dataset) to create
the training and testing sets formed by the feature vec-
tors. In order to classify them, an SV M classifier with
a Kernel Radial Basis Function (RBF) was used. A
grid search using equally spaced steps in the logarith-
mic space of the SVM tuning parameters (C,ξ), where
ICPRAM 2012 - International Conference on Pattern Recognition Applications and Methods
390
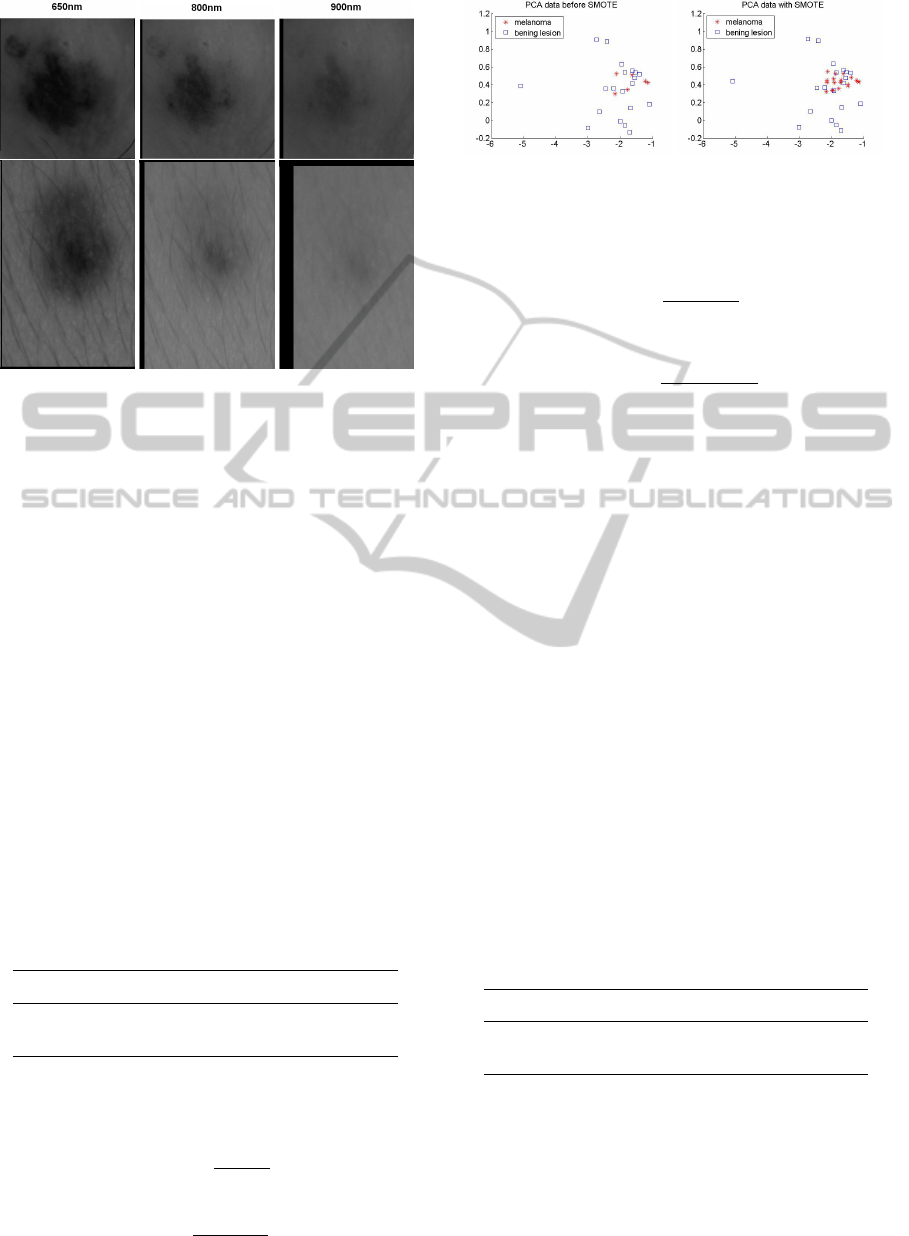
Figure 3: (First row) Spectral images of melanoma. (Sec-
ond row) Spectral images of pigmented lesion, in both cases
acquired at 650, 800 and 900nm.
ξ
i
= ξ,∀i was made to select and fix the best parame-
ters, using a 5-fold cross-validation strategy. In order
to do a quantitative assessment of the classification
quality, a typical two-class problem (melanoma or
non-melanoma) confusion matrix as shown in Table
1 was defined. Classification results in this case are
for the original dataset (without considering the class
imbalance problem), where Predicted positive means
the case when SVM identifies a lesion as melanoma,
Predicted negative when SV M considers a lesion as
non melanoma, Positive class when the hospital certi-
fies the lesion is melanoma, and Negative class when
it is not. We obtained: T P = 1, T N = 17, FP = 3
and FN = 5 (the results appear in the table as well).
On the other hand, FN is probably, with T P the two
most important values of the four of Table 1. FN = 5
in our case means that SV M has let pass through 5
melanoma lesions, without identifying them correctly.
FP = 3 means that three lesions were wrongly identi-
fied as melanoma.
Table 1: Confusion matrix for the original dataset.
Predicted positive Predicted negative
Positive class True Positive (TP)= 1 False Negative (FN)= 5
Negative class False Positive (FP)= 3 True Negative (TN)= 17
With these measures, the Geometric mean (Gm)
(Kubat and Matwin, 1997) and the Area Under the
Curve (AUC) (Sokolova et al., 2006) were obtained.
The geometric mean is defined as:
Gm =
√
a
+
·a
−
(6)
where:
a
+
=
T P
T P + FN
(7)
Figure 4: Plot of the first two (highest variance) PCA com-
ponents of the spectral curves of the melanoma and non
melanoma classes (left) before and (right) after applying the
SMOTE technique.
and
a
−
=
T N
T N + FP
(8)
The Area Under the Curve (AUC) is defined as:
AUC =
(a
+
) + (a
−
)
2
(9)
giving Gm = 0.376 and AUC = 0.508. In order to
analyze the impact of the imbalance between classes
on the classification performance, we applied the
SMOTE technique on our dataset. Figure 4 shows the
effect of the SMOT E technique on a group of points
represented onto the first two components (with the
highest variance) of the Principal Component Analy-
sis (PCA) decomposition of the feature vectors of the
melanoma and non melanoma classes of the dataset.
The generation of the synthetic prototypes in
SMOTE was made considering k = 3 neighbours.
Due to this random selection, the SMOT E technique
was applied 25 times for each one of the training
datasets created using the Leave-One-Out method.
Since the result of the classification on each of the
25 times for each dataset could be different, a Qual-
ified Majority Voting (QMV ) scheme was applied.
This means that a minimum percentage is required
to take a sensitive decision. In our case, if in more
than 70% of the 25 cases, the lesion were classified as
non melanoma, the scheme would classify the lesion
as non melanoma. In this case, the confusion matrix
gives the results that appear in Table 2.
Table 2: Confusion matrix after the application of SMOT E.
Predicted positive Predicted negative
Positive class True Positive (TP)= 6 False Negative (FN)= 0
Negative class False Positive (FP)= 3 True Negative (TN)= 17
The Geometric mean (Gm) and the Area Under the
Curve (AUC) gave the following results: Gm = 0.922
and AUC = 0.925. Gm and AUC results show that
detection of melanoma, when applying the SMOT E
technique, is feasible. Besides, FN = 0 means that
the proposed technique has not let pass through any
melanoma lesion. However, the number of False
NON-INVASIVE MELANOMA DIAGNOSIS USING MULTISPECTRAL IMAGING
391

Positives remained equal (FP = 3), which means
that three lesions were again wrongly identified as
melanoma lesions.
6 CONCLUSIONS
This paper proposes a non-invasive melanoma detec-
tion methodology based on the acquisition of multi-
spectral images in the [400,1100]nm spectral range.
The classification imbalance problem inherent to this
dataset was alleviated using a SMOTE technique.
The random component of the SMOT E methodology
was dealt with running it 25 times and a Qualified Ma-
jority Voting (QMV ) scheme was used to do the fi-
nal classification (using SVM). This strategy allowed
to obtain good classification results (Gm = 0.922 and
AUC = 0.925), as compared with the unbalanced case
(Gm = 0.376 and AUC = 0.508). Also, the number of
False Negatives achieved was zero (FN = 5 for the
unbalanced case). Nevertheless, the number of False
Positives was not reduced by the SMOT E technique.
In any case, the number of samples of the dataset used
is still quite low and therefore, we can only consider
these as preliminary results. With more data points,
future work could include the application of feature
selection and texture characterization techniques.
ACKNOWLEDGEMENTS
This work was supported by the Spanish Ministry
of Science and Innovation under the projects Con-
solider Ingenio 2010CSD2007 −00018, and EODIX
AYA 2008−05965 −C04 −04/ESP, by the Fundaci
´
o
Caixa-Castell
´
o through the project P11B2007 −48,
and by the Generalitat Valenciana through the project
PROMETEO/2010/028.
REFERENCES
Abbasi, N. R., Shaw, H. M., and Riegel, D. S. (2004). Early
diagnosis of cutaneous melanoma: revisiting the abcd
criteria. Journal of the American Medical Association,
292:2771–2776.
Batista, G. E. A. P. A., Prati, R. C., and Monard, M. C.
(2004). A study of the behavior of several methods for
balancing machine learning training data. SIGKDD
Explorations Newsletter, 6(1):20–29.
Binder, M., Kittler, H., Seeber, A., SteinerA, A., Pe-
hamberger, H., and Wolff, K. (1998). Epiluminis-
cence microscopy-based classification of pigmented
skin lesions using computerized image analysis and
an artificial neuronal network. Melanoma Research,
8(3):261–266.
Carrara, M., Tomatis, S., Bono, A., Bartoli, C., Moglia, D.,
Lualdi, M., Colombo, A., Santinami, M., and March-
esini, R. (2005). Automated segmentation of pig-
mented skin lesions in multispectral imaging. Physics
in Medicine and Biology, 50:345–357.
Chang, C. I., Q. Du, T. L. S., and Althouse, M. L. G. (1999).
A joint band prioritization and band-decorrelation
approach to band selection for hyperspectral image
classification. IEEE Trans. Geosc. Remote Sens.,
37(6):2631–2641.
Chawla, N. V., Bowyer, K. W., Hall, L. O., and Kegelmeyer,
W. P. (2002). SMOTE: Synthetic minority over-
sampling technique. J. Artif. Intell. Res., 16:321–357.
Cheng, Y., Swamisai, R., Umbaugh, S. E., Moss, R. H.,
Stoecker, W. V., Teegala, S., and Srinivasan, S. K.
(2008). Skin lesion classification using relative color
features. Skin Research and Technology, 14:53–64.
Deshabhoina, S. V., Umbaugh, S. E., Stoecker, W. V., Moss,
R. H., and Srinivasan, S. K. (2003). Melanoma and
seborrheic queratosis differentiation using texture fea-
tures. Melanoma Research, 9(4):348–356.
Dhawan, A. P., D’Alessandro, B., Patwardhan, S., and Mul-
lani, N. (2005). An over-sampling expert system for
learing from imbalanced data sets. In Proc. of the In-
ternational Conference on Neural Networks and Brain
(ICNN & B ’05), volume 1, pages 537–541.
Diebele, I., Kuzmina, I., Kapostinsh, J., Derjabo, A., and
Spigulis, J. (2011). Melanoma-nevus differentiation
by multispectral imaging. In Proc. of SPIE-OSA
Biomedical Optics, volume 8087, pages 80872G1–
80872G6.
ECO (2011). Cancer: Melanoma of skin. In European
Cancer Observatory http://eu-cancer.iarc.fr/cancer-
11-melanoma-of-skin.html,en.
Fern
´
andez, A., Garc
´
ıa, S., and Herrera, F. (2011). Address-
ing the classification with imbalanced data: Open
problems and new challenges on class distribution.
In Corchado, E., Kurzynski, M., and Wozniak, M.,
editors, Hybrid Artificial Intelligent Systems, volume
6678 of Lecture Notes in Computer Science, pages 1–
10.
Friedman, R. J., Rigel, D. S., and Kopf, A. W. (1985). Early
detection of malignant melanoma: the role of physi-
cian examination and self-examination of skin. CA: A
Cancer Journal for Clinicians, 35:130–151.
He, G., Han, H., and Wang, W. (2005). An over-sampling
expert system for learing from imbalanced data sets.
In Proc. of the International Conference on Neural
Networks and Brain (ICNN & B ’05), volume 1, pages
537–541.
He, H. and Garcia, E. (2009). Learning from imbalanced
data. IEEE Transactions on Knowledge and Data En-
gineering, 21(9):1263–1284.
Hulse, J. V., Khoshgoftaar, T. M., and Napolitano, A.
(2007). Experimental perspectives on learning from
imbalanced data. In Proc. of the 24th international
conference on Machine learning (ICML’07), pages
935–942.
ICPRAM 2012 - International Conference on Pattern Recognition Applications and Methods
392

Jemal, A., Siegel, R., Xu, J., and Ward, E. (2010). Cancer
statistics, 2010. CA: A Cancer Journal for Clinicians,
60:277–300.
Kubat, M. and Matwin, S. (1997). Addressing the curse of
imbalanced training sets: one-sided selection. In 14th
ICML, pages 179–186.
Kuzmina, I., Diebele, I., Jakovels, D., Spigulis, J., Valeine,
L., Kapostinsh, J., and Berzina, A. (2011a). To-
wards noncontact skin melanoma selection by multi-
spectral imaging analysis. Journal of Biomedical op-
tics, 16(6):0605021–0605023.
Kuzmina, I., Diebele, I., Valeine, L., Jakovels, D., Kempele,
A., Kapostinsh, J., and Spigulis, J. (2011b). Multi-
spectral imaging analysis of pigmented and vascular
skin lesions: results of a clinical trial. In Proc. of
SPIE, volume 7883, pages 7883121–7883127.
Maes, F., Collignon, A., Vandermeulen, D., Marchal, G.,
and Suetens, P. (1997). Multimodality image regis-
tration by maximization of mutual information. IEEE
Trans. Med. Imaging, 16(2):187–198.
Mazzoli, A., Munaretto, R., and Scalise, L. (2010). Prelim-
inary results on the use of a noninvasive instrument
for the evaluation of the depth of pigmented skin le-
sions: numerical simulations and experimental mea-
surements. Lasers Med. Sci., 25:403–410.
Mogensen, M. and Jemec, G. (2007). Diagnosis of non-
melanoma skin cancer/keratinocyte carcinoma: a re-
view of diagnostic accuracy of nonmelanoma skin
cancer diagnostic tests and technologies. Dermatol.
Surg., 33:1158–1174.
Nagaoka, T., Nakamura, A., Okutani, H., Kiyohara, Y., and
Sota, T. (2011). A possible melanoma discrimina-
tion index based on hyperspectral data: a pilot study.
Skin Research and Technology, (DOI:10.1111/j.1600-
0846.2011.00571.x):1–10.
Pluim, J. P. W., Maintz, J. B. A., and Viergever, M. A.
(2003). Mutual-information-based registration of
medical images: A survey. IEEE Trans. Med. Imag-
ing, 22(8):986–1004.
Press, W., Teukolsky, S. A., Vetterling, W. T., and Flannery,
B. P. (1992). Numerical Recipes in C: The Art of Sci-
entific Computing. Cambridge University Press.
Rajaram, N., Aramil, T. J., Lee, K., Reichenberg, J. S.,
Nguyen, T. H., and Tunnell, J. W. (2010). Design
and validation of a clinical instrument for spectral di-
agnosis of cutaneous malignancy. Applied Optics,
49(2):142–152.
Raposio, E. and et. al (2007). Spectrophotometric technol-
ogy for the early detection of cutaneous melanoma.
International Journal of Simulation Systems, Science
& Technology, 8(4):46–54.
Rigel, D. S. and Friedman, R. J. (1993). The rationale of the
abcds of early melanoma. J. Am. Acadm. Dermatol.,
29:1060–1061.
Rigel, D. S., Russak, J., and Friedman, R. (2010). The evo-
lution of melanoma diagnosis: 25 years beyond the
abcds. CA: A Cancer Journal for Clinicians, 60:301–
316.
SCHNEIDER (2011). Industrial optics: Oem. In http://
www.schneiderkreuznach.com.
Sokolova, M., Japkowicz, N., and Szpakowicz, S. (2006).
Beyond accuracy, f-score and roc: A family of dis-
criminant measures for performance evaluation. In
Sattar, A. and Kang, B.-h., editors, AI 2006: Ad-
vances in Artificial Intelligence, volume 4304 of Lec-
ture Notes in Computer Science, pages 1015–1021.
Sorg, B. S., Moeller, B. J., Donovan, O., Cao, Y., and
Dewhirst, M. W. (2005). Hyperspectral imaging of
hemoglobin saturation in tumor microvasculature and
tumor hipoxia development. Journal Biomedical Op-
tics, 10(4):044004.
Stanley, R. J., Stoecker, W. V., and Moss, R. H. (2007). A
relative color approach to color discrimination for ma-
lignant melanoma detection in dermoscopy images.
Skin Research and Technology, 13:62–72.
Stoecker, W. V., Wronkiewiecz, M., Chowdhury, R., Stan-
ley, R. J., Xu, J., Bangert, A., Shrestha, B., Cal-
cara, D. A., Rabinovitz, H. S., Oliviero, M., Ahmed,
F., Perry, L. A., and Drugge, R. (2011). Detection
of granularity in dermoscopy images of malignant
melanoma using color and texture features. Comput-
erized Medical Imaging and Graphics, 35:144–147.
Tenenhaus, A., Nkengne, A., Horn, J.-F., Serruys, C.,
Giron, A., and Fertil, B. (2010). Detection of
melanoma from dermoscopic images of naevi ac-
quired under uncontrolled conditions. Skin Research
and Technology, 16:85–97.
Tomatis, S., Bono, A., Bartoli, C., Carrara, M., LualdiM,
M., Tragni, G., and Marchesini, R. (2003). Automated
melanoma detection, multispectral imaging and neu-
ronal network approach for classification. Melanoma
Research, 30(2):212–221.
Uribe, A. G., Smith, E. B., Zou, J., Duvic, M., Prieto,
V., and Wang, L. V. (2011). In-vivo characteriza-
tion of optical properties of pigmented skin lesions
including melanoma using oblique incidence diffuse
reflectance spectrometry. Journal of Biomedical op-
tics, 16(2):0205011–0205013.
NON-INVASIVE MELANOMA DIAGNOSIS USING MULTISPECTRAL IMAGING
393
