
MUSCLE FIBRES MODELLING
Josef Kohout
1
, Gordon J. Clapworthy
2
, Saulo Martelli
3
and Marco Viceconti
3
1
Department of Computer Science and Engineering, University of West Bohemia, Plzeˇn, Czech Republic
2
Department of Computer Science and Technology, University of Bedfordshire, Luton, U.K.
3
Laboratorio di Tecnologia Medica, Istituto Ortopedico Rizzoli, Bologna, Italy
Keywords:
Muscle Modelling, Muscle Fibres, VTK.
Abstract:
This paper describes a method that represents a muscle by a realistic chaff of muscle fibres that are automat-
ically generated in the volume defined by the surface mesh of the muscle which itself automatically wraps
around bones as they move. Our C++ implementation can decompose the volume into muscle fibres, which
is done by a slice-by-slice morphing of predefined fibres template into the muscle volume, and visualise the
result in only about 1000 ms on commodity hardware. Hence, the method is fast enough to be suitable for
interactive educational medical software. Although a biomechanical assessment has yet to be done, we believe
that the method could be used also in clinical biomechanical applications to extract information on the current
muscle lever arm and fibre path and, thanks to its rapid processing speed, it might be an attractive alternative
to current methods.
1 INTRODUCTION
Knowledge of muscle fibres is essential for physio-
therapists, surgeons and orthopedists, especially for
effective rehabilitation programs that aim at improv-
ing the quality of life of patients suffering from neuro-
muscular disorders (more than 0.1% of general popu-
lation in UK (Pohlschmidt and Meadowcroft, 2010)),
for planning optimal muscle surgery (e.g., muscle
auto-transplantation), and prediction of forces having
impact on joints. Studying traditional anatomical at-
lases (e.g., Gray’s atlas (Gray, 1918)) is a common
option to gain this knowledge. However, the full un-
derstanding requires an excellent imagination skill of
the student since they need to reconstruct 3D mod-
els in their minds. Furthermore, these atlases show
muscles in their rest-poseposition only and, therefore,
they provide a limited insight.
Digital 3D anatomical atlases seem to be a better
alternative. However,as far as we know, most of them
display muscle fibres on the muscle surface only, thus
not providing information about muscle interior, or
do not display them at all. Similarly to traditional
atlases, muscles are displayed in their rest-pose po-
sition, though being able to model muscles in various
positions (e.g., walking, stepping stairs, falling) is an
essential step in the process of looking for an optimal
strategy to provide patients suffering from various
musculoskeletal disorders with better healthcare.
Ng Thow Hing in his research (Ng-Thow-Hing,
2001) represents a muscle with a B-spline solid fitted
to raw muscle surface data extracted from a set of par-
allel images and to internal fibre points obtained from
an autopsy. Muscle fibres can be then generated sim-
ply by constructing iso-curves within the solid. The
simulation of movement is possible through manipu-
lation of control points of B-spline solid. Although
accurate, this technique is rather impractical because
of its the complexity of B-spline fitting procedure.
A different approach is described by Blemker &
Delp in (Blemker and Delp, 2005). In their model,
a muscle is represented by 3D finite-element hexahe-
dral mesh whose vertices move in reaction to the ex-
ternal force induced by the movement of the bones.
Each cell of the mesh contains information about the
direction of the muscle fibres present in its volume.
When the mesh changes, so do the paths of the fibres.
The process of constructing the mesh is as follows. A
surface model of the muscle to be represented is ob-
tained from the input medical images. The user then
has to create, manually, a hexahedral cubical template
mesh that contains the whole muscle in its interior.
Unlike the approach by Ng Thow Hing, muscle fibres
arrangement is not derived from a real muscle but it
is given in a predefined cubical template that consists
of a set of interpolated rational B´ezier spline curves
58
Kohout J., J. Clapworthy G., Martelli S. and Viceconti M..
MUSCLE FIBRES MODELLING.
DOI: 10.5220/0003847400580066
In Proceedings of the International Conference on Computer Graphics Theory and Applications (GRAPP-2012), pages 58-66
ISBN: 978-989-8565-02-0
Copyright
c
2012 SCITEPRESS (Science and Technology Publications, Lda.)
connecting two muscle attachment areas highlighted
on this template. This template of the fibre geome-
try is mapped into this template hexahedral mesh. Fi-
nally, the template mesh is projected into the volume
of muscle by a proprietary mapping method available
in the commercial TrueGRID (XYZ Scientific Appli-
cations) software. Although much easier definition of
muscle fibres is presented, the dependence on an ex-
pensive commercial tool together with the large mem-
ory consumption (because of 3D mesh) renders this
approach also quite impractical.
Representing a muscle with a triangular surface
mesh is very popular, especially, due to its simplic-
ity and low memory requirements. Although vari-
ous technique for deforming this mesh as bones move
were described, such as mesh-skinning based ap-
proaches (Kohout et al., 2011), (Aubel and Thalmann,
2000), mass-spring systems (Thalmann, 1998) or gra-
dient domain (Kohout et al., 2012), as far as we know,
no method is available at present for a decomposition
of the volume of the deformed muscle (defined by its
mesh surface) into muscle fibres.
Hence, in this paper, we propose a simple tech-
nique that can decompose the muscle volume into
muscle fibres by a slice-by-slice morphing of prede-
fined fibres template (proposed by Blemker & Delp)
into the interior of the muscle, employing mapping
technique described in (Hormann and Floater, 2006).
The remainder of this paper is structured as fol-
lows. In the next section, we give a brief brings an
overview of our method; details are described in sec-
tions 3. Section 4 presents the experiments that were
performed. Section 5 concludes the paper and pro-
vides an overview of possible future work.
2 METHOD OVERVIEW
Our method is designed to process any muscle rep-
resented by its surface mesh for which information
about its attachment areas, i.e., about sites at which
the muscle is attached to the bone by a tendon, is
available. This information is typically provided as
two sets of landmarks, one for the origin and the other
for the insertion area, specified by an expert. Every
landmark is fixed to an underlying bone, so that when
bones move (during the simulation of various activi-
ties), so do landmarks. The number of landmarks in
the set define the accuracy of the fibres generated. We
note that for many muscles, it is sufficient to spec-
ify just one landmark. Figure 1 shows an example of
muscles and their landmarks.
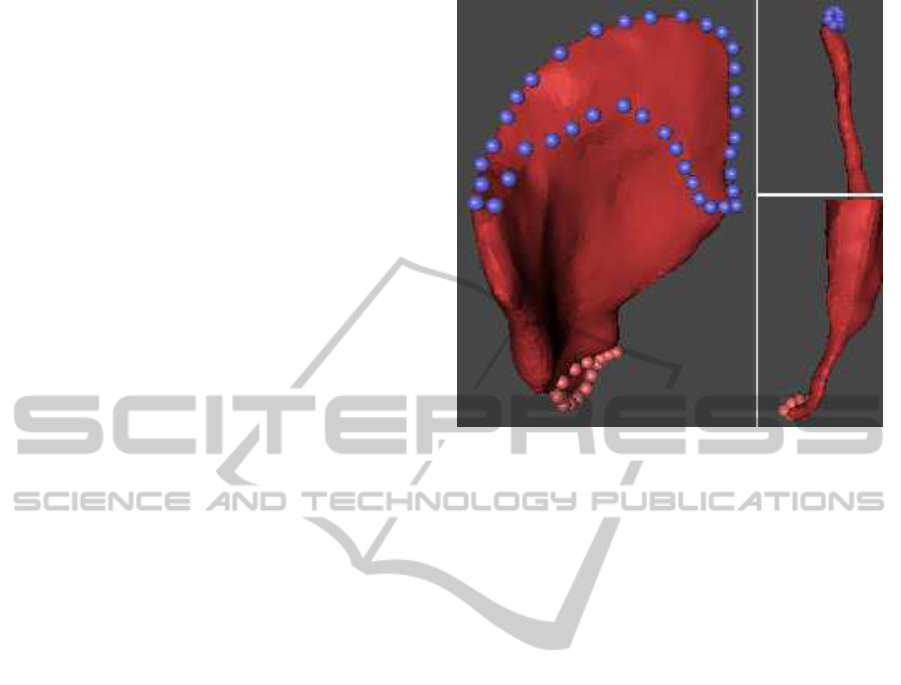
For each muscle to be decomposed, it is also nec-
essary to specify (again by an expert) what type of
Figure 1: Gluteus Medius (left) and Semimembranosus
(right) with their attachment areas. The origin area is blue,
the insertion area is red.
muscle fibres it contains, if parallel, pennate, curved,
fanned or something else. According to this informa-
tion, the method selects a predefined template con-
taining the description of fibres geometry. As we
seek to decompose the muscle into an arbitrarily large
number of fibres, the requested number of fibres to be
constructed and their resolution must be also defined.
We note that the resolution of a fibre is the number
of segments along its length, e.g., if the resolution is
19 (the default value in our case), each fibre is repre-
sented by a poly-line of 20 points. We would expect
that the higher the resolution, the smoother the curve
of the fibre will be and, therefore, the better will be
the correspondence with anatomical fibres. It is im-
portant to point out that these settings (i.e, the type of
fibres, their number and resolution) can be specified
by an expert and then stored with the atlas data, so
that no input is required from an ordinary user (e.g., a
student of medicine).
The decomposition method starts with the pro-
duction of muscle fibres of the requested resolution
within the unit template cube. It involves exploitation
of Sobol points (Joe and Kuo, 2008) and muscle fi-
bre geometry templates (Blemker and Delp, 2005). In
the next step, this template cube is subject to an affine
transformation to form the best fit to the muscle to be
decomposed. The transformed template is an oriented
bounding box (OBB) of the muscle whose attachment
areas are aligned with those specified as input.
After the template cube has been fitted to the mus-
cle, the poly-lines representing the fibres undergo the
MUSCLE FIBRES MODELLING
59
same affine transformation and are then morphed into
the muscle so that the template box becomes the sur-
face of the muscle and its fibres are mapped into the
muscle volume. The morphing is done successively
by slicing both the transformed cube with its fibres
and the muscle surface and mapping the contour of
the cube onto the contour of the muscle using generic
barycentric coordinates (Hormann and Floater, 2006).
An example of the morphing is given in Figure 2.
Figure 2: Decomposition of the muscle volume into muscle
fibres – above the template with parallel fibres, below the
result of mapping of template into the interior of muscle.
For muscles with wide attachment areas, the paths
of muscle fibres generated by the process described so
far are unrealistic in a proximity of such an area since
the fibres tend to meet in a common point instead of
spreading over the whole area. To correct this, we cut
out the part of the fibre that is close to the attachment
area and replace it by a line segment whose end-point
lies on the surface of muscle in the region defined by
the attachment area and that has the direction derived
from the trimmed fibre. Finally, the muscle fibre is
smoothed to eliminate noise that might be present in
the produced muscle fibres.
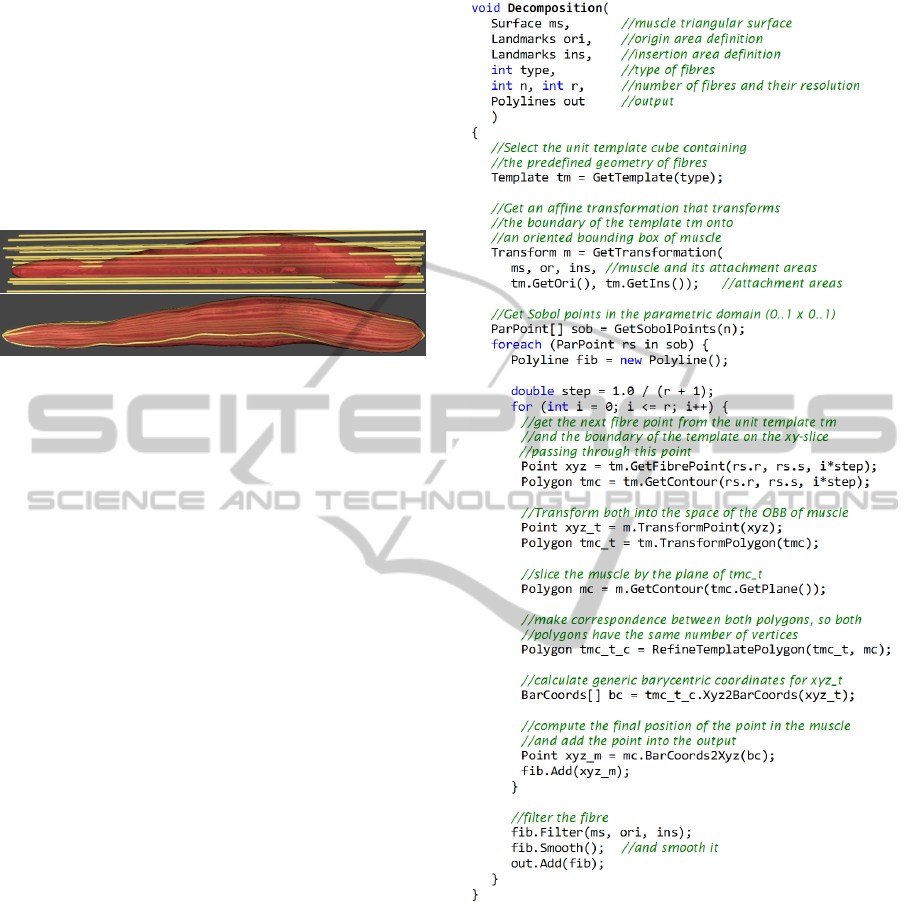
A simplified and unoptimised version of the
method written in a pseudo-code is given in Figure 3.
Please note that the pseudo-code does not perfectly
match the description that was given above because
of the performed simplification.
3 DECOMPOSITION OF
WRAPPED MUSCLE
In this section, we describe all steps of the method,
we have just outlined, in detail.
3.1 Template Generation
The template for the fibres follows the ideas presented
by Blemker & Delp (Blemker and Delp, 2005). This
template is a unit cube with defined the origin and in-
sertion areas on its bottom and top faces, respectively.
The areas are connected by B´ezier curves (of degree
varying from 2 to 4 depending on the muscle type)
which will represent the muscle fibres – see Figure 4.
Figure 3: A simplified and unoptimised version of our
method written in a pseudo-code.
Generally, the cube can contain an infinite number of
curves, so there is no limit on the number of fibres
that can be represented; each fibre is a B´ezier curve
C(t) of real parameter t whose control polygon can
be identified by a pair of real parameters r, s.
To create the requested number of fibres, the para-
metric space r, s must be sampled. Ng-Thow-Hing
(Ng-Thow-Hing, 2001) suggests the use of Sobol
sampling (Joe and Kuo, 2008) which produces a bet-
ter distribution of fibres within the muscle volume
than random or uniform sampling, especially when
GRAPP 2012 - International Conference on Computer Graphics Theory and Applications
60
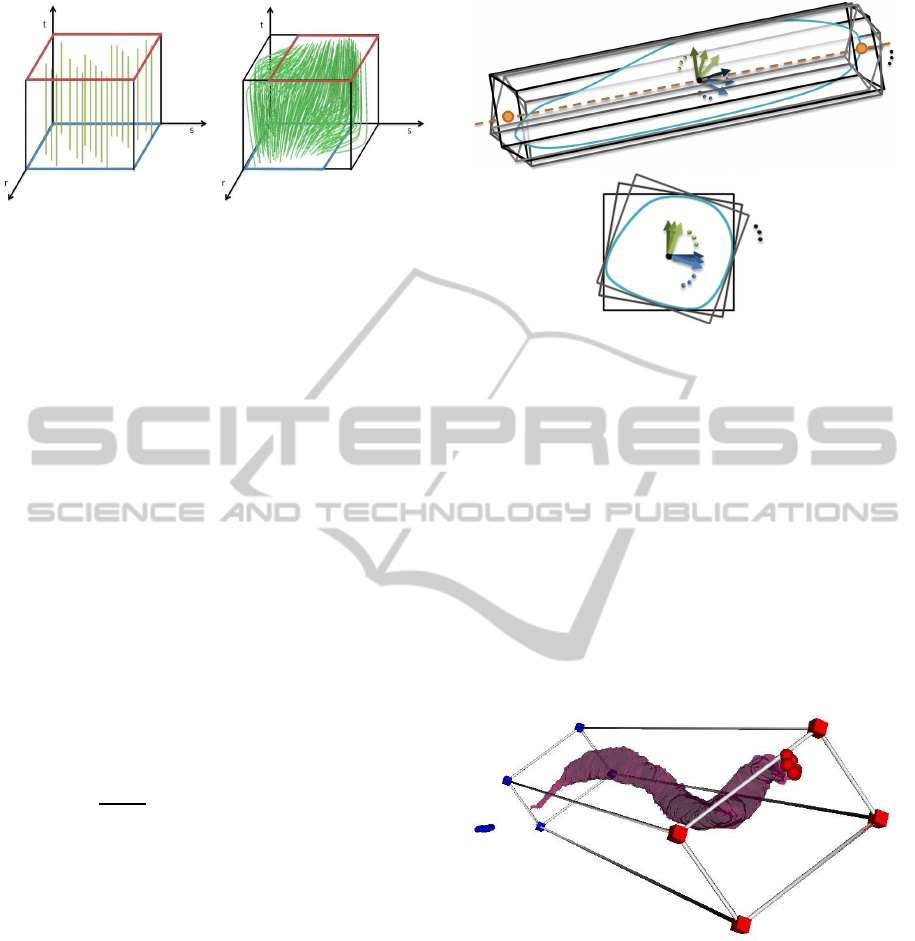
Figure 4: The template of parallel (left) and pennate (right)
fibres. The origin area is blue, the insertion area is red.
the number of fibres is relatively low (up to hundreds),
which is typical in this context. The fibre curves re-
trieved are sampled in the parameter space, t, to pro-
duce poly-lines of as many segments as the value of
the required resolution.
3.2 Template Fitting
We assume that the principal axis of the muscle coin-
cides with one of the axes of the cube. The origin of
the principal axis is calculated as the centroid of the
muscle, i.e., the mean of coordinates of surface ver-
tices. The direction of the principal axis can be deter-
mined easily as the difference between the centroid of
the insertion area and the centroid of the origin area.
In a case that the attachment area is so complex that
its centroid does not fit the data well, the direction
is determined differently as the eigenvector with the
largest eigenvalue obtained for the first-order covari-
ance matrix:
1
N − 1
·
C
0,0
C
0,1
C
0,2
C
0,0
C
1,1
C
1,2
C
,0
C
2,1
C
2,2
(1)
C
i, j
=
N−1
∑
k=0
(V
k,i
− O
i
) · (V
k, j
− O
j
) (2)
where O = (O
0
,O
1
,O
2
) is the origin of the principal
axis andV
i,0
,V
i,1
,V
i,2
are the Euclidean coordinates of
the surface vertex V
i
(i = 0...N − 1; N is the number
of surface vertices).
Having aligned u
0
with the principal axis, any two
vectors v
0
and w
0
so that (u
0
,v
0
,w
0
) forms an orthog-
onal set are chosen. These vectors are successively
rotated around the principal axis by a small angle (we
use 5
◦
), which results in a set of frames (u
0
, v
i
, w
i
),
as depicted in Figure 5. For each frame, the minimal
axis-aligned bounding box of the muscle surface ver-
tices is constructed based on vectors u
0
, v
i
, w
i
.
From these bounding boxes, we must choose the
one whose origin and insertion areas (see Figure 4)
best match the muscle origin and insertion areas that
Figure 5: The principal axis (dashed red line) oriented
bounding boxes (grey) of the object. Red axis + green and
blue arrows denote local coordinate frames. Parallel pro-
jection on to the plane perpendicular to the principal axis is
shown below.
are specified either by the action lines of the muscle or
manually by an expert. To do so, for each point of the
template origin area (defined as a rectangle for most
templates) we find the closest point on the muscle ori-
gin area and, likewise, for each point of the template
insertion area, the closest point on the muscle inser-
tion area. The Euclidean distances between the pairs
of points found are summed – the best configuration
is the one with the minimal sum. The result of fitting
the sartorius muscle is shown in Figure 6.
Figure 6: The best fitting of the parallel fibres template for
the sartorius muscle. The origin area defined in the template
(a rectangle with four points) and specified by the user (a
cloud of points) on the bone is blue, while the insertion area
is red.
3.3 Template Morphing
After the template cube has been fitted to the mus-
cle, the poly-lines representing the fibres undergo the
same affine transformation and are then morphed into
the muscle so that the template box becomes the sur-
face of the muscle and its fibres are mapped into the
muscle volume.
MUSCLE FIBRES MODELLING
61
The morphing uses a sweeping paradigm: a plane
perpendicular to the principal axis of the muscle
moves from one face of the template box to the oppo-
site face, stopping at each point F
j
of fibre poly-lines
that has not yet been processed. This plane cuts both
the template box and the surface of the muscle pro-
ducing a rectangle from the template and a polygon
contour from the surface.
Let us assume that vertices of both polygons are
oriented clockwise and that the contour polygon is
formed of m segments, where m ≥ 1. Our task is to
subdivide the sides of the template rectangle in such a
manner that the resulting polygon is also formed of m
segments, and to establish a correspondence between
the vertices of both polygons (rectangle template and
contour polygon).
The algorithm starts with the detection of the ver-
tex of the muscle contour that is closest to the first
vertex Q
0
of the template rectangle. The chain of ver-
tices P
0
...P
m
must be split into four parts, where each
part corresponds to one side of the input rectangle.
The split must be such that the overall error, given as
the sum of errors for every part, is minimal.
Let k be the ratio of the rectangle perimeter to the
contour perimeter. The error for a given part of the
chain is computed as the square of the difference be-
tween the size of the rectangle side associated with
the part and the sum of the lengths of the segments
formed by the vertices in the part, scaled by the con-
stant k. After that, a side of the rectangle can be easily
subdivided into as many segments as there are seg-
ments in the corresponding part of the chain. The ra-
tios between the segment lengths are, of course, pre-
served. Establishing the correspondence between the
polygons is straightforward: the vertex P
i
corresponds
to the vertex Q
i
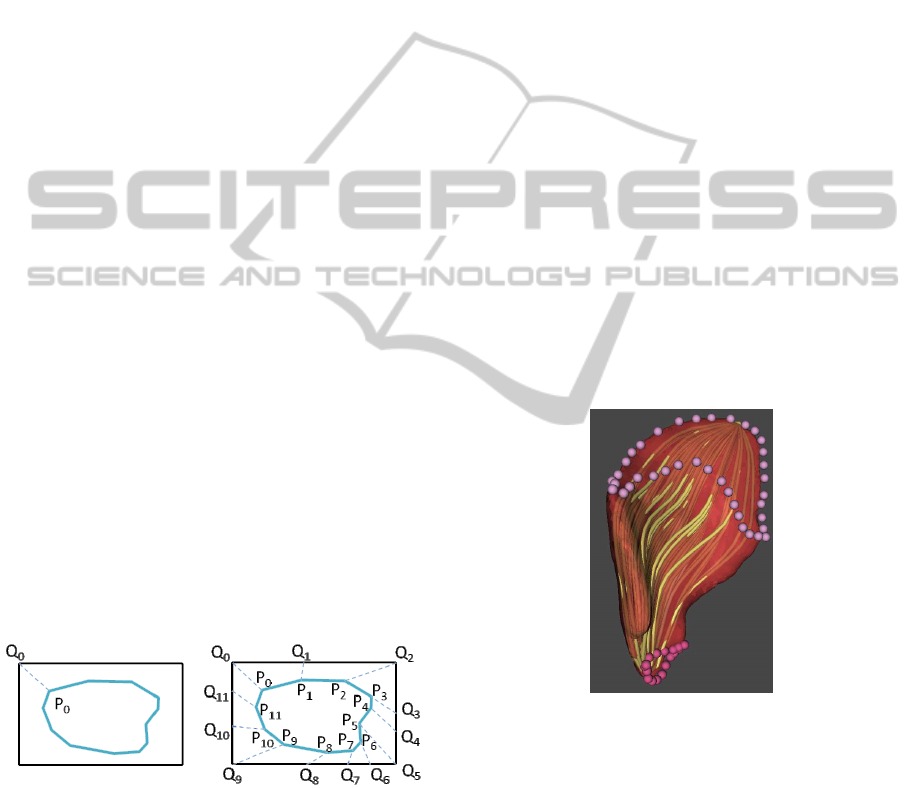
– see Figure 7.
Figure 7: Establishing correspondence between the rectan-
gle of the template and the muscle contour.
Hormann & Floater (Hormann and Floater, 2006)
proposed an approach that allows to express the co-
ordinates of the fibre poly-line point F
j
(where the
cutting plane has currently stopped) with respect to
the coordinates of the segmented rectangle as the sum
of λ
i
· Q
i
, where the λ
i
are real non-negative weights
such that their sum equals 1. Once the weights λ
i
are
computed, the new coordinates of the poly-line point
within the muscle contour P
0
...P
m
are simply given as
the sum of λ
i
· P
i
.
As the cutting of the muscle surface is clearly the
bottleneck of the decomposition, we process not only
all fibre poly-line points lying on the cutting plane but
also those in its close proximity. Hence, the minimal
number of slices used is equalled to the specified res-
olution of fibres. Naturally, the worst-case number of
slices used is given as the requested number of fibres
times their resolution.
3.4 Fibres Filtering
The process described so far may produce fibres with
unrealistic paths close to their attachment areas. This
is a problem especially for muscles with large attach-
ment areas, as it is illustrated in Figure 8. Hence, we
need to change the path in the proximity of the at-
tachment area to better correspond with the reality.
To do so, we construct two cutting planes perpendic-
ular to the principal axis passing through the extremal
(in the direction of the principal axis) landmarks of
attachment areas. These planes are used to cut out
the unwanted parts of fibres, i.e., parts close used to
attachment areas – see Figure 9.
Figure 8: Muscle fibres of Gluteus Medius that were pro-
duced by the basic method without filtering.
In the next step, it is necessary to reconstruct the
missing parts of fibres. Having a fibre P
0
...P
m
whose
part in proximity of the insertion area must be recon-
structed, we add a new segment (P
m
,P
m+1
), where
P
m+1
is a new point such that it lies on the surface
of muscle, in the insertion area, and is closest the ray
defined by the segment (P
m−1
,P
m
). We note that the
extraction of triangles belonging to the insertion area
can be done by cutting out the larger part of the sur-
face at the place of surface contour defined by the
points obtained from projecting the landmarks onto
GRAPP 2012 - International Conference on Computer Graphics Theory and Applications
62
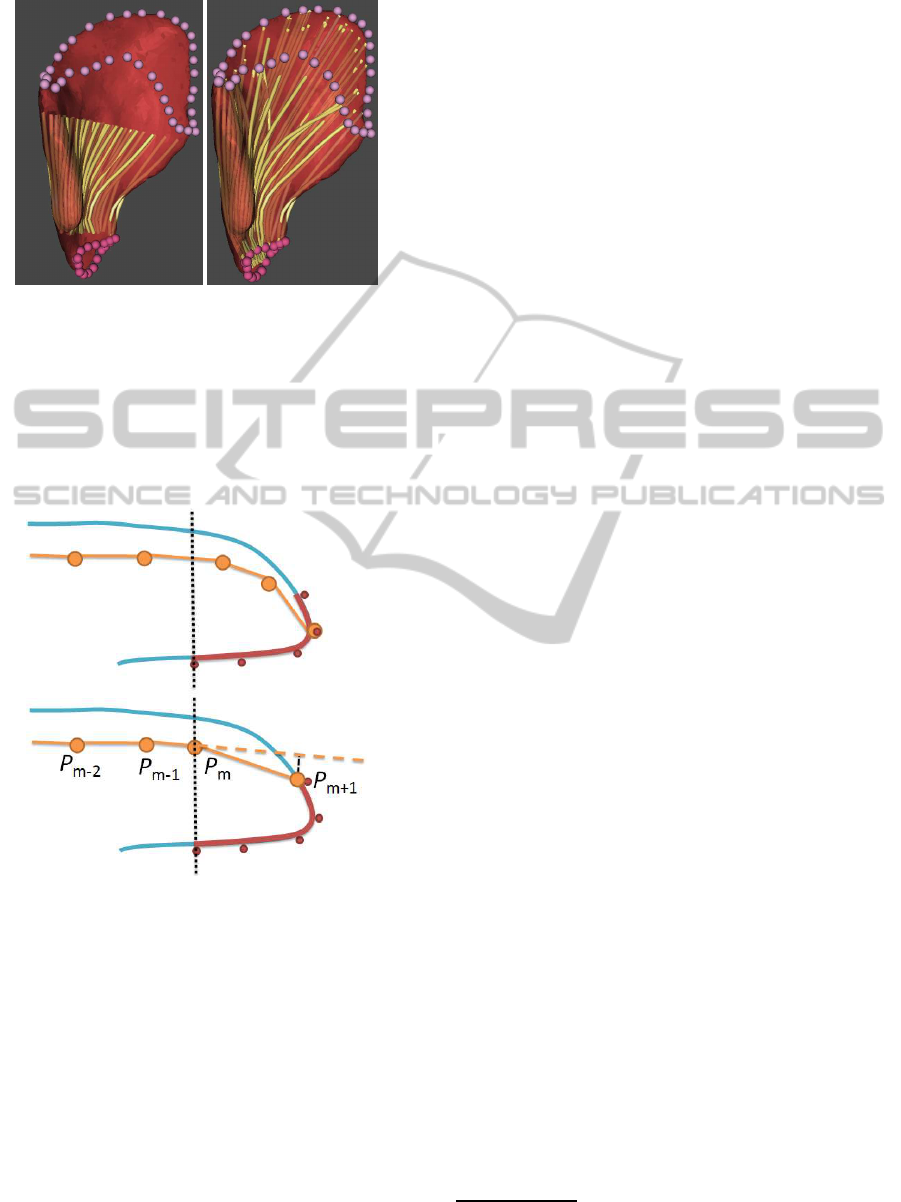
Figure 9: Muscle fibres of Gluteus Medius after their parts
close to the origin or insertion area were removed (left) and
reconstructed (right).
the surface of muscle. The reconstruction of the part
in the proximity of the origin area is similar. Figure 10
demonstrates the overall process. The result of recon-
struction could be seen in Figure 9.
Figure 10: Illustration of the trimming and reconstruction
of a fibre – fibres are yellow, the attachment area red, the
cutting plane is dotted black.
Clearly, the smoothness of the produced fibres de-
pends upon both the resolution and the shape of the
muscle. If the muscle model is coarse, perhaps due
to imprecise image data segmentation, as in the sar-
torius muscle shown in Figure 6, the fibres may be
too noisy, in which case the poly-lines may have to
be smoothed. We use an iterative process – the more
smoothing steps it takes, the smoother the poly-lines
become. At each step, the coordinates of the inner
points P
i
of the poly-line are modified according to
the equation: P
′
i
= (P
i−1
+k·P
i
+P
i+1
)/(k+2), where
k is a smoothing constant – we use 4.
The resulting smoothed muscle fibres can be then
visualise using any rendering technique for poly-lines
visualisation – we use a VTK (Schroeder et al., 2004)
filter that generates a tube (represented by a triangu-
lar surface mesh) of the given radius around each in-
put line segment. We also believe that these fibres can
be passed to any solver predicting lever arms char-
acteristics from the paths of the action lines, which,
in most cases, should bring an increased accuracy to
these predictions because the accuracy generally in-
creases with the number of input poly-lines passed to
the solver and whilst a muscle is typically represented
by a couple of action lines only (it is because action
lines cannot be constructed automatically), one could
easily generate an arbitrary number of fibres using the
proposed technique.
4 EXPERIMENTS AND RESULTS
Our approach was implemented in C++ (MS Visual
Studio 2010) under the Multimod Application Frame-
work – MAF (Viceconti et al., 2004), which is a vi-
sualisation system based mainly on VTK (Schroeder
et al., 2004) and other specialised libraries. This
framework is designed to support the rapid develop-
ment of biomedical software. It is particularly useful
in multimodal visualisation applications, which sup-
port the fusion of data from multiple sources and in
which different views of the same data are synchro-
nised, so that when the position of an object changes
in one view, it is updated in all the other views. Our
implementation was integrated into the MuscleWrap-
ping software
1
, which is a part of the larger LHP-
Builder software being developed within the VPHOP
project (VPHOP, 2010). We tested our implementa-
tion on various real data sets of muscles with typical
sizes about 15K vertices on Intel Core i7 2.67 GHz,
12 GB DDR3 1.3GHz RAM with Windows 7 Pro x64.
Figure 11 and Figure 12 show the results of de-
composition of muscles into a chaff of fibres and com-
pares them with fibres illustrated in anatomical at-
lases. Parallel fibres were generated for all muscles
apart from semimembranosus, for which the pennate
fibre template was used (Blemker and Delp, 2005).
Figure 13 shows the wrapping of a small se-
lected set of muscles (sartorius, rectus femoris, bi-
ceps femoris and semimembranosus) at frames t =
0.00, 0.25, 0.50 and 0.75 of the walk sequence of 1.56
s produced by our wrapping method (Kohout et al.,
2011). Fifty parallel fibres represented by poly-lines
1
http://graphics.zcu.cz/Projects/Muskuloskeletal-
Modeling
MUSCLE FIBRES MODELLING
63
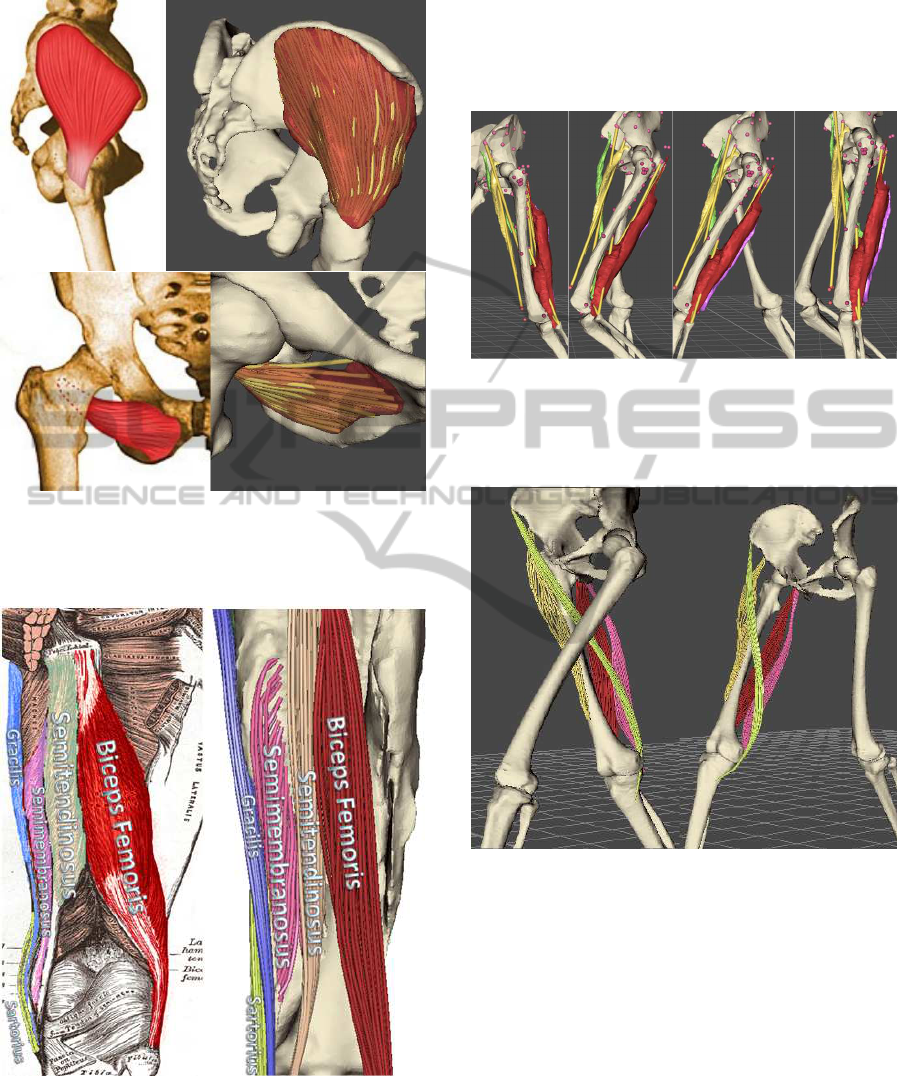
Figure 11: Comparison of generated fibres of Gluteus
Medius (top) and of Obturator Externus (bottom) with those
in Richardson’s anatomical atlas (Richardson, 2011).
Figure 12: Comparison of generated fibres of biceps
femoris (red), semitendinosus (orange), semimembranosus
(pink), gracilis (blue) and sartorius (light green) with those
in Gray’s anatomical atlas (Gray, 1918).
of 14 line segments were generated for all four mus-
cles considered – see Figure 14 – in about 300 ms per
frame, which makes the proposed method suitable for
interactivevisualisation, especially, if we take into ac-
count that our implementation could be easily paral-
lelized to run faster.
Figure 13: Four selected muscles (sartorius – green, rectus
femoris – yellow, biceps femoris – red and semimembra-
nosus – fuchsia) during the movement at frames t = 0.00,
0.25, 0.50 and 0.75.
Figure 14: Fibres of four selected muscles (sartorius –
green, rectus femoris – yellow, biceps femoris – red and
semimembranosus – fuchsia) during the movement at two
different frames.
A comparison of visualisation of muscles using
our approach and using an online digital anatomical
atlas is brought in Figure 15. As this online atlas rep-
resents a muscle by a surface of a quite low level of
detail and its muscle fibres only as a texture mapped
onto the surface of the muscle, there cannot be doubt
that our method provides users with a more realistic
visualisation. We note that similar conclusions could
be drawn also for other anatomical atlases.
When we compare results produced by the method
by Blemker et al. (Blemkerand Delp, 2005) – see Fig-
ure 16 with our results – see Figure 17, it is clear that
GRAPP 2012 - International Conference on Computer Graphics Theory and Applications
64
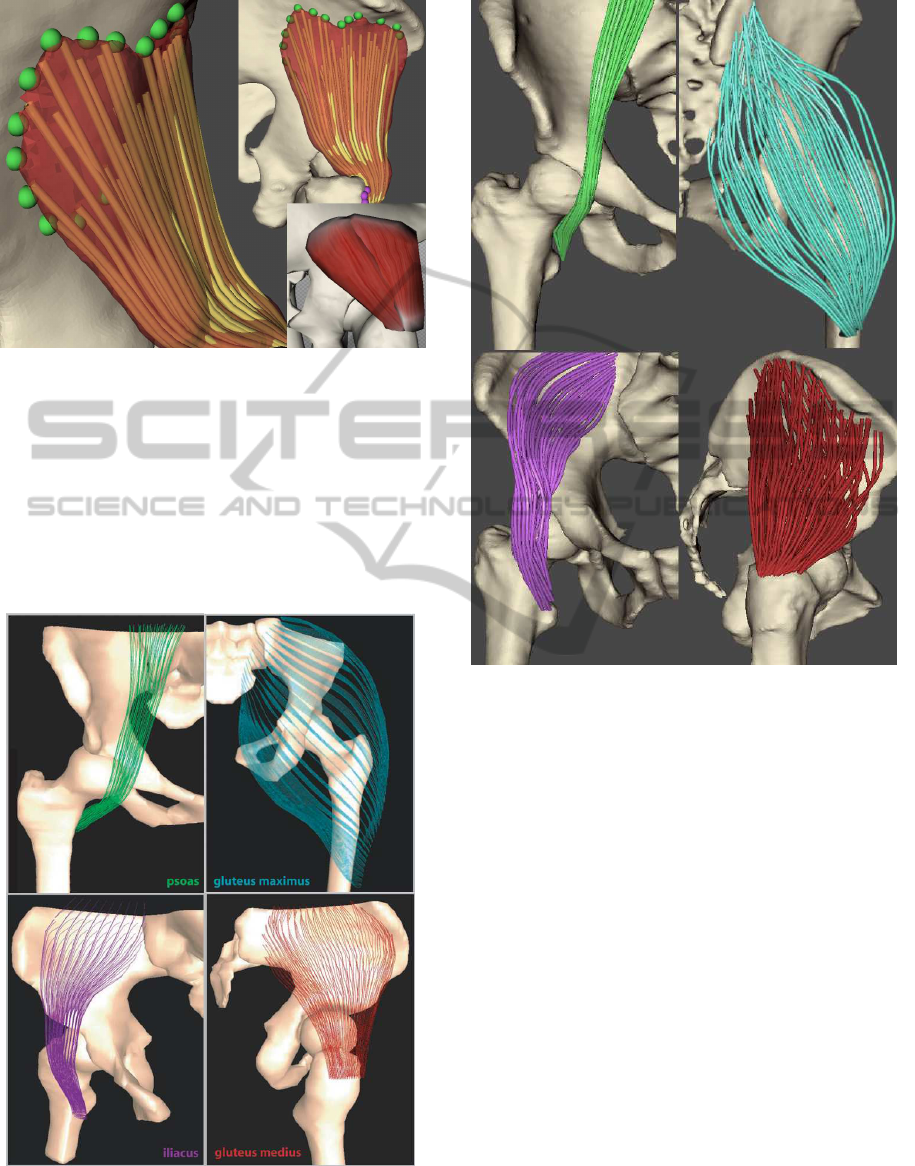
Figure 15: Our visualisation of gluteus minimus mus-
cle in comparison with the visualisation obtained from
http://www.biodigitalhuman.com/ online anatomical atlas
(bottom right corner).
although our method may produce unrealistic path for
a couple of fibres, the majority of produced fibres re-
semble those produced by its much slower, and, there-
fore, impractical, counterpart. This is also confirmed
by orthopedists with whom we cooperate.
Figure 16: Muscle fibres of psoas, gluteus maximus, illiacus
and glutes medius produced by the method by Blemker et
al. This figure was taken from (Blemker and Delp, 2005).
Figure 17: Muscle fibres of psoas, gluteus maximus, illiacus
and glutes medius produced by our method.
5 CONCLUSIONS
This paper has presented an approach that can auto-
matically generate an arbitrary number of muscle fi-
bres within the volume of muscle represented by its
surface in a convenient time. Although the main goal
of our work was to enhance educational tools used
by both medical experts and physiotherapists, we be-
lieve that, since the produced fibres quite well cor-
relate with those depicted in anatomical atlases (even
for muscles with large attachment sites), the fibres can
be used (instead of action lines) to predict the muscle
lever arm on the articular joints and the distribution of
fibre length (which is an input for the muscle force-
length-velocity relationship to define the boundaries
within which the force is constrained) with an ex-
pected accuracy somewhere in between predictions
provided by action-line methods and the more accu-
rate, but due to their large time-consumption imprac-
tical, finite-element methods. A biomechanical valid-
MUSCLE FIBRES MODELLING
65

ation is, however, still required. This is a part of
our future work. In the future, we would like also to
speed up the decomposition process by parallelization
to make it run in almost real time.
ACKNOWLEDGEMENTS
This work was supported by the Information Soci-
ety Technologies Programme of the European Com-
mission under the project VPHOP (FP7-ICT-223865).
The authors would like to thank the various people
who contributed to the realisation of the MAF and
LHPBuilder software and to various people who pro-
vided condition under which the work could be done.
REFERENCES
Aubel, A. and Thalmann, D. (2000). Efficient muscle shape
deformation. In IFIP, pages 132–142.
Blemker, S. S. and Delp, S. L. (2005). Three-dimensional
representation of complex muscle architectures and
geometries. Annals of Biomedical Engineering,
33(5):661–673.
Gray, H. (1918). Anatomy of the Human Body. Lea &
Febiger.
Hormann, K. and Floater, M. S. (2006). Mean value coor-
dinates for arbitrary planar polygons. ACM Transac-
tions on Graphics, 25(4):1424–1441.
Joe, S. and Kuo, F. Y. (2008). Constructing sobol se-
quences with better two-dimensional projections. So-
ciety, 30(5):2635–2654.
Kohout, J., Clapworthy, G. J., Martelli, S., Wei, H., Vice-
conti, M., and Agrawal, A. (2011). Fast muscle wrap-
ping. Computers & Graphics. Submitted for publica-
tion.
Kohout, J., Kellnhofer, P., and Martelli, S. (2012). Fast de-
formation for modelling of musculoskeletal system. In
Proceedings of Proceedings of the International Con-
ference on Computer Graphics Theory and Applica-
tions: GRAPP 2012.
Ng-Thow-Hing, V. (2001). Anatomically-based models for
physical and geometric reconstruction of humans and
other animals. PhD thesis, University of Toronto,
Canada.
Pohlschmidt, M. and Meadowcroft, R. (2010). Muscle dis-
ease: the impact. http://www.muscular-dystrophy.org,
Muscular Dystrophy Campaign.
Richardson, M. (2011). Muscle Atlas of the Extremities.
Amazon Whispernet.
Schroeder, W., Martin, K., and Lorensen, B. (2004). The
Visualization Toolkit, Third Edition. Kitware Inc.
Thalmann, L. P. N. D. (1998). Real time muscle defor-
mations using mass-spring systems. In Proceedings
Computer Graphics International, volume 98, pages
156–165. IEEE Comput. Soc.
Viceconti, M., Astolfi, L., Leardini, A., Imboden, S.,
Petrone, M., Quadrani, P., Taddei, F., Testi, D., and
Zannoni, C. (2004). The multimod application frame-
work. Information Visualisation, International Con-
ference on, 0:15–20.
VPHOP (2010). the osteoporotic virtual physiological hu-
man, http://vphop.eu.
GRAPP 2012 - International Conference on Computer Graphics Theory and Applications
66
