
DECODING SSVEP RESPONSES BASED ON PARAFAC
DECOMPOSITION
Nikolay V. Manyakov, Nikolay Chumerin, Adrien Combaz, Arne Robben, Marijn van Vliet
and Marc M. Van Hulle
Laboratory for Neuro- and Psychofysiology, K. U. Leuven, Herestraat 49, POBox 1021, 3000 Leuven, Belgium
Keywords:
Steady-state visual evoked potential, EEG, Parafac, Decoding.
Abstract:
In this position paper, we investigate whether a parallel factor analysis (Parafac) decomposition is beneficial
to the decoding of steady-state visual evoked potentials (SSVEP) present in electroencephalogram (EEG)
recordings taken from the subject’s scalp. In particular, we develop an automatic algorithm aimed at detecting
the stimulation frequency after Parafac decomposition. The results are validated on recordings made from 54
subjects using consumer-grade EEG hardware (Emotiv’s EPOC headset) in a real-world environment. The
detection of one frequency among 12, 4 and 2 possible was considered to assess the feasibility for Brain
Computer Interfacing (BCI). We determined the frequencies subsets, among all subjects, that maximize the
detection rate.
1 INTRODUCTION
Steady-state visual evoked potentials (SSVEPs) are
the brain responses to the repetitive presentation of
a visual stimulus (flickering stimulus) and are most
prominent in recordings made over the occipital cor-
tex. They reflect oscillations in electroencephalo-
grams (EEGs) at frequencies that are integer multi-
pliers (harmonics) of the stimulation frequency, given
that the latter is at a sufficiently high rate (starting
from 6 Hz) (Herrmann, 2001). This means that, when
a subject is looking at a stimulus flickering at fre-
quency f
1
, one can observe in the recordings a marked
increase in the amplitude at f
1
, 2 f
1
, 3 f
1
,.... This
neurophysiological phenomena could be used, for ex-
ample, to construct a brain-computer interface (BCI):
when using several stimuli flickering at different fre-
quencies, it is possible to detect at which stimulus the
subject is gazing at one only by analyzing the EEG
recordings (Gao et al., 2006; Manyakov et al., 2010;
Segers et al., 2011; Chumerin et al., 2011). To this
end, a detection algorithm is needed that monitors the
frequency spectrum in search of these stimulation fre-
quencies and their harmonics, and decides which one
is most prominent (classification). But, since the am-
plitude of a typical EEG signal decreases as 1/ f in the
spectral domain, the higher harmonics become less
prominent. Additionally to this, SSVEP responses are
embedded into other on-going brain activity (for ex-
ample, alpha waves are normally present in record-
ings over the occipital pole) and noise. To overcome
these problems, appropriate preprocessing and decod-
ing algorithms are needed. Also for this reason, mul-
tiple EEG channels are considered to be beneficial for
SSVEP analysis. For example, in (Gao et al., 2006)
the authors show that a suitable bipolar combination
of EEG electrodes suppresses noise, resulting in in-
crease in the signal-to-noise ratio (SNR). Similarly, a
weighted linear combination (spatial filtering) of the
signals coming from all available electrodes improves
the decoding performance (Friman et al., 2007).
In this position paper, we investigate the possi-
bility to consider a canonical polyadic decomposi-
tion known as parallel factor analysis (Parafac) (Bro,
1997; Cichocki et al., 2009), as a spatial filter-
ing procedure that separates information about al-
pha waves, noise and other disturbances present in
the EEG recordings to distinguish stimulus-related
SSVEP activity. Parafac has already proven itself for
epileptic seizure detection and localization (De Vos
et al., 2007; Acar et al., 2007), in the localiza-
tion of task-related activity (sources of theta and al-
pha waves) (Miwakeichi et al., 2004), artifact re-
moval (Acar et al., 2007), and so on. It was also used
in a BCI based on imagined movements (Cichocki
et al., 2008) but not much has been applied to SSVEP
443
V. Manyakov N., Chumerin N., Combaz A., Robben A., van Vliet M. and M. Van Hulle M..
DECODING SSVEP RESPONSES BASED ON PARAFAC DECOMPOSITION.
DOI: 10.5220/0003853604430447
In Proceedings of the International Conference on Bio-inspired Systems and Signal Processing (BIOSIGNALS-2012), pages 443-447
ISBN: 978-989-8425-89-8
Copyright
c
2012 SCITEPRESS (Science and Technology Publications, Lda.)

Figure 1: Emotiv’s EPOC headset.
BCI. We start with our EEG acquisition procedure,
then introduce our Parafac representation suitable for
SSVEP data, and discuss two different SSVEP detec-
tion techniques. We then validate our approach on
EEG data from 54 subjects and search for the best set
of discriminating stimulation frequencies, suited for
all subjects.
2 METHODS
2.1 EEG Data Acquisition
We recorded EEG data from 54 subjects during a pub-
lic event in a noisy room, crammed with all sorts of
wireless and other types of devices, which is quite
unlike a lab environment. Since we were testing on
a broad audience the applicability of SSVEP-based
BCI applications, we restricted ourselves to cheap
consumer-grade EEG equipment, with a minimal set-
up time. We used the EPOC headset (Fig. 1), devel-
oped by Emotiv
1
, consisting of 14 saline sensors. The
data were wirelessly transmitted to a computer at a
sampling rate of 128 Hz for each channel and a res-
olution of 14 bit/channel/sample. Since we wanted
to record from the occipital pole, we had to rotate the
EPOC by 180
o
(in the horizontal plane) before putting
it on the head of the subject. That was done because
the electrodes in the EPOC are intended to cover more
anterior regions. Since the EPOC is a one-size-fits-all
design, we cannot precisely describe the electrode lo-
cations for a given subject, since it strongly depends
on the geometry of the subject’s skull.
The experiment consists of an observation of a
flickering square with a red dot in its center, i.e. the
fixation point. The participants were asked to sim-
ply keep their gaze on the fixation point. The square
placed at the center of the screen was flickering at in-
creasing frequencies from 6 to 28 Hz in steps of 2
Hz, where each frequency was presented for 5 sec-
onds. As a result, we have EEG recordings for 12
1
http://www.emotiv.com
different stimulation frequencies (6,8,...,28 Hz). The
stimuli were shown on a laptop with a bright 15,4”
LCD screen, with a 60 Hz refresh rate.
2.2 Parafac
The Parafac model (Bro, 1997), as it used in this
study, can be seen as a linear decomposition of a
3-D array X
∈ R
N×M×K
into a sum of atoms X =
∑
R
i=1
a
i
◦ b
i
◦ c
i
+ E
, where a
i
, b
i
and c
i
are vectors, E
is a residual term, and ◦ the outer product. This means
that the components of S
= a◦ b◦ c are estimated ac-
cording to s
nmk
= a
n
b
m
c
k
. Since such a decompo-
sition is a trilinear one, it can be estimated through,
for example, an iterative alternating least-squares al-
gorithm. One of the parameter, which needs to be
tuned in this decomposition, is the number of atoms
R. It is important to find proper this parameter, since
Parafac model is not nested (the parameters of a three-
atom model are not the same as the parameters of a
two-atom model plus an additional component). For
our analysis, we used the core consistency diagnostic
(corcondia) (Bro and Kiers, 2003) to determine R.
2.3 Data Representation
The conventional way to construct the data represen-
tation X
, as described in (Miwakeichi et al., 2004;
De Vos et al., 2007; Acar et al., 2007; Cichocki et al.,
2008), is to perform a wavelet transform on each
channel (thus, leading to a scale∗ time representation
for each electrode), and further concatenate those 2-
D matrices along the additional (i.e., electrodes) di-
mension. This leads to a 3-D data array with dimen-
sions electrode∗scale∗time, where scale refers to the
wavelet scaling coefficient, which can be transformed
into the frequency domain. While such a representa-
tion of the data was proven to be useful for seizure
detection and localization, artifact correction, and so
on (De Vos et al., 2007; Acar et al., 2007), it is not ap-
plicable to our case, i.e., stimulation frequency detec-
tion in SSVEP responses. This is due to the Heisen-
berg uncertainty principle which states that it is not
possible to obtain a perfect localization of an event
in the time- and frequency domains simultaneously.
More rigorously this means that, for any function
f(t), with Fourier transform F(ω), and for concen-
tration measures in the time- (σ
2
t
=
R
∞
−∞
t
2
| f(t)|
2
dt)
and frequency (σ
2
ω
=
1
2π
R
∞
−∞
ω
2
|F(ω)|
2
dω) domains,
the inequality σ
t
σ
ω
≥ 1/2 applies. Since the wavelet
decomposition of signal is a linear expansion into the
frame of wavelets (with different positions and scale
coefficients), the frequency representation will fully
depend on the transformation of the basis wavelet.
BIOSIGNALS 2012 - International Conference on Bio-inspired Systems and Signal Processing
444
10 15 20 25
0
0.05
0.1
0.15
0.2
0.25
0.3
0.35
Stimulation frequency (Hz)
b
10 15 20 25
0
0.2
0.4
0.6
0.8
1
Stimulation frequency (Hz)
b
10 15 20 25
0
0.1
0.2
0.3
0.4
0.5
0.6
0.7
Stimulation frequency (Hz)
b
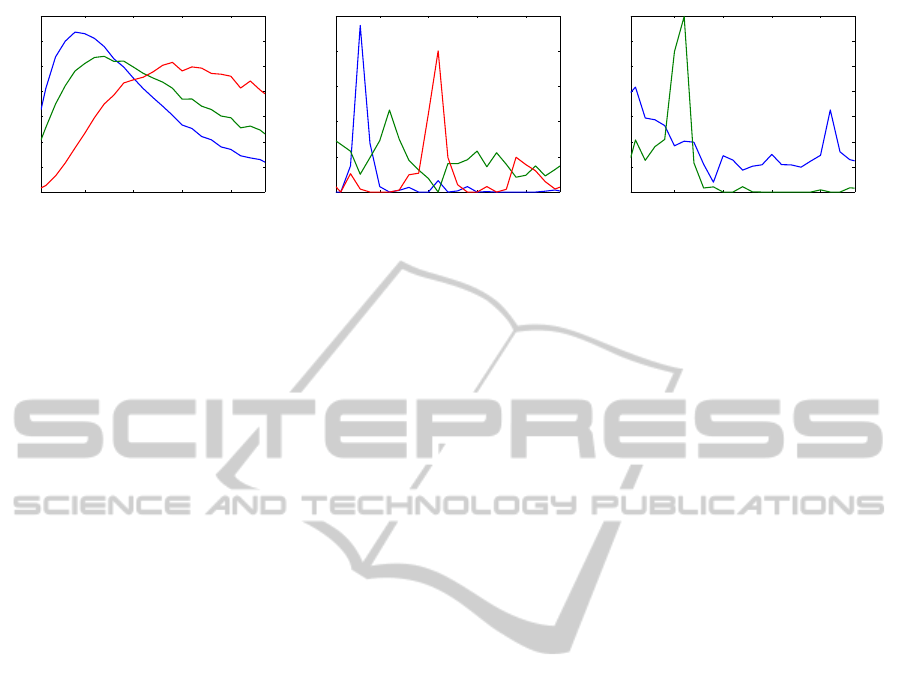
Figure 2: Frequency spectrum of Parafac atoms for subject 37 during 8 Hz (left and central) and 26 Hz (right) visual stimula-
tion. A wavelet decomposition with the Mexican hat wavelet was used for the (left) decomposition and a short time Fourier
transform for the (right and central) decompositions. Color indicates different atoms.
For a wavelet that has a limited support in time do-
main, thus for a small scaling factor (high frequency),
a “broad” frequency representation is obtained ac-
cording to the aforementioned uncertainty principle.
Thus, for the construction of an initial data array with
the use of the wavelet transform, we expect a blurred
representation of the frequency components of the ob-
tained atoms (vectors b
i
). As an example, one can
check Fig. 2 (left), where Parafac was applied for a 5s
EEG recording during a 8 Hz stimulation. The three
frequency spectra correspond to the oscillations at the
stimulation frequency (blue), the first harmonic (red),
and the alpha (green). As it can be seen, the spec-
trum for the higher frequency components becomes
“broader”. Additionally to this, peaks for each com-
ponents do not coincide with the previously assumed
frequency ranges. Thus, the construction of a 3-D
data representation based on the wavelet transform
will not generate a reliable information for decoding.
To overcome this problem, we have to decompose
the EEG signal on the basis of functions with more a
broader support in the time domain. Ideally, sin/cos
on the whole time axes will maximally narrow the
contribution in the frequency spectrum. But we can
not achieve this given the short time intervals of the
EEG signals of interest (5 s). Additionally to this,
we want to have several values (not one) along the
third (time) dimension of our data representation ar-
ray. Hence, we restrict ourselves to an ordinary short-
time Fourier transform with a Hamming window. In
this case, instead of a wavelet decomposition, we ob-
tain a spectrogram that was estimated based on a slid-
ing windowed Fourier transform. Thus, our EEG data
is transformed into a representation in terms of a 3-
D data array with dimensions electrode∗ frequency∗
time (14×25× 21, with 14 electrodes, 25 frequencies
considered (5,6,...,29 Hz) and 21 points in time, taken
as centers of windows). After performing a Parafac
decomposition on the same data as before, but now
with the 3-D representation just mentioned, we ob-
tain the results shown in Fig. 2 (central panel). It can
be seen that the estimated spectra from our 3 atoms
represent the expected frequency information more
closely. We can clearly detect the components respon-
sible for the stimulation frequency, the first harmonic
and alpha activity, and the peaks are in accordance
with these frequencies. From such a transformation
we can clearly determine what is the flickering fre-
quency of the stimulus the subject is looking at (8 Hz
as in Fig. 2).
2.4 Decoding Strategy
Whereas in many cases, we can distinguish from a
visual inspection the component(s) that correspond
to the SSVEP paradigm, we still have to find a pro-
cedure that automatically detects the stimulation fre-
quency. One could assume that spatial information
(vectors a
i
) of the decomposed components would be
useful, as was reported in (Miwakeichi et al., 2004;
De Vos et al., 2007; Acar et al., 2007) for seizure de-
tection, artifact correction or the localization of some
brain processes. However,in our case, we do not have
precise information about the electrode positions (see
Sec. 2.1) and the SSVEP responses, together with the
frequently detected alpha waves occur over the same
part of the skull (i.e., occipital pole). Thus, spatial
information can only help to reject components that
are due to, for example, eye blinking, whenever this
would occur (eye blinking artifacts are expected for
more frontal regions). As a result, we can only con-
sider frequency information on its own. A straightfor-
ward way to arrive at an automatic detection is to con-
clude about the stimulation frequency from the ones
with the maximal spectra in each component. From
the example discussed above (see Fig. 2 (central)),
we are able to detect 8 Hz (from the “blue” compo-
nent), 16 Hz (“red”) and 11 Hz (“green”), and con-
clude about an 8 Hz visual stimulation. Since the first
harmonic and/or alpha wave are not always present,
DECODING SSVEP RESPONSES BASED ON PARAFAC DECOMPOSITION
445
10 15 20 25
0
20
40
60
80
100
Stimulation frequency (Hz)
Accuracy (%)
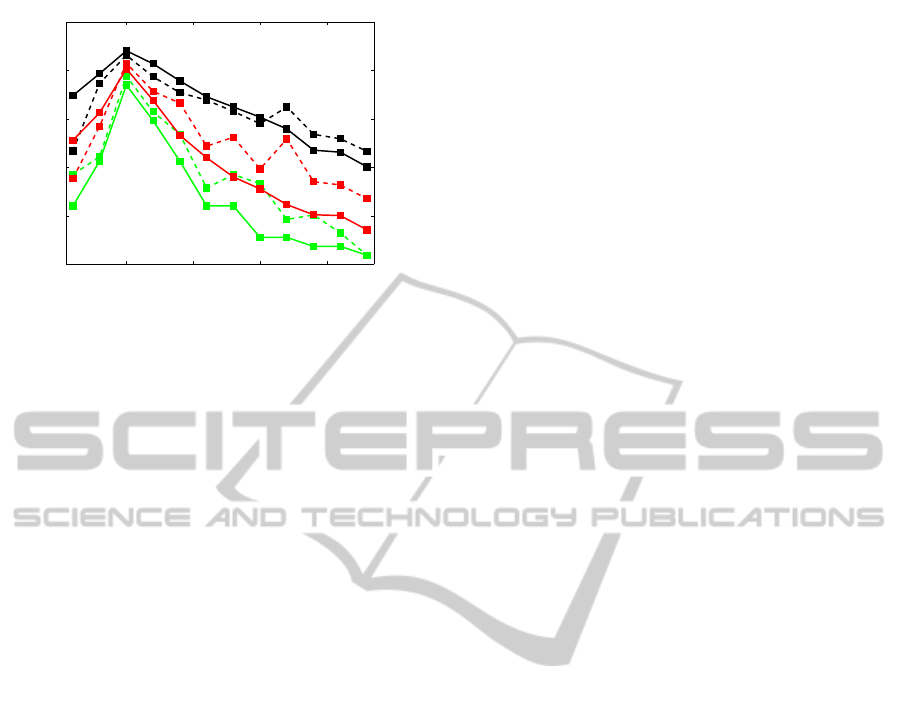
Figure 3: Averaged, over all subjects, detection accuracy vs.
frequency in the case of all possible 2 (black), 4 (red) and
12 stimuli (green) combinations. Dashed lines correspond
to ”sharpness method”, solid lines to “maximum method”.
the detection becomes simple, as we avoid any autom-
atized logical conclusion. Also, for the case where the
stimulation frequency coincides with the alpha band,
the situation become even more simple. But a global
maximum not always leads to a correct conclusion.
For example, in Fig 2 (right) the frequency spectrum
is shown of the atoms, after Parafac decomposition,
for the EEG recorded for the same subject, as before,
but during 26 Hz stimulation. While the alpha com-
ponent could be determined by the global maximum
(green line with a peak at 11 Hz), the frequency of
the SSVEP component (blue line) will be misclassi-
fied in favor of a lower frequency (in spite of a correct
visual assessment). Thus, instead of maximum val-
ues (or, better to say, maximal peak values), it would
be beneficial to use a statistic based, for example, on
the sharpness of the peak (here difference between
the peak value and a mean value of amplitudes in its
neighbors). In this case, the 26 Hz component will
be classified correctly. We will further refer to those
methods, as the “maximum method“ and the ”sharp-
ness method”.
3 RESULTS
First of all, we have visually inspected the Parafac
decomposition results for a number of subjects. The
conclusion is that components indeed reflect SSVEP-
related information, as it can be seen, for example,
in Fig. 2. But, as we are interested in an automatic
decoding, we classify the results of both proposed
methods for all possible 2, 4 and 12 stimuli combina-
tions. This means that, for example for the 2 stimuli
case, we assume that only two stimulation frequen-
cies are presented to the subject. Our detection pro-
cedure should identify only one of those two frequen-
cies. Only those recordings are considered for which
the subject is looking at the corresponding stimu-
lus. In the case of 12 stimuli, we investigate the cor-
rect identification of one among all possible frequen-
cies. In summary, by performing such a classification,
we assess whether the approach is feasible for brain-
computer interfacing when the subject can select one
of 2, 4 or 12 options.
Figure 3 shows the averaged, over all subjects,
detection accuracy for particular frequencies for the
three mentioned stimulus configurations, for both
proposed methods. The accuracy shown, for exam-
ple, at 10 Hz, for the 2 stimulus combination, means
that we have checked all possible pairs of stimuli con-
taining 10 Hz and estimated the averaged detection
accuracy of 10 Hz for all such pairs and all subjects.
As it can be seen, the stimulation at 10 Hz is the
best detectable one irrespective of the cardinality of
the stimulus configuration. If we look for the best
(in terms of the detection accuracy, among all sub-
jects) pair of stimulation frequencies, we see that it
is 8 and 10 Hz (a classification accuracy of 83.33%
for the “sharpness method” and 85.19% for the “max-
imum method”), and the best quadruple is for 8, 10,
12, and 14 Hz (a classification accuracy of 69.44%
for the “sharpness method” and 59.72% for the “max-
imum method”).
4 DISCUSSION AND
CONCLUSIONS
We verified the feasibility of a Parafac decomposi-
tion for the detection of the stimulation frequency
in SSVEP responses of 54 subjects. The motiva-
tion to use Parafac came from a visual inspection of
the frequency spectra of the atoms of the decomposi-
tion. It learned us that the quality of the spectra did
not depend on any constrains put on the components
in the decomposition (as, for example, nonnegativ-
ity). However, when considering the Parafac results
for an automatic classification procedure still much
improvement is needed to increase the stimulus fre-
quency detection performance. This is a topic for fur-
ther research.
The Parafac decomposition was applied to the
SSVEP detection problem as another way to con-
struct a spatial filter which takes information form all
channels simultaneously for achieving a better signal-
to-noise ratio. Since spatial filtering was proven
to boost the SSVEP detection performance (Friman
et al., 2007), we can say that Parafac is a logical next
step. Since it not only provides a convenient way to
BIOSIGNALS 2012 - International Conference on Bio-inspired Systems and Signal Processing
446

estimate a spatial filter, Parafac also takes into account
the time varying information represented along time
axis, in its 3-D data array representation. Thus, in
comparison to other spatial filters, Parafac offers the
unique possibility to consider time-varying SSVEP
responses, which can be viewed as an advantage: the
subject is not expected to always keep the same level
of concentration on the stimulus, but rather to become
disturbed and tired. The latter could be verified with
the presence of a temporary high alpha power in the
recordings.
One can argue against Parafac since the classifi-
cation accuracy is not much higher when considered
for BCI. But we want to point out that we showed
the classification results for the frequency pair and
quadruple that performed, on average, best among all
subjects. This means that it is a default setting in-
tended to be suited for a broad group of subjects. The
best set of frequencies is expected to be subject de-
pendent (for some subjects the SSVEP responses are
best at lower, for others at higher frequencies, and
even for some subject no detection performance could
be achieved (so called BCI illiteracy)). This was also
observed in our experiment, where the frequencies
leading to the highest detection accuracy were subject
dependent. Thus, for a particular subject we can find
the best frequencies through some calibration proce-
dure (scanning of the SSVEP responses to different
stimulation frequencies) and then construct the de-
coder based on them.
Another point of concern, when applying the de-
scribed methods to BCI, is that Parafac relies on an
iterative procedure for determining the coefficients of
the decomposition. This makes Parafac not suited for
real-time applications, however, we hasten to add that
adaptive algorithms for Parafac decomposition have
already been described, bringing on-line applications
within reach (Nion and Sidiropoulos, 2009).
As a conclusion, we can say that Parafac is po-
tentially useful for SSVEP detection, and for SSVEP-
based BCI, but further research is required to improve
the detection accuracy.
REFERENCES
Acar, E., Aykut-Bingol, C., Bingol, H., Bro, R., and Yener,
B. (2007). Multiway analysis of epilepsy tensors.
Bioinformatics, 23(13):i10.
Bro, R. (1997). Parafac. Tutorial and applications. Chemo-
metrics and intelligent laboratory systems, 38(2):149–
171.
Bro, R. and Kiers, H. (2003). A new efficient method for de-
termining the number of components in Parafac mod-
els. Journal of Chemometrics, 17(5):274–286.
Chumerin, N., Manyakov, N., Combaz, A., Robben, A.,
van Vliet, M., and Van Hulle, M. (2011). Subject-
adaptive steady-state visual evoked potential detection
for brain-computer interface. In The 6th IEEE Inter-
national Conference on Intelligent Data Acquisition
and Advanced Computing Systems: Technology and
Applications (IDAACS2011), pages 369–373.
Cichocki, A., Washizawa, Y., Rutkowski, T., Bakardjian,
H., Phan, A., Choi, S., Lee, H., Zhao, Q., Zhang,
L., and Li, Y. (2008). Noninvasive BCIs: Multiway
signal-processing array decompositions. Computer,
41(10):34–42.
Cichocki, A., Zdunek, R., Phan, A., and Amari, S. (2009).
Nonnegative matrix and tensor factorizations: appli-
cations to exploratory multi-way data analysis and
blind source separation. Wiley.
De Vos, M., De Lathauwer, L., Vanrumste, B., Van Huf-
fel, S., and Van Paesschen, W. (2007). Canonical de-
composition of ictal scalp EEG and accurate source
localisation: Principles and simulation study. Compu-
tational Intelligence and Neuroscience, 2007:1–8.
Friman, O., Volosyak, I., and Gr¨aser, A. (2007). Multiple
channel detection of steady-state visual evoked poten-
tials for brain-computer interfaces. IEEE Transactions
on Biomedical Engineering, 54(4):742–750.
Gao, Y., R., W., X., G., B., H., and S., G. (2006). A practical
VEP-based brain-computer interface. IEEE Transac-
tions on Neural Systems and Rehabilitation Engineer-
ing, 14(2).
Herrmann, C. (2001). Human EEG responses to 1–100 Hz
flicker: resonance phenomena in visual cortex and
their potential correlation to cognitive phenomena.
Experimental Brain Research, 137(3):346–353.
Manyakov, N., Chumerin, N., Combaz, A., Robben, A., and
Van Hulle, M. (2010). Decoding SSVEP Responses
Using Time Domain Classification. In Proc. of the
International Conference on Fuzzy Computation and
2nd International Conference on Neural Computa-
tion, pages 376–380.
Miwakeichi, F., Martinez-Montes, E., Vald´es-Sosa, P.,
Nishiyama, N., Mizuhara, H., and Yamaguchi, Y.
(2004). Decomposing EEG data into space-time-
frequency components using parallel factor analysis.
NeuroImage, 22(3):1035–1045.
Nion, D. and Sidiropoulos, N. (2009). Adaptive algo-
rithms to track the Parafac decomposition of a third-
order tensor. IEEE Transactions on Signal Processing,
57(6):2299–2310.
Segers, H., Combaz, A., Manyakov, N., Chumerin, N.,
Vanderperren, K., Van Huffel, S., and Van Hulle, M.
(2011). Steady state visual evoked potential (SSVEP)-
based brain spelling system with synchronous and
asynchronous typing modes. In 15th Nordic-Baltic
Conference on Biomedical Engineering and Medi-
cal Physics (NBC 2011), IFMBE Proceedings, vol-
ume 34, pages 164–167.
DECODING SSVEP RESPONSES BASED ON PARAFAC DECOMPOSITION
447
