
FOOD REGION DETECTION USING
BAG-OF-FEATURES REPRESENTATION AND COLOR FEATURE
Ruiko Miyano, Yuko Uematsu and Hideo Saito
Keio University, 3-14-1 Hiyoshi, 223-8522 Kohoku-ku, Japan
Keywords:
Food Region Detection, Bag-of-Features, Visual Words, Color Feature, SURF, Support Vector Machine.
Abstract:
Food image processing has recently attracted attention, because many people take photos of food. For food
image processing, recognition of captured food is an essential technology, but region detection of the food
area from captured photos is also very important procedure for food recognition. In this paper, we propose a
novel method for automatic region detection of food from photos using two kinds of features in input image.
To detect food regions, we use a method which is widely used in generic object recognition. We divide an
image into small subregions and represent each subregion as Bag-of-Features representation using local feature
descriptors and color feature. Using two features, we recognize food subregions and finally connect them as
food regions. Our experiments show that the proposed method can detect food region in high accuracy.
1 INTRODUCTION
In recent years, the number of camera users has in-
creased because digital cameras are very popular con-
sumer products. Since a human face is the most pop-
ular subject captured with the consumer digital cam-
eras, techniques for face detection have been exten-
sively developed. As well as human faces, food is
also targeted when recording food logs or memoriz-
ing special moments of travel. Additionally, there are
some applications which make food appearance more
delicious in a photo. For these reasons, food is the
subject frequently taken in everyday life.
Some researches dealing with food images have
attracted attention in recent years. Especially, au-
tomatic food image recognition is important as the
generic object recognition. Such systems aim to clas-
sify unknown food images and estimate volume, nu-
trition and so on. Using these systems, people who
often take a photo of food can easily analyze their
photos, and people can easily record everyday food
from photos.
However, these researches have some problems.
In these researches, food is located in the entire screen
or food region is estimated based on circle detection.
When there are several plates in the captured image,
therefore, they have to cut out the regions of food in
advance. Moreover, if the plate does not have circle
shape, plate detection based on circle detection will
fail. Therefore, we aim to automatically and precisely
detect food regions from single image.
2 RELATED RESEARCH
Joutou et al. proposed a food image recognition sys-
tem for 50 kinds of food images (Joutou and Yanai,
2009). They extract Bag-of-Features (BOF), color
histogram and Gabor texture feature, and then ap-
ply Multiple Kernel Learning (MKL) method to those
features in order to classify query images into 50 cat-
egories. Yang et al. proposed a fast food image recog-
nition system (Yang et al., 2010). They use pair-
wise statistics which represents geometric relation-
ship such as distance and orientation between many
pairs of local features. Puri et al. proposed a food in-
take assessment system which recognizes food types
and estimates volumes and nutrition information (Puri
et al., 2009). They recognize food types by using
color feature and texture feature, and estimate vol-
umes by 3D reconstruction.
There are many researches about object detec-
tion. Most popular research is face detection (Vi-
ola and Jones, 2004). Face detection is implemented
in most digital cameras, which is used to lock fo-
cus and adjust flash. To detect face region, they use
Haar-like feature which considers characteristic pat-
terns of human faces. On the other hand, food images
do not have such particular characteristic patterns be-
cause foods have several colors, shapes and ingredi-
ents. Therefore, we focus on a method used in generic
object recognition. To detect object region based on
generic object recognition, it is useful to use subwin-
dow (Lampert et al., 2009; Wei and Tao, 2010).
709
Miyano R., Uematsu Y. and Saito H..
FOOD REGION DETECTION USING BAG-OF-FEATURES REPRESENTATION AND COLOR FEATURE.
DOI: 10.5220/0003854507090713
In Proceedings of the International Conference on Computer Vision Theory and Applications (VISAPP-2012), pages 709-713
ISBN: 978-989-8565-03-7
Copyright
c
2012 SCITEPRESS (Science and Technology Publications, Lda.)
In generic object recognition, we need to com-
pare a query image to pre-trained images. To effec-
tively compare them, the images have to be repre-
sented as low-dimensional data. The BOF representa-
tion (Csurka et al., 2004) using local feature descrip-
tors and color information (Swain and Ballard, 1991)
are most general methods.
In our proposed method, we do not recognize
types of foods but detect regions where the food is
located in a single photo. We employ sliding window
approach that slides target subregion to detect food
regions. For recognizing a subregion as food or not,
BOF representation and color feature are applied.
3 PROPOSED METHOD
In this paper, we propose a method to automatically
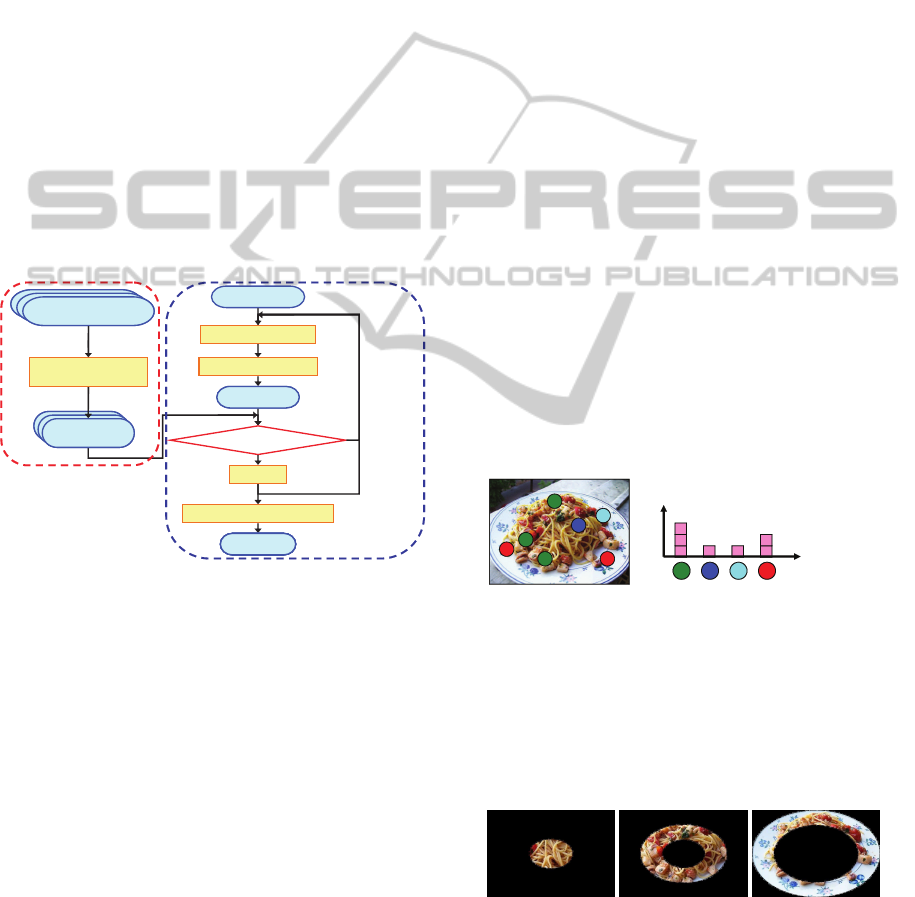
detect food regions from a single image. Fig. 1 shows
the overview of our proposed method. Our method
consists of two phases: training and detection.
Training ImageTraining Image
Feature Extraction
HistogramHistogram
Training phase
Detection phase
No
Yes
Next
Subregion
Query Image
Query Subregion
Result
Connect Food Subregion
Histogram
Feature Extraction
Vote
Food Subregion?
Result
Connect Food Subregion
Vote
Result
Connect Food Subregion
Food Subregion?
Vote
Result
Connect Food Subregion
Histogram
Food Subregion?
Vote
Result
Connect Food Subregion
Figure 1: Overview.
In training phase, we extract two kinds of image
features, which are BOF representation and color fea-
ture, from training images (730 food images). The
food categories which can be detected depend on
training images. We collected eight kinds of food,
which are pasta, salad, curry, hamburger, ramen,
pizza, rice omelet and okonomiyaki.
In detection phase, we cut out a subregion from
a query image as a query subregion, and extract two
image features from the query subregion in the same
way as training phase. The size of a subregion is
200 × 200 pixels and we slide a subregion with 20
pixels. The subregion recognized as food using the
image features is called a food subregion. We slide
a query subregion around the query image and con-
nect only food subregions as food region in the query
image.
3.1 Features
In this section, we explain two kinds of image fea-
tures. In contrast with human face images, food im-
ages do not have characteristic patterns. Therefore
we combine BOF representation using local feature
descriptors, and color feature in the image.
3.1.1 Bag-of-Features Representation
Local characteristic patterns in images are important
in generic object recognition. To utilize local char-
acteristic patterns, the BOF representation is widely
used. In this representation, an image is represented
as the distribution of feature descriptor vectors.
In training phase, we extract SURF from training
images, which are 100 food images and 100 non food
images , and cluster all feature points into 500 clus-
ters using K-Means++ method. Then we define the
centroids of 500 clusters as Visual Words.
We compute histogram of Visual Words in both
training and detection phase. We extract SURF from
training image or query subregion. Then we quantize
each feature point into 500 Visual Words (Fig. 2(a))
and count the number of occurrences (Fig. 2(b)). In
Fig. 2, the different visual words are represented by
different colors for the detected feature points. Fi-
nally, we normalize histogram using t f-id f weight-
ing. In this way, we compute Visual Word histogram,
which is so-called BOF representation.
(a) Visual Words
visual word
frequency
(b) Histogram of visual words
Figure 2: BOF representation.
3.1.2 Color Feature
Not only local feature points but also color informa-
tion is important in food images, because most of
foods consists of ingredients that have specific colors.
Figure 3: Three parts for color feature.
To extract color feature, we divide an image into
3 parts concentrically as shown in Fig. 3. This is be-
cause most foods are placed in a circle. We also divide
VISAPP 2012 - International Conference on Computer Vision Theory and Applications
710
RGB brightness into 4 parts. Then we create 64-bin
color histogram from each parts. Totally, we extract a
192 dimensional color feature from each image.
3.2 Recognition
In this section, we explain the method to recognize
subregions as food in a query image. For the recog-
nition, our method compares two image features be-
tween each query subregion and training images. We
propose two methods to compare these image fea-
tures. One is histogram intersection and the other is
Support Vector Machine (SVM).
3.2.1 Histogram Intersection
First, we explain the method to compute similarity of
image features using histogram intersection (Swain
and Ballard, 1991). We compute the histogram in-
tersection for each histogram between the query sub-
region and the training images, and compute the aver-
age of two histogram intersections. If the average is
larger than a pre-defined threshold, these two images
are regarded as similar images.
We calculate histogram intersection between one
query subregion and all training images, and count
the number of similar images. If the number of sim-
ilar images is larger than a pre-defined threshold, the
query subregion is recognized as food subregion.
3.2.2 Support Vector Machine
Second, we explain the method to classify query sub-
regions into categories of food using SVM. SVM is
one of the common classification methods that has
high generalization performance, even the dimension
of data is very high. The simplest SVM can classify
data into two classes. It needs known positive data
and negative data, and estimates hyperplane which
correctly divides these data into two classes.
In training phase, we create 2-class SVM classifier
for each food category and each feature using training
images, which are 730 food images and 100 non food
images. In detection phase, we predict class of query
subregion using SVM classifiers created in training
phase.
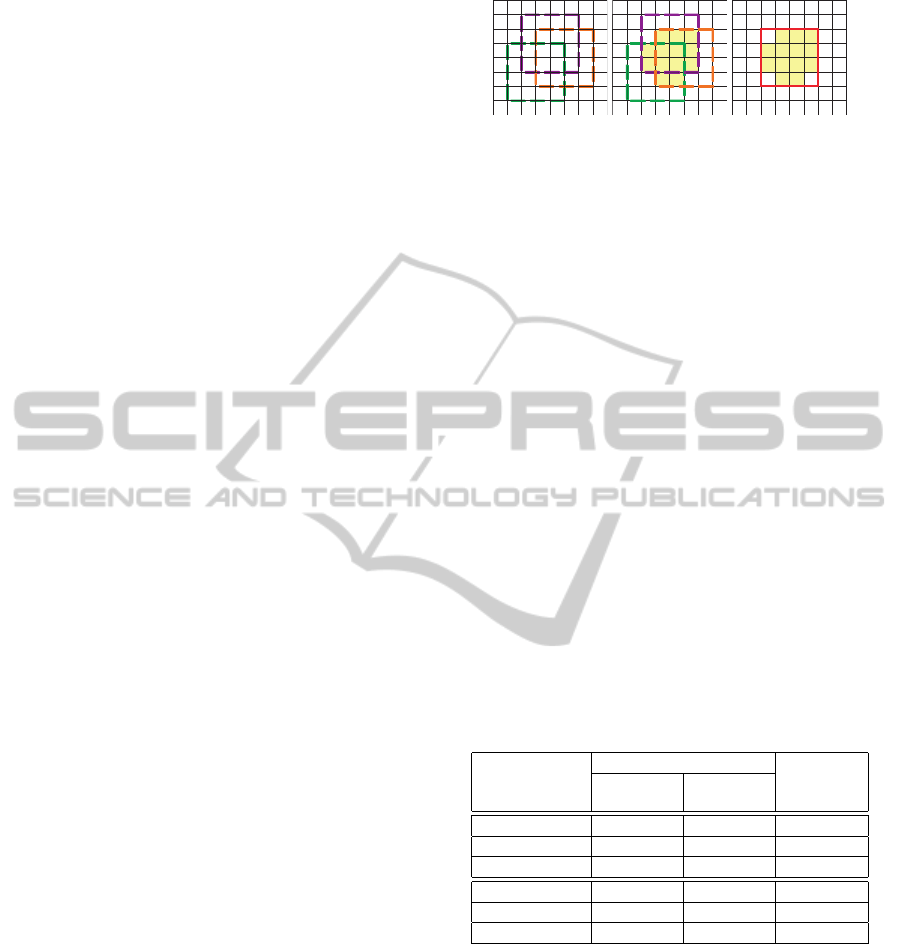
3.3 Connection of the Food Subregions
In this section, we explain the method to connect the
food subregions.
In section 3.2, we recognize several food subre-
gions by the sliding window recognition. We vote for
all pixels included in the food subregions as show in
Fig. 4(a). If the voted count of each pixel is larger
1 1 1 1
1 2 2 2 1
1 2 3 3 2 1
1 2 3 3 2 1
1 1 2 2 1 1
1 1 1 1
(a)
1 1 1 1
1 1 1 1
1 1
1 1 1
(b) (c)
Figure 4: Connection of the food subregions.
than a pre-defined threshold, that pixel is regarded as
inside the food region, which is labeled as shown in
Fig. 4(b). Finally, as shown in Fig. 4(c), we draw the
bounding box of those pixels.
4 EXPERIMENTS
We carried out 2 experiments, which are evaluation of
two features and detection of food regions, to evaluate
our proposed method.
4.1 Evaluation of Two Features
In this experiment, we use 100 food images and 50
non food images as query images in order to evaluate
the effectiveness of two features; BOF representation
and color feature. Here, we do not cut out query sub-
regions via sliding window but create histograms of a
whole image and recognize a query image as food or
non food.
Table 1: The recognition results.
Correct answers
Food Non food
Accuracy
rate
BOF (HI) 91 / 100 40 / 50 87.3 %
Color (HI) 90 / 100 34 / 50 82.7 %
Both (HI) 96 / 100 38 / 50 89.3 %
BOF (SVM) 98 / 100 30 / 50 85.3 %
Color (SVM) 100 / 100 33 / 50 88.7 %
Both (SVM) 98 / 100 50 / 50 98.7 %
Table 1 shows the recognition results using both
approaches. It seems the combination of BOF rep-
resentation and color feature is effective because the
accuracy rates using both two features is 89.3% and
98.7 % which is larger than the results with a single
feature. We can also find that SVM approach is better
than histogram intersection approach because it has
general versatility. Histogram intersection approach
depends on training images because we compare a
query subregion and all training images. Therefore
it cannot be applied to data which is not included in
training images.
FOOD REGION DETECTION USING BAG-OF-FEATURES REPRESENTATION AND COLOR FEATURE
711
4.2 Detection of Food Regions
In this section, we show the result of food region
detection. We compare three methods, which are
circle detection, histogram intersection and SVM.
Histogram intersection and SVM are based on the
method explained in section 3.2. Circle detection is
used in Puri’s research (Puri et al., 2009). We recog-
nize detected circular regions as food after detecting
circle by Hough transform.
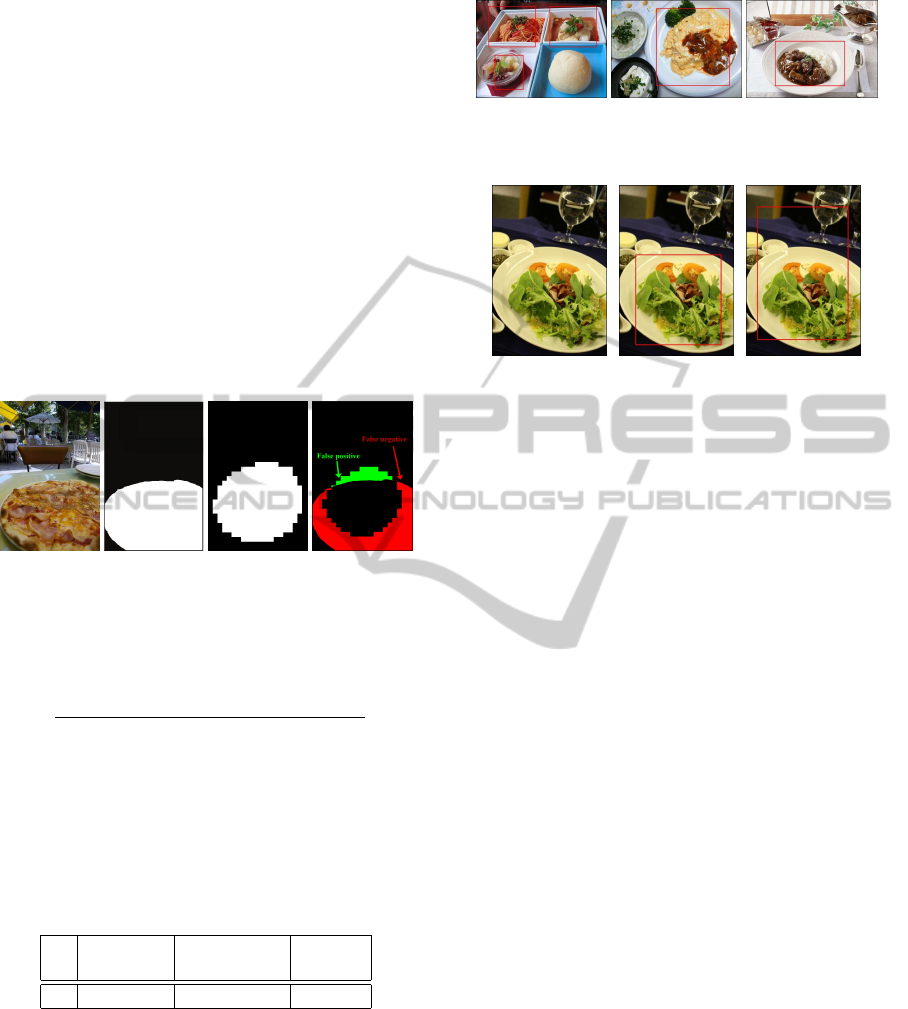
To compare them, we compute difference between
ground truth images and each detected image. Fig.
5(b) shows manually created ground truth image of
Fig. 5(a). Fig. 5(c) shows a mask of detection result.
And Fig. 5(d) shows the difference between Fig. 5(b)
and Fig. 5(c). Red region represents false negative,
and green region represents false positive.
(a) (b) (c) (d)
Figure 5: Computation of difference.
We computed false detection rate R according to
following equation
R =
false negative + false positive(pixel)
width× height(pixel)
. (1)
If ground truth image is same as detection result, dif-
ference is 0 %.
Table 2 shows the average of false detection rates
between each ground truth image and each detection
result (389 food images and 15 non food images).
Table 2: False detection rate.
Circle
detection
Histogram
intersection SVM
R 35.5 % 29.2 % 25.4 %
Fig. 6 shows the examples of detection result. Fig.
6(a) are based on histogram intersection approach.
Fig. 6(b), 6(c) are based on SVM approach. We can
see that food regions of our eight categories are al-
most detected from these images. We compare three
methods in Fig. 7. The food region can be detected
using histogram intersection and SVM, but it cannot
be detected using circle detection. In circle detection,
it depends on a shape of plate. For example, if the
plate is square, or whole plate is not in query image
(a) (b) (c)
Figure 6: Food region detection.
(a) Circle detection (b) Histogram in-
tersection
(c) SVM
Figure 7: Comparison of three methods.
like Fig. 7(a), detection will be fail. Therefore, our
sliding window approach is efficient, even the plate
has non circular shape.
5 CONCLUSIONS
We proposed an automatic detection method of food
regions from a single image. By using BOF repre-
sentation and color feature, we recognized subregions
as food or non food, and then all food subregions are
connected to create food regions.
We carried out two experiments to evaluate our
proposed method. First, we recognized whole query
image to evaluate the effectiveness of two features.
Because of combining two features, we achieved 98.7
% accuracy rate based on SVM approach. Second, we
applied our method to query images. We can auto-
matically detect food regions from query images due
to sliding window approach, and false detection rate
is 25.4 % based on SVM approach.
As future works, we plan to add more features
to increase recognition accuracy, improve the method
for connecting food subregions and extend training
images to increase categories of food.
ACKNOWLEDGEMENTS
A part of this research was supported by the Research
Grant of Keio Leading-edge Laboratory of Science &
Technology.
VISAPP 2012 - International Conference on Computer Vision Theory and Applications
712

REFERENCES
Csurka, G., Dance, C. R., Fan, L., Willamowski, J., and
Bray, C. (2004). Visual categorization with bags of
keypoints. In Workshop on statistical learning in com-
puter vision, ECCV, volume 1, pages 1–22.
Joutou, T. and Yanai, K. (2009). A food image recognition
system with multiple kernel learning. In Proc. of ICIP.
Lampert, C. H., Blaschko, M. B., and Hofmann, T. (2009).
Efficient subwindow search: A branch and bound
framework for object localization. IEEE Trans. on
PAMI, 31(12):2129–2142.
Puri, M., Zhu, Z., Yu, Q., Divakaran, A., and Sawhney, H. S.
(2009). Recognition and volume estimation of food
intake using a mobile device. In Proc. of WACV, pages
1–8.
Swain, M. J. and Ballard, D. H. (1991). Color indexing. In-
ternational Journal of Computer Vision, 7(1):11–32.
Viola, P. A. and Jones, M. J. (2004). Robust real-time face
detection. International Journal of Computer Vision,
57(2):137–154.
Wei, Y. and Tao, L. (2010). Efficient histogram-based slid-
ing window. In Proc. of CVPR, pages 3003–3010.
Yang, S., Chen, M., Pomerleau, D., and Sukthankar, R.
(2010). Food recognition using statistics of pairwise
local features. In Proc. of CVPR, pages 2249–2256.
FOOD REGION DETECTION USING BAG-OF-FEATURES REPRESENTATION AND COLOR FEATURE
713
