
VEHICLE SPEED ESTIMATION FROM TWO IMAGES
FOR LIDAR SECOND ASSESSMENT
Charles Beumier
Signal & Image Centre, Royal Military Academy, Avenue de la Renaissance 30, Brussels, Belgium
Keywords: Vehicle Speed, Stereo, Un-calibrated Camera, LIDAR.
Abstract: Vehicle speed control has been traditionally carried out by RADAR and more recently by LIDAR systems.
We present a solution that derives the speed from two images acquired by a static camera and one real
dimension from the vehicle. It was designed to serve the purpose of second assessment in case of legal
dispute about a LIDAR speed measure. The approach follows a stereo paradigm, considering the equivalent
problem of a stationary vehicle captured by a moving camera. 3D coordinates of vehicle points are obtained
as the intersection of 3D lines emanating from corresponding points in both images, using the camera
pinhole model. The displacement, approximated by a translation, is derived from the best match of
reconstructed 3D points, minimising the residual error of 3D line intersection and the deviation with the
known dimensions of the licence plate. A graphical interface lets the user select and refine vehicle points,
starting with the 4 corners of the licence plate. The plate dimension is selected from a list or typed in. More
than 100 speed estimation results confirmed hypothesis about the translation approximation and showed a
maximal deviation with LIDAR speed of less than +/- 10 % as required by the application.
1 INTRODUCTION
Speed control of vehicles on road has been
traditionally achieved by RADAR. This estimation
by active signals (time of flight for distance and
Doppler frequency shift for speed estimation) suffers
from possible signal double bounces and from the
presence of several vehicles in the quite large field
of view. The current technology also proposes
LIDAR systems which substitute the diffuse
RADAR beam by a sharp LASER spot that sweeps
the scene at a given elevation. Beside the reduced
influence of neighbouring scene objects the quality
of the LIDAR detector enables the identification of
the vehicle type thanks to profile analysis.
For law enforcement of vehicle speed, the quality
or precision of speed measurement is not the only
criterion for acceptance as a practical solution. An
alternative speed measurement may be required to
assess the estimated speed in case of legal dispute.
This second measurement has to be obtained from
an independent procedure, possibly less precise, but
approved by the national certification institute.
The literature about vehicle speed estimation
from camera reports solutions with one or several
images in which the vehicle is detected
automatically. In the case of a single image, image
blur around the moving vehicle is exploited to
estimate the vehicle motion in the time elapsed
corresponding to the camera shutter speed (Huei-
Yung and Kun-Jhih 2005). When a pair or sequence
of images is used, the moving vehicle displacement
is estimated and converted into real distance thanks
to camera and scene parameters. An explicit 3D
model is not necessary since information relevant to
the problem may be gathered, for instance, from the
common direction of motion and the statistics of
vehicle sizes (Dailey, Cathey and Pumrin, 2000).
But most systems have to identify the homography
between the image and the scene in order to convert
measured pixel distances into real velocities
(Grammatikopoulos, Karras and Petsa, 2005, Tocino
Diaz, Houben, Czyz, Debeir and Warzée 2009).
In the specific case of the LIDAR system LMS-
06 distributed by secuRoad SA (Belgium), two
cameras can capture up to two images each for
vehicle identification, with precise shooting time.
The idea arose to derive the vehicle speed from its
displacement between image pairs.
Compared to the RADAR or LIDAR technology,
speed estimation from images is much less
381
Beumier C..
VEHICLE SPEED ESTIMATION FROM TWO IMAGES FOR LIDAR SECOND ASSESSMENT.
DOI: 10.5220/0003855403810386
In Proceedings of the International Conference on Computer Vision Theory and Applications (VISAPP-2012), pages 381-386
ISBN: 978-989-8565-04-4
Copyright
c
2012 SCITEPRESS (Science and Technology Publications, Lda.)
expensive and reduces installation or maintenance
overhead (Kastrinaki, Zervakis and Kalaitzakis,
2003). Hardware requirements consist in a storage
and processing unit and in a camera needed anyway
for legal proof. Video-based systems, already
adopted for general traffic surveillance, will
probably emerge for speed enforcement in the near
future.
In the following, section 2 introduces the LIDAR
speed measurement. Section 3 details our approach
for speed estimation from a pair of optical images.
Section 4 describes the graphical interface while
section 5 presents the results for more than 100
speed tests. Section 6 concludes the paper.
2 LIDAR SPEED MEASUREMENT
For law enforcement, RADAR has been for a long
time the common system to control vehicle speed. It
is based on the Doppler shift of the frequency of an
emitted signal after reflection on the vehicle. The
major problem of RADAR systems is their
sensitivity to the environment (reflection from
nearby objects).
LIDAR is an acronym for Light Detection And
Ranging. Speed estimation is based on the time of
flight of a projected LASER beam converted into
distance (range). Early LIDAR solutions for law
enforcement used to be guns but nowadays systems
project a horizontal plane of LASER light to extract
a profile of distances.
The major advantage of the LIDAR is the ability
to analyse the 1-dimensional range information of
the profile returned by the scan. Vehicle profiles and
lane separation can be achieved so that vehicle types
and speed may be returned for each lane separately.
The analysis of successive range profiles enables the
estimation of the (quite instantaneous) speed.
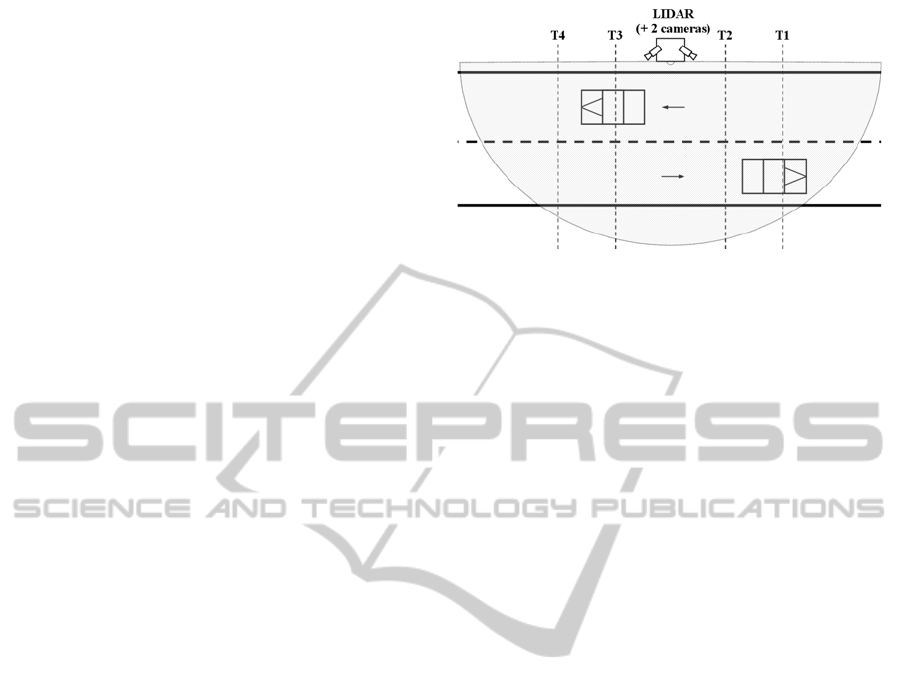
The LMS-06 system allows for the surveillance
of vehicles in both directions, thanks to the wide
laser scanner and the two cameras pointing in
opposite directions. This arrangement, depicted from
a top view in Figure 1, offers full flexibility for
capturing front or rear licence plates. For instance, a
common practice in Belgium is to measure speed
with the LIDAR when the vehicle arrives, but to
capture one or two images when the vehicle is
passed. This is indeed required to get an image of
the rear licence plate which is the official one for
legal proceedings in Belgium.
Our approach has been designed to offer a speed
second assessment from a pair of images captured
by the LIDAR system. These images serve the
Figure 1: Scheme of the LIDAR systems with two
cameras and image acquisition times Ti.
purpose of legal evidence for vehicle identification
thanks to the licence plate. They may be used in case
of legal dispute as an independent speed measure.
To be recognised as such by the Belgian national
certification institute, the speed deviation between
the two methods should be inferior to +/- 10%.
3 CAMERA SPEED ESTIMATION
As previously presented, the LIDAR system LMS-
06 disposes of two cameras pointing in opposite
directions, each possibly capturing up to two images
with a timestamp in millisecond. The challenge of
this research is to estimate the speed of a vehicle
visible in two images captured by one stationary
camera at two known times. To simplify the task,
several hypotheses were adopted.
A first reasonable hypothesis is to assume that
the camera is not modified between two captures. Its
position, orientation and intrinsic parameters are
supposed constant. This hypothesis is easily verified
by comparing the image position of static objects.
As our approach does not require camera calibration,
only pair of images with camera modification must
be rejected while pairs with the same moving object
can be processed for speed estimation.
The second set of hypotheses concerns the
vehicles which are supposed to be rigid bodies
describing a linear movement. The rigid body
constraint ensures that a clear solution exists for
motion estimation when considering a few vehicle
points. The hypothesis of movement equivalent to a
translation was based on observation and is justified
from the fact that rotations are negligible (Figure 2).
The roll angle is small as the system is never
placed in a turn. The pitch rotation may change if the
vehicle accelerates or brakes, breaking the next
assumption about constant speed. Mention that brake
lights or vehicle leaning can be checked for evidence
VISAPP 2012 - International Conference on Computer Vision Theory and Applications
382
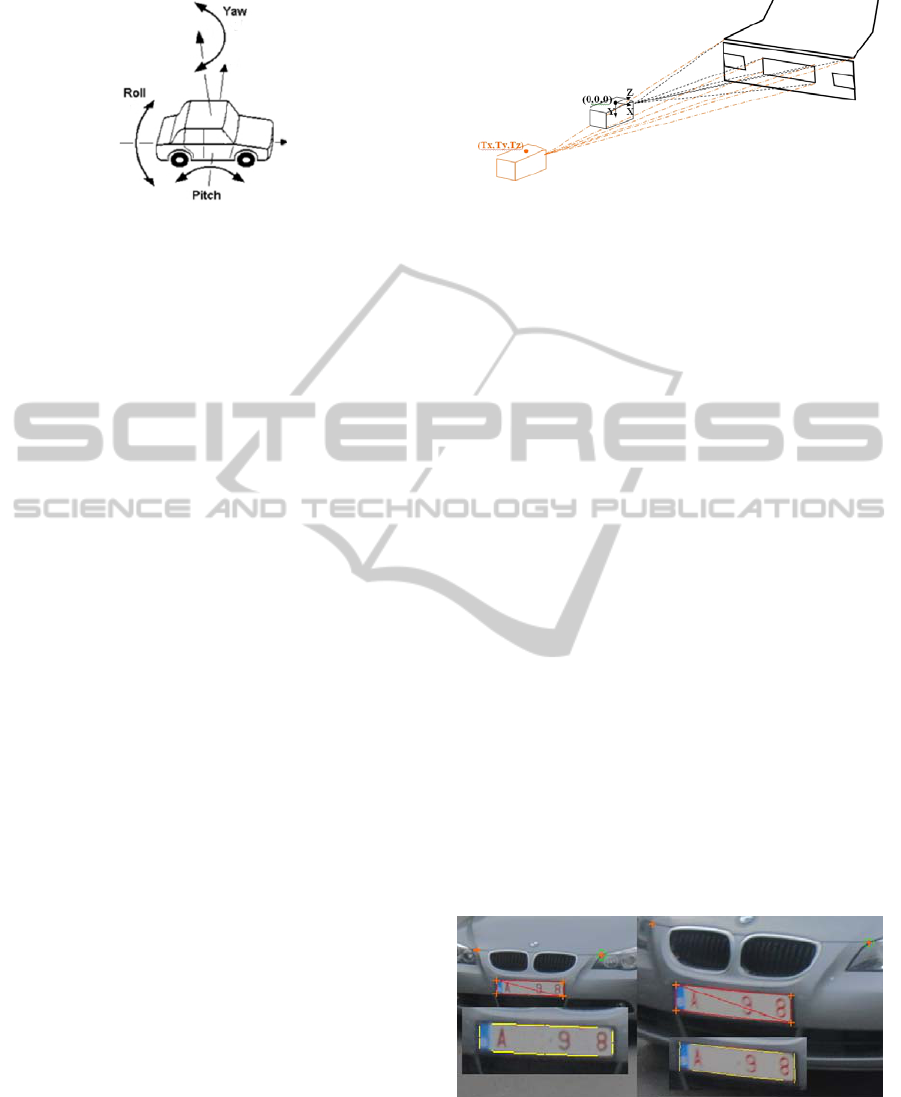
Figure 2: Angle definitions for a vehicle.
about pitch modification. The yaw angle may be
modified when changing lane, but with a limited
amplitude, as the majority of the speed remains
along the lane. Modelling motion with a translation
only requires three parameters, what leads with less
computation to a better optimum as dimensionality
reduction lowers the likelihood of local minima.
The hypothesis of constant speed is not strictly
required for the approach, but is assumed for the
evaluation of the camera based speed thanks to the
LIDAR measure. This is particularly important in
the case of images captured at T3 and T4 (Figure 1),
as the time elapsed since the LIDAR measure
(before T1) may amount to more than one second.
The usual driver’s behaviour which fools the
constant speed hypothesis is braking, what
effectively modifies speed. This situation is often
observed at night, when the camera flash may be
seen by the driver.
3.1 Problem Solving by Inversion
Unlike the methods presented in the literature about
vehicle speed from images, we estimated vehicle
motion from a pure 3D approach. We considered the
equivalent problem of a camera in motion capturing
a stationary vehicle. We found easier to model the
set of 3D points attached to the vehicle with constant
coordinates, and to formulate mathematically the
artificial camera motion by the 3 coordinates of the
optical centre related to the second image capture.
Conceptually, we transformed the problem of
vehicle displacement into a stereo computation one:
the stationary vehicle is captured two times by a
moving camera, allowing for triangulation thanks to
the different points of view.
Triangulation is solved by 3D line intersection.
3D lines are constructed thanks to the camera pinhole
model which exploits the focal length and pixel size.
The principal point was supposed to be at the CCD
centre and we omitted distortion parameters which
appeared negligible with our setup.
More precisely, the optical centre (0,0,0) of the
Figure 3: Triangulation from the fictive moving camera
and stationary vehicle.
camera for the first image and the camera geometry
allows to define 3D lines for each vehicle points
localized in the first image. Corresponding 3D lines
are evaluated for the corresponding vehicle points
localised in the second image, but this time with an
optical centre positioned at (Tx,Ty,Tz), to account
for the fictive camera translation.
We developed an efficient algorithm for 3D line
intersection. In its simplest form, it returns the
minimal distance between the lines since two 3D
lines do not always intersect. This is computed as
the distance of two parallel planes, each one
containing one 3D line and parallel to the other 3D
line. If a 3D intersection point is desired, the
algorithm uses point and vector operations to
quickly find the mid point of the shortest segment
separating the two 3D lines.
3.2 Localisation of Vehicle Points
Licence plate corners are desirable vehicle point
candidates as they must be visible for vehicle
identification and are independent of vehicle types.
Much more, their known relative distance may serve
the purpose of real dimension needed by the
approach as explained in subsection 3.3. Other
points visible in both images may be added for better
stability of the solution.
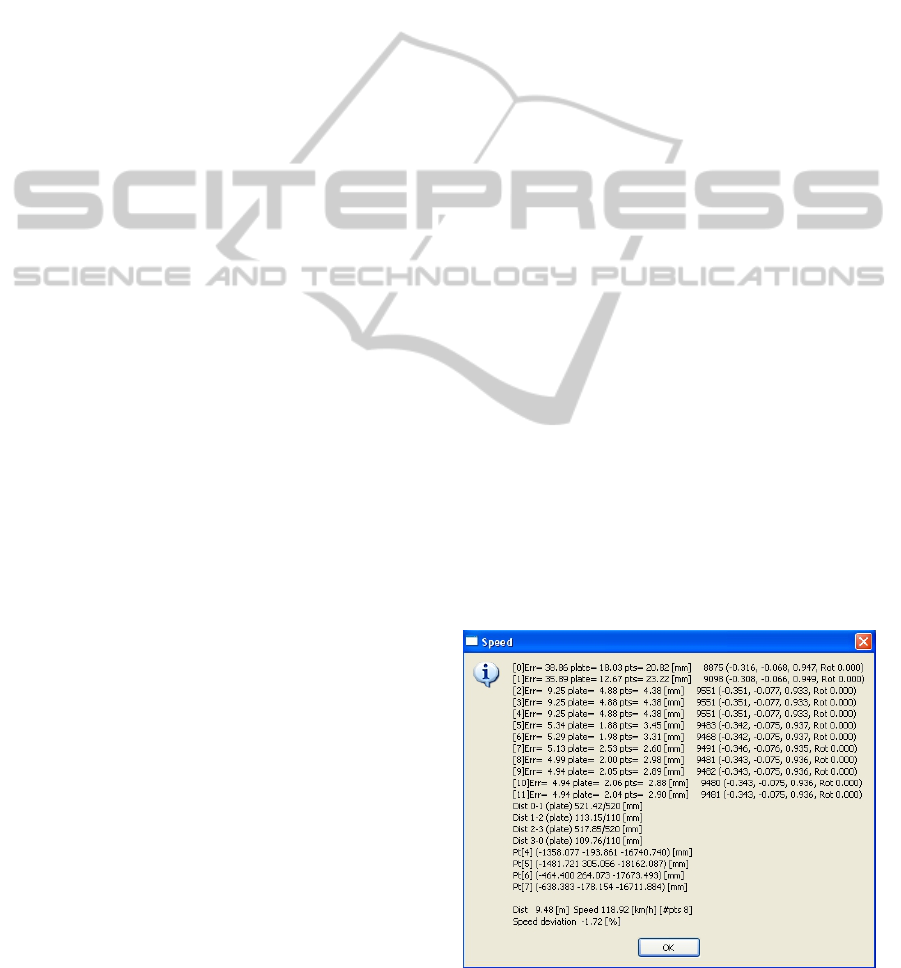
Figure 4: Localised points and plate corners refinement.
Initially, no attempt was made to automate
vehicle point localization. The objectives defined by
the client did not require full automation as the
procedure will involve data input by a user.
VEHICLE SPEED ESTIMATION FROM TWO IMAGES FOR LIDAR SECOND ASSESSMENT
383
Moreover the risk for bad point localisation is high
in the licence plate region which is crucial for the
success of the approach.
However, in order to reduce the influence of
manual point localization, we added the automatic
refinement of plate corners. A rectangular region
containing the plate defined by the user is processed
to derive nearly horizontal and vertical plate edges.
For instance, a horizontal low pass filter followed by
maximum gradient following in the horizontal
direction detects horizontal plate borders. The areas
close to corners are excluded as licence plates are
rounded rectangles. The intersection of one
horizontal and one vertical detected border gives a
refined corner if this is not too far from its initial
position.
3.3 Search for Translation
To sum up, vehicle speed is estimated from the
vehicle displacement, obtained as the artificial
camera translation which makes both image captures
the valid projections of a stationary vehicle. This
problem is ill posed if no object scale is specified.
To do so, at least one real object measure has to be
given. In our application, we took advantage of the
required visibility of the licence plate to impose its
(official) dimensions during 3D reconstruction.
Numerically, the solution for (Tx,Ty,Tz) results
from minimizing the sum of two error terms: one for
the root mean square (RMS) of the 3D line distance
of all vehicle points and one for the RMS of the
difference between the measured plate sides and
their official lengths.
The minimization problem is solved with an
exhaustive search on the three parameters, within a
coarse to fine approach for speedup. Computational
time is also limited thanks to the a priori range of
possible translation values in practical situations. Tz,
defined along the camera optical axis and mainly
along the traffic flow, has a larger value than Tx and
Ty and Ty is little as the tilt of the camera relative to
the vehicle motion is small.
The validity of the optimization can be checked
thanks to the residual mismatch (in mm) of 3D point
matching. More precisely, the contribution of each
point or plate side to the error can be analysed to
identify badly localised points.
4 GRAPHICAL INTERFACE
Figure 6 displays the interface composed of a pair of
images with superimposed points (orange crosses)
whose coordinates are given in the middle area. This
area also holds interface for input values like the
licence plate size, elapsed time, the camera CCD
size and the focal length.
Europe tends to harmonize the licence plate sizes
to a standard dimension although many countries are
still using their own dimensions and colour. The
program was tested with different values for the
width (28 to 52cm) and height (8 to 20 cm), as plates
originated from a tenth of European countries.
A large number of trials have been undertaken at
different geographical locations (in Belgium and
Zwitserland) for two cameras with different focal
lengths (from 18 to 50mm) to adapt to the field of
view and speed. The tested cameras are the Nikon
D70S and D90, with a resolution slightly exceeding
3000x2000.
In the current version of the graphical interface,
the user first loads a pair of images and specifies the
abovementioned parameters. Most of these are
incrusted in the images. Then, he clicks to localise
vehicle points, starting with a minimum of four
points corresponding to the licence plate corners. He
may use the ‘Refine Plate Corners’ button to
automatically refine the plate corners according to
plate edges. A few additional points are welcome to
reduce the sensitivity to point localisation. A set of 6
to 8 points were generally specified in the tests.
Once all the parameters are specified, the ‘Get
Speed’ button is pressed to launch the optimisation
procedure. This will return the convergence history
with residuals separated in plate and point values,
the estimated speed, and the deviation with the
supplied LIDAR speed value (Figure 5). Thanks to
the individual point residues (corresponding to 3D
line distance) the user can find and adapt badly
localised points or remove unreliable ones.
Figure 5: Results of speed estimation with convergence
details.
VISAPP 2012 - International Conference on Computer Vision Theory and Applications
384
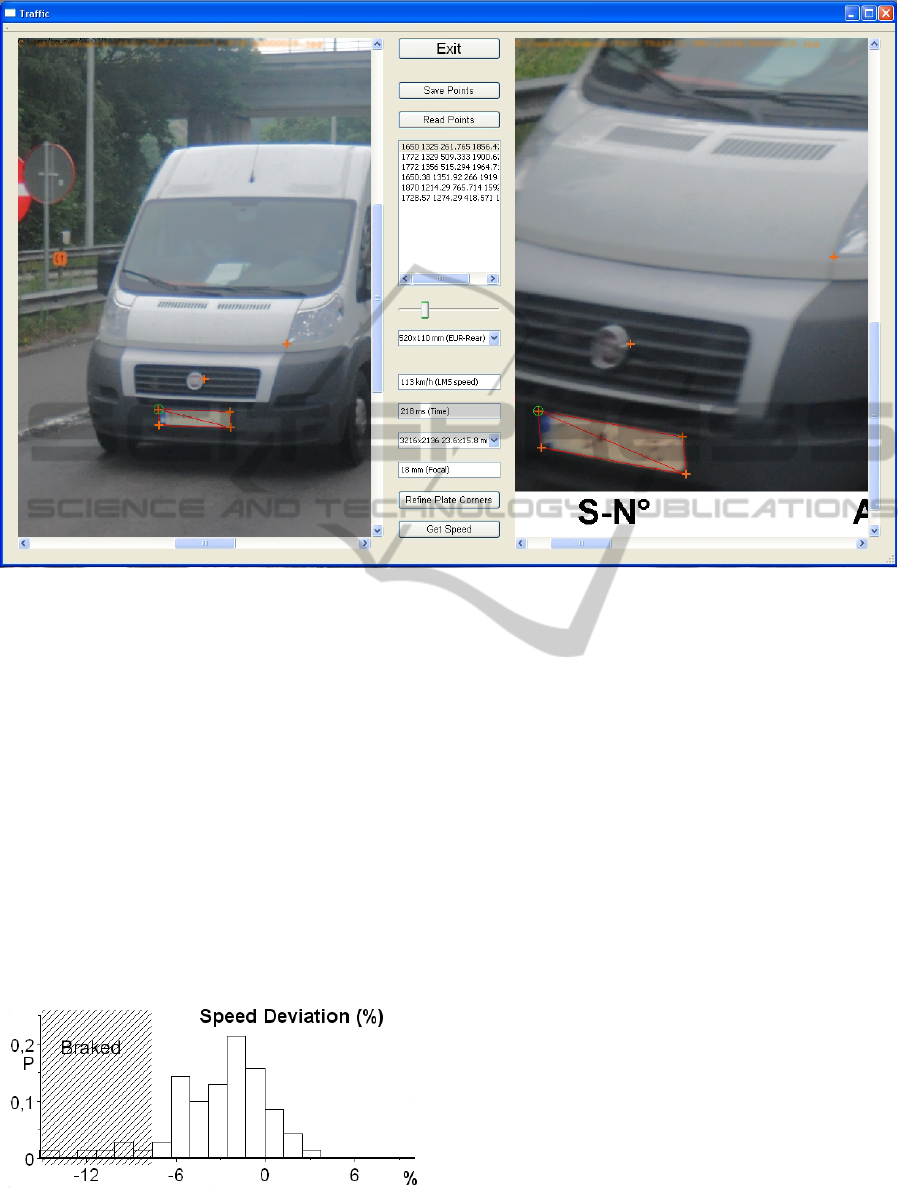
Figure 6: User interface depicting the two images, the set of specified points, the plate dimension, the LIDAR speed, the
elapsed time between images and the camera parameters.
5 RESULTS
Figure 7 shows the distribution of the speed
deviation between our approach and the LIDAR
measure for more than 100 tests.
We directly notice that most deviation values are
within the [-10%, +10%] interval, as required by the
application. Stronger deviations correspond to
particular situations, usually due to serious braking
(the driver has seen the flash or the LIDAR pole), as
attested by the backlights. These few cases were
called ‘Braked’ in the figure and explained speed
inferior to more than 7% deceleration.
Figure 7: Distribution of speed deviation.
Several error sources explain the deviation for
normal cases. First, the constant speed hypothesis
may not hold if the driver released gas or if the
driving conditions changed (before road crossing or
hill climbing). The time interval between the LIDAR
measure and the camera captures range from 200 ms
to more than 1 s. Secondly, the focal length, given to
the closest integer by the camera, may represent a
systematic deviation with the real value. Thirdly, the
plate size is not measured and is based on official
values often only valid for one of the two plates.
Finally, the care with which the user localised points
has of course a large influence. To have reproducible
results, one should optimise points thanks to the
automatic ‘Refine Plate Corners’ function and
control the global and individual residual errors after
convergence.
6 CONCLUSIONS
This paper has presented an application for vehicle
speed estimation from two images acquired by a
stationary camera. The approach is based on the 3D
motion estimation thanks to a set of points localised
VEHICLE SPEED ESTIMATION FROM TWO IMAGES FOR LIDAR SECOND ASSESSMENT
385

by the user and possibly refined automatically for
the licence plate. The plate dimensions are exploited
to obtain real distances and derive a speed.
The particularities of the implementation concern
the inversion of the problem, looking for the camera
motion of a stationary vehicle; the application of 3D
line intersection with a distance measure; and the
use of the official plate dimensions to constrain the
scale of 3D point reconstruction.
More than 100 tests compared the speed
estimated by camera with the LIDAR measurement
in different conditions (camera, focal length, plate
type, road type, night/day). They showed the
adequacy of hypotheses and the implementation
correctness. The deviation between both speeds for
normal driving cases is in the range [-7%, +3%],
below the client requirement of +/- 10%. Mention
that the camera and LIDAR speeds were not
measured at the same time and that the constant
speed hypothesis was probably rarely true where the
LIDAR system was tested. Worst cases were
observed (speed lower than -7 % deviation) in
special conditions (due to the road or driver) but
evidence for such cases is usually available from the
image.
We intend to further analyse the quality of the
approach from pairs of images of a vehicle with
known displacement.
ACKNOWLEDGEMENTS
This study has been initiated by Traffic Observer,
Belgium. We thank them for their agreement on
publishing the method and results and for providing
images and LIDAR measures.
REFERENCES
Dailey, D. J., Cathey, F. W., Pumrin, S., 2000. An
Algorithm to Estimate Mean Traffic Speed Using
Uncalibrated Cameras. In IEEE Transactions on
Intelligent Transportation Systems, Vol 1, No 2, pp
98-107.
Grammatikopoulos, L., Karras, G., Petsa, E., 2005.
Automatic Estimation of Vehicle Speed from
Uncalibrated Video Sequences. In Proceedings of Int.
Symposium on Modern Technologies, Education and
Professional Practice in Geodesy and Related Fields,
Sofia, Nov 2005, pp 332-338.
Huei-Yung, L., Kun-Jhih, L., 2005. Vehicle Speed
Estimation from Single Still Images Based on Motion
Blurred Analysis, In IAPR Conference on Machine
Vision Applications, May 2005, Tsukuba, Japan.
Kastrinaki, V., Zervakis, M., Kalaitzakis, K., A survey of
video processing techniques for traffic applications. In
Image and Vision Computing, Vol 21, Elsevier, 2003,
pp 359-381.
Tocino Diaz, J. C., Houben, Q., Czyz, J., Debeir, O.,
Warzée, N., 2009. A Camera Auto-Calibration
Algorithm for Real-Time Road Traffic Analysis. In
Proceedings of VISAPP 2009 Int. Conf. on Computer
Vision Theory and Applications, Lisboa, Portugal, Feb
2009, pp. 625-631.
VISAPP 2012 - International Conference on Computer Vision Theory and Applications
386
