
EVALUATING COMPONENT ARCHITECTURE VISUALIZATION
TOOLS
Criteria and Case Study
Lukas Holy, Jaroslav Snajberk and Premek Brada
Department of Computer Science and Engineering, Faculty of Applied Sciences,
University of West Bohemia, Pilsen, Czech Republic
Keywords:
Visualization, Model Analysis, Software Components, Tools, Reverse Engineering.
Abstract:
There are many software architecture modeling tools and their use is very common in practice. But a closer
look reveals that in the ever more important area of component-based architectures, system architects or com-
ponent assemblers are constrained by the lack of good model representations. On one hand, a generic represen-
tation like UML provides insufficient support for component-specific needs, on the other hand, tools focused
on component development sometimes force the user to learn new visual syntax specific for the component
model. Advanced features offered by the tools on top of basic architecture visualization are often limited. In
this paper we propose a set of criteria for the evaluation of tools for component architecture visualization, con-
sidering the needs of both architectural modeling and analytical tasks. These criteria are thoroughly discussed
and their use is shown on a case study which evaluates a current state of the art tool.
1 INTRODUCTION
Software architects and developers have been using
various forms of visualizing the structure of software
applications since the advent of the discipline. In
the last 20 years, the increased adoption of object-
oriented programming lead first to several propos-
als for adequate modeling notations which were then
gradually consolidated into the current standard – the
Unified Modeling Language (UML) (OMG, 2011).
While UML is able to model both the static and dy-
namic aspects of many kinds of software, recent de-
velopments in the field of component-based software
engineering (CBSE) brings new challenges.
The visualization of component-based applica-
tions (Szyperski, 2002) is not a trivial task due to the
rich structures of component interfaces and the dif-
ferences between component models. Frameworks
like EJB (Sun Microsystems, 2006), CORBA (OMG,
2006), OSGi (OSGi Alliance, 2009) and more can
be found in commercial applications and even more
component models – for example SOFA (Bures et al.,
2006), Fractal (Merle and Stefani, 2008) or CoSi
(Brada, 2008) – are the subject of research.
The diversity of component models in terms of the
features available on component interface is well de-
scribed in e.g. (Crnkovic et al., 2007). On an ab-
stract level, components have in common two basic
properties: the black-box nature and the fact that the
features they need and provide on their interface are
well defined (Szyperski, 2002). Their interface fea-
tures can cover all known contract levels (Beugnard
et al., 1999):
• syntactic, e.g. functional interfaces in most mod-
els and events in EJB3 (Sun Microsystems, 2006),
• semantic, e.g. triggers in SaveCCM (Hansson
et al., 2004),
• behavioural like protocol in SOFA (Pl
´
a
ˇ
sil and
Vi
ˇ
snovsk
´
y, 2002),
• extra-functional property specifications, e.g. in
Palladio (Becker et al., 2009),
• control interfaces like in Fractal (Merle and Ste-
fani, 2008).
This richness indicates that modeling and visualizing
component applications is a challenging task.
1.1 Structure of the Paper
In the following section, we describe the problems in
visualization of component-based software related to
this diversity, as well as different approaches to visu-
alization of such structures. In Section 3 we suggest
737
Holy L., Snajberk J. and Brada P..
EVALUATING COMPONENT ARCHITECTURE VISUALIZATION TOOLS - Criteria and Case Study.
DOI: 10.5220/0003861607370742
In Proceedings of the International Conference on Computer Graphics Theory and Applications (IVAPP-2012), pages 737-742
ISBN: 978-989-8565-02-0
Copyright
c
2012 SCITEPRESS (Science and Technology Publications, Lda.)
the criteria that can be used for evaluating tools able to
visualize such software. These criteria are thoroughly
discussed and evaluated from the views of different
CBSE stakeholders. The application of these crite-
ria is then presented on the example of IBM Rational
Software Architect in Section 4 and finally the overall
value of our contribution is discussed in the Conclu-
sion of this paper.
2 PROBLEM DEFINITION
People involved in the component development and
maintenance process need to visualize the component
applications in a various ways. Visualization should
help them to understand the system, analyze depen-
dencies (Lange et al., 2006), extract and show desired
properties, etc. These techniques are necessary espe-
cially when dealing with larger systems which consist
from many (hundreds or thousands) components.
Graphical notation is one of the important aspects
of visualizing component models. Many component
models propose their own graphical notation while
other ones assume a generic one like UML; this frag-
mented landscape can be seen as similar with the sit-
uation before UML became widely established for
object-oriented languages.
2.1 Component Visualization:
Approaches and Related Work
Components are by their nature more complex than
classes in terms of their contractually specified inter-
face features. Their models, visual syntax, supporting
meta-data and tool functionalities should therefore
be also more sophisticated. For example, the study
(Lange et al., 2006) shows that architectural modeling
would benefit from consolidated views, model con-
sistency and defect checking, and its augmenting by
metrics. Additionally, Kollman et al note that obtain-
ing more abstract representations and providing ad-
vanced (semantically rich) model features are impor-
tant for analysts (Kollman et al., 2002).
Several works describe general criteria on analyt-
ical visualization tools, e.g. (Telea et al., 2010) or
(Kuhn et al., 2010); both of these works attempt to
structure the criteria into categories for better orien-
tation. (Ratneshwer and Tripathi, 2010) have further
identified common desirable features or open issues
which can be improved by visualization techniques.
Visual notations can be in general analyzed or com-
pared from the semiotic point of view, like in (Siau
and Tian, 2009) or in (Moody and van Hillegersberg,
2009), to understand the suitability of chosen symbols
and layouts.
However we are not aware of any other method
that would help to evaluate component architecture
visualization tools. Favre et al discussed several is-
sues with visualization of component-based software
in (Favre and Cervantes, 2002). While Favre covered
all areas of component visualization, namely compo-
nent models, components and their assemblies, he ad-
dressed only global issues of such visualization and
he did not identified specific visualization tasks, how-
ever he provided a solid background and motivation
for future work.
The options in modeling and visualizing compo-
nent software architectures specifically are, cf. (Med-
vidovic et al., 2002):
1. component model-specific tool/notation;
2. generic component-aware tool/notation;
3. UML with profiles;
4. plain UML.
Component model-specific visualization means a
visual notation (symbols and their meaning) sup-
ported by tools which are able to visualize only one
or very few specific models. The motivation for this
approach is the diversity of features provided by in-
dividual component models. The downside is that the
specifics of the given notation can make it difficult for
experts from different domains to read and understand
the models. Examples of this approach are SaveCCM
(Hansson et al., 2004) or Palladio (Becker et al., 2009)
component models.
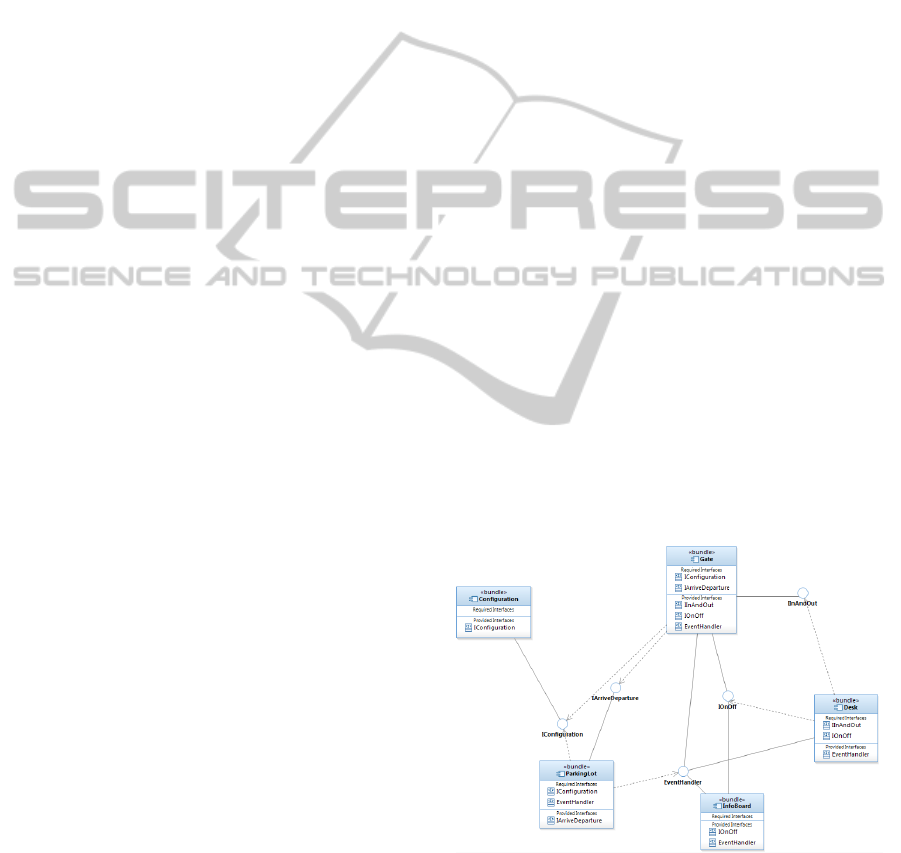
Figure 1: Example of plain UML2 component model.
Secondly, we can use a universal component-
aware visualization tool like SoftVision (Telea and
Voinea, 2004) which is either able to visualize any
component model or can be extended for given com-
ponent model needs. Related to this category is the
IVAPP 2012 - International Conference on Information Visualization Theory and Applications
738

use of UML (Object Management Group, 2009) con-
strained by or extended with UML profiles which en-
able to further specify the semantics of existing model
elements and create new ones on top of the core UML
meta-model. Creation of profiles including introduc-
tion of icons for new model elements is supported by
some tools, e.g. IBM Rational Software Modeler, and
many UML tools are able to use a pre-defined selec-
tion of profiles.
Finally, we can use plain UML, especially its com-
ponent diagram (see Figure 1) and possibly class di-
agram. It may not capture the desired level of de-
tails necessary for full component modeling but pro-
vides a universal notation that is understood by most
software engineers today. Moreover, the tool sup-
port is extensive (e.g. MagicDraw, Enterprise Archi-
tect, PowerDesigner or StarUML, to name just a few).
However, this probably most common modeling ap-
proach “. . . lacks support for capturing and exploiting
certain architectural concerns whose importance has
been demonstrated through the research and practice
of software architectures” (Medvidovic et al., 2002)
and supports only rudimentary analytical tasks.
2.2 Goal of the Work
In general, the options and benefits of a visualization
of a component application are affected by: (a) the
component model and its features; (b) visual nota-
tion’s repertoire; (c) the capabilities of a tool used for
visualization. Suitable visualization approaches have
to be general enough to cover a wide range of com-
ponent models while at the same time being able to
capture all aspects of a concrete component model,
in order to provide sufficient level of standardization
while preserving precious information about the par-
ticular component-based applications. In visualiza-
tion of component-based software it is therefore cru-
cial to provide good notation and diagramming func-
tionalities and beneficial to support more advanced
features for architectural analyzes, data mining and
visualization in general.
In this paper we aim to define a suite of criteria
that capture these features and emphasize the aspects
important from CBSE point of view. These criteria
should be suitable for the evaluation of visualization
tools to indicate their fitness for advanced visualiza-
tion of component-based software. Secondly these
criteria can guide developers of current or new tools
while considering implementation of new features,
because each applied criterion increases the added
value of the visualization tool.
3 CRITERIA FOR EVALUATING
TOOLS
The criteria which we consider important for visu-
alization tools targeted at component-based develop-
ment are based on the general visualization rules and
particular CBSE needs identified in the previous sec-
tion. The criteria are summarized in Table 1; the list
is structured using the general scheme proposed by
(Telea et al., 2010) and related to roles specific to
CBSE, cf. (Szyperski, 2002). Individual criteria are
discussed in detail below.
The importance of each criterion for each role is
indicated by stars, the scale is from none (not appli-
cable) through one star for lowest importance to three
stars for highest importance. Formula 1 describes the
calculation of final rating s
r
of given tool for one role.
s
r
=
∑
n
i=1
(w
i
· c
i
)
M ·
∑
n
i=1
(w
i
)
(1)
Here w
i
stands for the criterion importance and c
i
represents the coverage of the feature by the given
tool, on the scale from zero for “not present” to M
for full coverage. Symbol n stands for the number of
criteria and M equals three.
3.1 Criteria Description
We distinguish between basic and advanced criteria.
As basic criteria we consider common tools features,
which should be fulfilled in any case. These are fea-
tures like pan&zoom, diagram overview, adjusting di-
agrams, import&export or displaying model structure.
The brief description of advanced criteria follows.
Rich Component Interface Visualization. Rep-
resents the tool’s ability to work with all properties
and features specified by component model or frame-
work.
Model Extraction. Describes the tool’s ability
to extract model from source code, deployment form
or runtime representation, to a representation suitable
for working with visualizing the gathered data.
Component and Architecture Analysis. This
criterion describes to what degree a tool is able to
provide analyses of structures or behavior of compo-
nents. There are many possible analyses, for instance
for internal dependencies between provided and re-
quired interfaces or finding unused required interfaces
or structures. Tools can also be able to check architec-
ture style rules, detect design patterns or anti-patterns.
Finding Matching Variation/Extension Points.
The process of finding a variation or extension point
in complex application can be very tedious. But if
the tool is aware of the data types and structures it is
EVALUATING COMPONENT ARCHITECTURE VISUALIZATION TOOLS - Criteria and Case Study
739
Table 1: Criteria and roles for component visualization.
# Functional criteria Category
System
architect
(SA)
Component
developer
(CD)
Component
assembler
(CA)
C00 Basic features N/A mandatory
C01 Richness of component inter-
face visualization
Data representation /
Static
∗∗∗ ∗∗∗ ∗∗∗
C02 Model extraction Integration / Data mining
∗∗ ∗∗
C03 Component and architecture
analysis
Data representation /
Static
∗∗∗
C04 Finding matching variation /
extension points
Data representation /
Static
∗∗∗ ∗ ∗∗∗
C05 Analysis and visualization of
extra-functional properties
Data representation /
Static
∗∗∗ ∗∗ ∗
C06 Change analysis Data representation / Dy-
namic and Evolution
∗∗∗ ∗∗ ∗
C07 Analyzing differences between
views
Operations / Comparison
∗∗ ∗∗
C08 Traceability analysis Operations / Searching
∗ ∗ ∗∗
C09 Model querying and structural
analysis
Operations / Searching
∗∗ ∗∗
C10 Interactive components clus-
tering
Operations / Searching
∗∗∗ ∗∗
C11 Custom metrics and parame-
ters visualization
Effectiveness / Benefits
∗∗ ∗ ∗∗
C12 Diagram scalability and filter-
ing
Effectiveness / Scalabil-
ity
∗∗ ∗∗∗
displaying and is able to run basic queries internally,
there is a possibility to offer users a feature which ease
this process.
Analysis and Visualization of Extra-functional
Properties. Extra-functional properties (International
Standard Organization (ISO/IEC), 2001) can be either
stored in a file or repository separately or can be gath-
ered from the code or running system. Tools can also
be able to compose the extra-functional properties of
individual components into one property for the sys-
tem or subsystem, and compare them in order to deter-
mine which component is better for a given purpose.
There are also several ways of presenting the gathered
data as a visualization in the diagram or them export-
ing into another tool.
Change Analysis. Represents the tool’s ability to
analyze the impact of the change (e.g. changed inter-
faces or relations), application’s consistence and com-
ponent’s compatibility with other related components
after the change.
Analyzing Differences between Views. Al-
though analyzing differences in textual data is a com-
mon task sufficiently solved by tools, differencing
two graphical views is not a very common feature. It
enables users to faster understand the changes made
in the system.
Traceability Analysis. Important part of under-
standing the system is tracing through its dependen-
cies. Although components should be btreated as
black boxes, composing the dependency along a chain
of components from the individual internal dependen-
cies between provided and required interfaces can be
very useful. It enables users to predict the ripple ef-
fects of potential changes or understand the structure
of the system.
Model Querying and Structural Analysis. De-
scribes tool’s ability to perform user specified or built-
in operations generally needed to find desired infor-
mation in the model. It comprises features from basic
search to tool’s own query language where the queries
can be specified by user. Advanced features like struc-
tural analysis, model evolution prediction or design
patterns and anti-patterns detection are also related to
this criterion.
Interactive Components Clustering. Diagrams
of large applications become difficult to explore. One
of the possible ways of improving the diagrams to
be easier to understand is creating clusters of com-
ponents which semantically represent a subsystem.
Clusters can be minimized into symbols to lower the
visual clutter of the application’s diagram overview.
These clusters can be found or suggested by tools au-
tomatically and/or adjusted by user manually.
Custom Metrics and Parameters Visualization.
IVAPP 2012 - International Conference on Information Visualization Theory and Applications
740

This criterion describes tool’s ability to provide data
and related operations, which would lead to visualiza-
tion of desired metrics a parameters. Important part of
this criterion is also the way in which the tool is able
to visualize and customize the gathered data. There
can be several data sources for the metrics and pa-
rameters. They can be stored in a file or repository
separated from the diagram representation. Another
way of gathering such data can be tool’s own metrics
measuring and composing capability.
Diagram Scalability and Filtering. In case of
large diagrams a tool should be able to handle the
load and offer satisfactory response time. This cri-
terion evaluates how the tool handles the problem of
model complexity. It can be reduced for instance by
multiple levels of displayed details or filtering highly
connected parts suitable for detailed view.
In Table 1 we can see that most of the criteria are
related with the component system architect or assem-
bler and fewer are related with component developers.
Component architects and assemblers need to have
an overview of the whole system which can consist
from hundreds or thousands of components and thus
they need lot of analytical techniques and tools to ease
their work.
4 AN EXAMPLE TOOL - RSA
RSA (IBM Rational Software Architect) is part of the
Rational Rose tool family and it is build on the Eclipse
platform. We chose RSA for this case study because
it is not just a UML diagramming tool but rather rep-
resents a robust solution that supports model driven
development, analytical work over different views on
the same software and a lot more. All of these features
are built on top of the UML meta-model.
RSA offers not only use of UML profiles but it is
also possible to design new ones with it. This means
that any component model can be represented with
details limited only by the UML meta-model itself.
RSA supports all basic features needed for reason-
able visualization of component-base software (C00),
thus it is possible to use it for these purposes. Rich-
ness of contractual levels (C01) is achieved by using
UML profiles, extension mechanism which – together
with the option to define custom element icons – is
powerful enough to model and reasonably well visu-
alize most of kinds of component interface features.
RSA is able to trace dependencies, inheritance
or ancestors by using several different features, thus
covering the (C08) criteria in its full content. RSA
enables model management for parallel development
and architectural re-factoring – split, combine, com-
pare and merge models and model fragments, thus
(C07) criteria is also fully covered.
For model analysis and model metrics there is
a special plug-in, called The Model Metric Analysis
Plug-in which covers the criteria of (C11). This plug-
in enables to create Kiviat diagrams (“spider charts”),
perform interactive analysis of model and asses the
results. RSA is able to create data sets (queries) to
extract a defined set of information from UML mod-
els. This feature is accessed by using RSA extended
with BIRT project
1
, which also enables to create re-
ports and sub-reports, these features covers the crite-
ria (C09).
It may seem that model extraction (C02) is sup-
ported, because RSA can reverse-engineer class dia-
grams from Java, C++ and .NET source code. How-
ever, this ability does not work on component-based
software and component diagrams. No other criteria
is fulfilled.
4.1 Evaluation of Results
Detailed overall value of IBM Rational Software Ar-
chitect’s component visualization capabilities is cal-
culated by using Formula 1 and is summarized in Ta-
ble 2.
Table 2: Assessment of RSA using our criteria.
# c
i
SA CD CA
C01 2 ∗∗∗ ∗∗∗ ∗∗∗
C07 3 ∗∗ ∗∗
C08 3 ∗ ∗ ∗∗
C09 2 ∗∗ ∗∗
C11 2 ∗∗ ∗ ∗∗
s
r
12 0,39 0,5 0,86
We can conclude that RSA does not fully cover
the desiderata of component application visualization
but still offers quite a lot of added value, from which
component assemblers can benefit the most.
5 CONCLUSIONS
In this paper we suggested several criteria for evaluat-
ing tools targeted at visualization of component-based
software. These criteria can be used on existing vi-
sualization tools as we presented on the example of
IBM Rational Software Architect, which was evalu-
ated with quite satisfactory results. On the other hand,
this case shows that even advanced visualization tools
1
www.eclipse.org/birt/phoenix/
EVALUATING COMPONENT ARCHITECTURE VISUALIZATION TOOLS - Criteria and Case Study
741

currently address only a few of the needs related to
component visualization.
The proposed criteria can thus also serve as a
guideline for efforts towards better visualization of
component-based applications. Currently the main
problem behind the lack of such efforts can be due to
relatively low usage of components. However, their
importance continues to rise and future visualization
tools should address these topics to a broader extent.
ACKNOWLEDGEMENTS
The work was supported by the UWB grant SGS-
2010-028 Advanced Computer and Information Sys-
tems.
REFERENCES
Becker, S., Koziolek, H., and Reussner, R. (2009). The pal-
ladio component model for model-driven performance
prediction. Journal of Systems and Software, 82(1):3
– 22. Special Issue: Software Performance - Modeling
and Analysis.
Beugnard, A., J
´
ez
´
equel, J.-M., Plouzeau, N., and Watkins,
D. (1999). Making components contract aware. Com-
puter, 32(7):38–45.
Brada, P. (2008). The CoSi component model: Reviving
the black-box nature of components. In Proceedings
of the 11th International Symposium on Component
Based Software Engineering (CBSE), volume 5282 of
Lecture Notes in Computer Science, Karlsruhe, Ger-
many. Springer Verlag.
Bures, T., Hnetynka, P., and Plasil, F. (2006). SOFA 2.0:
Balancing advanced features in a hierarchical compo-
nent model. In SERA, pages 40–48. IEEE Computer
Society.
Crnkovic, I., Chaudron, M., Sentilles, S., and Vulgarakis,
A. (2007). A classification framework for component
models. In Proceedings of the 7th Conference on Soft-
ware Engineering and Practice in Sweden.
Favre, J.-M. and Cervantes, H. (2002). Visualization of
component-based software. In Proceedings of the 1st
International Workshop on Visualizing Software for
Understanding and Analysis, pages 51–, Washington,
DC, USA. IEEE Computer Society.
Hansson, H., Akerholm, M., Crnkovic, I., and T
¨
orngren,
M. (2004). SaveCCM - a component model for
safety-critical real-time systems. In Proceedings of
the 30th EUROMICRO Conference, pages 627–635,
Los Alamitos, CA, USA. IEEE Computer Society.
International Standard Organization (ISO/IEC) (2001). In-
formational technology – product quality – part 1:
Quality model. International Standard ISO/IEC 9126.
Kollman, R., Selonen, P., Stroulia, E., Syst
¨
a, T., and
Z
¨
undorf, A. (2002). A study on the current state of
the art in tool-supported uml-based static reverse engi-
neering. In van Deursen, A. and Burd, E., editors, Pro-
ceedings of the 9th Working Conference on Reverse
Engineering (WCRE 2002). IEEE Computer Society.
Kuhn, A., Erni, D., Loretan, P., and Nierstrasz, O. (2010).
Software cartography: thematic software visualization
with consistent layout. J. Softw. Maint. Evol., 22:191–
210.
Lange, C. F., Chaudron, M. R., and Muskens, J. (2006). In
practice: UML software architecture and design de-
scription. IEEE Software, 23(2):40– 46.
Medvidovic, N., Rosenblum, D. S., Redmiles, D. F., and
Robbins, J. E. (2002). Modeling software architec-
tures in the unified modeling language. ACM Trans.
Softw. Eng. Methodol., 11(1):257.
Merle, P. and Stefani, J.-B. (2008). A formal specification
of the Fractal component model in Alloy. Research
Report RR-6721, INRIA.
Moody, D. and van Hillegersberg, J. (2009). Evaluating the
visual syntax of UML: An analysis of the cognitive ef-
fectiveness of the UML family of diagrams. In Gaevic,
D., Lmmel, R., and Van Wyk, E., editors, Software
Language Engineering, volume 5452 of Lecture Notes
in Computer Science, pages 16–34. Springer Berlin /
Heidelberg.
Object Management Group (2009). UML superstructure
specification. OMG specification formal/2009-02-02.
OMG (2006). CORBA components. OMG Specification
formal/02-12-06, Object management Group 2006.
OMG (2011). UML 2.4 specification. OMG document
ptc/2010-11-14, Object Management Group 2011.
OSGi Alliance (2009). OSGi service platform v4.2. Core
specification, OSGi Alliance 2009.
Pl
´
a
ˇ
sil, F. and Vi
ˇ
snovsk
´
y, S. (2002). Behavior protocols for
software components. IEEE Transactions on Software
Engineering, 28(10).
Ratneshwer and Tripathi, A. K. (2010). Dependence anal-
ysis of software component. SIGSOFT Softw. Eng.
Notes, 35:1–9.
Siau, K. and Tian, Y. (2009). A semiotic analysis of unified
modeling language graphical notations. Requirements
Engineering, 14:15–26. 10.1007/s00766-008-0071-7.
Sun Microsystems (2006). Enterprise JavaBeans, Version
3.0. EJB Core Contracts and Requirements. JSR220
Final Release.
Szyperski, C. (2002). Component Software, Second Edition.
ACM Press, Addison-Wesley.
Telea, A. and Voinea, L. (2004). A framework for inter-
active visualization of component-based software. In
Proceedings of the 30th EUROMICRO Conference,
pages 567–574, Washington, DC, USA. IEEE Com-
puter Society.
Telea, A., Voinea, L., and Sassenburg, H. (2010). Vi-
sual tools for software architecture understanding: A
stakeholder perspective. IEEE Softw., 27:46–53.
IVAPP 2012 - International Conference on Information Visualization Theory and Applications
742
