
DICTIONARY BASED HYPERSPECTRAL IMAGE RETRIEVAL
Miguel A. Veganzones
1
, Mihai Datcu
2
and Manuel Gra˜na
1
1
Grupo de Inteligencia Computacional, Universidad del Pa´ıs Vasco, Bilbao, Spain
2
German Aerospace Agency (DLR), Wessling, Germany
Keywords:
Hyperspectral images, CBIR systems, Kolmogorov complexity, Dictionaries, Normalized compression
distance.
Abstract:
The normalized information distance (NID) is an universal metric distance based on Kolmogorov complexity.
However, NID is not computable in a Turing sense. The normalized compression distance (NCD) is a com-
putable distance that approximates NID by using normal compressors. NCD is a parameter-free distance that
compares two signals by their lengths after separate compression relative to the length of the signal resulting
from their concatenation after compression. The use of NCD for image retrieval over large image databases is
difficult due to the computational cost of compressing the query image concatenated with every image in the
database. The use of dictionaries extracted by dictionary-based compressors, such as the LZW compression
algorithm, has been proposed to overcome this problem. Here we propose a Content-Based Image Retrieval
system based on such dictionaries for the mining of hyperspectral databases. We compare results using the
Normalized Dictionary Distance (NDD) and the Fast Dictionary Distance (FDD) against the NCD over differ-
ent datasets of hyperspectral images. Results validate the applicability of dictionaries for hyperspectral image
retrieval.
1 INTRODUCTION
Kolmogorov complexity lies in the core of algorith-
mic information theory (Chaitin, 2004; Solomonoff,
2009) that focuses on the information of individual
signals, an approach completely different to classi-
cal Shannon’s probabilistic approach to information
theory (Shannon, 2001). The normalized information
distance (NID) (Bennett et al., 1998) is an universal
metric distance based on Kolmogorov complexity (Li
and Vitanyi, 1997). However, NID is stated in terms
of Kolmogorov complexity which is uncomputable
in a Turing sense. The normalized compression dis-
tance (NCD) (Li et al., 2004) is a computable distance
that approximates NID by using normal compressors.
There has been an increasing interest in using NCD
for pattern recognition (Watanabe et al., 2002) and in
the last years NCD has been successfully applied to
different pattern recognition problems including re-
mote sensing (Cerra et al., 2010; Cerra and Datcu,
2010).
A Content Based Image Retrieval (CBIR) system
(Smeulders et al., 2000) is able to retrieve the images
stored in an image database using as image indexing
values the feature vectors extracted from the images
by means of computer vision and digital image pro-
cessing techniques. The increasing amount of Earth
Observation data provided by hyperspectral sensors,
motivates research in CBIR systems capable of min-
ing such a huge available data. There are some re-
cent works in hyperspectral CBIR systems focused on
computing the similarities between the spectral sig-
natures of the materials in the images (endmembers)
extracted by some endmember induction algorithm
(Plaza et al., 2007; Veganzones et al., 2008). The
NCD approach to pattern recognition is parameter-
free (except for the compressor’s internal parame-
ters configuration) avoiding to tune up parameters to
realize operative implementations of CBIR systems.
Moreover, it does not require any feature extraction
process. However, the use of NCD in a CBIR system
demands a high computational cost due to the need of
performing the compression of the concatenations of
the query image to each of the images in the database.
The use of dictionaries (Macedonas et al., 2008; Cerra
and Datcu, 2010) has been proposed to provide an ap-
proximation to NCD when computational cost is an
issue. Thus, we propose a CBIR system based on dic-
tionaries for the mining of remote sensing large col-
lections of hyperspectral images. We compare the use
of dictionaries to the use of NCD in three datasets of
real hyperspectral images. Results validate the pro-
426
A. Veganzones M., Datcu M. and Graña M..
DICTIONARY BASED HYPERSPECTRAL IMAGE RETRIEVAL.
DOI: 10.5220/0003861904260432
In Proceedings of the 1st International Conference on Pattern Recognition Applications and Methods (PRARSHIA-2012), pages 426-432
ISBN: 978-989-8425-98-0
Copyright
c
2012 SCITEPRESS (Science and Technology Publications, Lda.)

posed dictionary-based hyperspectral CBIR system.
The paper is divided as follows: Sections 2 and 3
briefly review the NCD and the dictionary distances,
FDD and NDD, respectively. Section 4 introduces the
proposed Dictionary-based hyperspectral CBIR sys-
tem. Section 5 presents the experimental methodol-
ogy. Section 6 gives the results. Finally, we present
some conclusions and further work in Section 7.
2 NORMALIZED COMPRESSION
DISTANCE
The conditional Kolmogorov complexity of a signal x
given a signal y, K (x|y), is the length of the shortest
program running in an universal Turing machine, that
outputs x when fed with input y. The Kolmogorov
complexity of x, K(x), is the length of the shortest
program that outputs x when fed with the empty sig-
nal λ, that is, K (x) = K (x|λ). The information dis-
tance, E (x, y), is an universal metric distance defined
as the length of the shortest binary program in a Tur-
ing sense that, from input x outputs y, and from input
y outputs x. It is formulated as:
E (x, y) = max{K (x|y) , K(y|x)}. (1)
The normalized information distance, NID(x, y), is
defined as:
NID(x, y) =
E (x, y)
max{K(x), K (y)}
. (2)
The NID is sometimes known as the similarity
metric due to its universality property. Here, uni-
versality means that for every admissible distance
D(x, y), the NID is minimal, E (x, y) ≤ D(x, y), up to
an additive constant depending on D but not on x and
y. However, NID(x, y) relies on the notion of Kol-
mogorov complexity which is non-computable in the
Turing sense.
The normalized compression distance,
NCD(x, y), is a computable version of (2) based
on a given compressor, C. It is defined as:
NCD(x, y) =
C(xy) − min{C(x), C(y)}
max{C(x), C(y)}
(3)
where C(·) is the length of a compressed signal by
using compressor C, and xy is the signal resulting of
the concatenation of signals x and y. If the compres-
sor C is normal, then the NCD is a quasi-universal
similarity metric. In the limit case when C(·) = K (·),
the NCD(x, y) becomes “universal”. The NCD(x, y)
differs from the ideal NID(x, y)-based theory in three
aspects (Cilibrasi and Vitanyi, 2005): (a) The univer-
sality of NID(x, y) holds only for indefinitely long
sequences x,y. When dealing with sequences of fi-
nite length n, universality holds only for normalized
admissible distances computable by programs whose
length is logarithmic in n. (b) The Kolmogorov com-
plexity is not computable, and it is impossible to know
the degree of approximation of NCD(x, y) with re-
spect to NID(x, y). (c) To calculate the NCD(x, y)
an standard lossless compressor C is used. Although
better compression implies a better approximation to
Kolmogorov complexity, this may not be true for
NCD(x, y). A better compressor may not improve
compression for all items in the same proportion. Ex-
periments show that differences are not significant if
the inner requirements of the underlying compressor
C are not violated.
3 DICTIONARY DISTANCES
The use of NCD (3) for CBIR entails an unafford-
ably cost due to the requirement of compressing the
concatenated signals, C(xy). To deal with this prob-
lem, we propose the use of distances based on the
codewords of the dictionaries extracted by means of
dictionary-based compressors, such as the LZW for
text strings. This dictionary approach only requires
set operations to calculate the distance between two
signals given that the dictionaries have been previ-
ously extracted. Thus, dictionary distances are suit-
able for mining large image databases where the dic-
tionaries of the images in the database can be ex-
tracted off-line.
Given a signal x, a dictionary-based compression
algorithm looks for patterns in the input sequence
from signal x. These patterns, called words, are subse-
quences of the incoming sequence. The compression
algorithm result is a set of unique words called dictio-
nary. The dictionary extracted from a signal x is here-
after denoted as D(x), with D(λ) =
/
0 only if λ is the
empty signal. The union and intersection of the dic-
tionaries extracted from signals x and y are denoted as
D(x∪ y) and D(x ∩ y) respectively. The dictionaries
satisfy the following properties (correspondent proofs
can be found in (Macedonas et al., 2008)):
1. Idempotency: D(x ∪ x) = D(x).
2. Monotonicity: D(x∪ y) ≥ D(x).
3. Symmetry: D(x∪ y) = D(y∪x).
4. Distributivity: D(x ∪ y) + D(z) ≤ D(x∪ z) +
D(y ∪ z).
We have found two dictionary distance functions on
the literature, the Normalized Dictionary Distance
DICTIONARY BASED HYPERSPECTRAL IMAGE RETRIEVAL
427

(NDD) (Macedonas et al., 2008) and the Fast Dictio-
nary Distance (FDD) (Cerra and Datcu, 2010):
NDD(x, y) =
D(x ∪ y) − min{D(x), D(y)}
max{D(x), D(y)}
, (4)
FDD(x, y) =
D(x) − D(x∩ y)
D(x)
. (5)
NDD and FDD are both normalized admissible dis-
tances satisfying the metric inequalities. Thus, they
result in a non-negative number in the interval [0, 1],
being zero when the compared files are equal and in-
creasing up to one as the files are more dissimilar.
4 HYPERSPECTRAL CBIR BY
DICTIONARIES
Figure 1 shows the Hyperspectral CBIR system
scheme based on dictionaries. The core of the CBIR
system is the dictionary distance between two hy-
perspectral images by means of their previously ex-
tracted dictionaries. The system interacts with a dic-
tionary database where the images dictionaries are
stored. These dictionaries have been previously ex-
tracted by off-line application of a dictionary-based
compression algorithm. System interrogation is done
using a query example approach. Firstly, the query
example is processed to extract its dictionary and sec-
ondly, it is compared to the images in the database
using the dictionary distance. A ranking of the im-
ages in the database is elaborated by ascending order
of dissimilarity (ascending distance) to the query. Fi-
nally, the system returns the k images in the database
corresponding to the first k ranking positions, where
k is known as the query’s scope.
5 EXPERIMENTAL
METHODOLOGY
5.1 Datasets
The hyperspectral HyMAP data was made available
from HyVista Corp. and German Aerospace Center’s
(DLR) optical Airborne Remote Sensing and Calibra-
tion Facility service
1
. The sensed scene corresponds
to the radiance captured by the sensor in a flight line
over the facilities of the DLR center in Oberpfaffen-
hofen (Germany) and its surroundings, mostly fields,
1
http://www.OpAiRS.aero
Figure 1: Hyperspectral CBIR based on dictionary schema.
forests and small towns. Figure 2 shows the scene
captured by the HyMAP sensor. The data cube has
2878 lines, 512 samples and 125 bands; and the pixel
values are represented by 2-bytes signed integers.
We cut the scene in patches of 64 × 64 pixels size
for a total of 360 patches forming the hyperspectral
database used in the experiments. We grouped the
patches by visual inspection in five rough categories.
The three main categories are ’Forests’, ’Fields’ and
’Urban Areas’, representing patches that mostly be-
long to one of this categories. A ’Mixed’ category was
defined for those patches that presented more than one
of the three main categories, being not any of them
dominant. Finally, we defined a fifth category, ’Oth-
ers’, for those patches that didn’t represent any of the
above or that were not easily categorized by visual in-
spection. The number of patches per category are: (1)
Forests: 39, (2) Fields: 160, (3) Urban Areas: 24, (4)
Mixed: 102, and (5) Others: 35.
We defined three datasets to validate the use of the
proposed Spectral-Spatial CBIR system in a real life
scenario. In the first dataset we included the patches
belongingto the three main categories: Forests, Fields
and Urban Areas. In second dataset we add patches
from the fourth category: Mixed. Finally, third
dataset contains the patches from all five categories.
5.2 CBIR Performance Measures
Evaluation metrics from information retrieval field
have been adopted to evaluate CBIR systems qual-
ity. The two most used evaluation measures are preci-
sion and recall (Smeulders et al., 2000; Daschiel and
Datcu, 2005). Precision, p, is the fraction of the re-
turned images that are relevant to the query. Recall,
q, is the fraction of returned relevant images respect
to the total number of relevant images in the database
according to a priori knowledge. If we denote T the
set of returned images and R the set of all the images
relevant to the query, then
p =
|T ∩ R|
|T|
(6)
r =
|T ∩ R|
|R|
(7)
ICPRAM 2012 - International Conference on Pattern Recognition Applications and Methods
428

Figure 2: Hyperspectral scene by HyMAP sensor captur-
ing the DLR facilities in Oberpfaffenhofen and its surround-
ings.
Precision and recall follow inverse trends when
considered as functions of the scope of the query.
Precision falls while recall increases as the scope in-
creases. To evaluate the overall performance of a
CBIR system, the Average Precision and Average Re-
call are calculated over all the query images in the
database. For a query of scope k, these are defined as:
P
k
=
1
N
N
∑
α=1
P
k
(H
α
) (8)
and
R
k
=
1
N
N
∑
α=1
R
k
(H
α
). (9)
The Normalized Rank (Muller et al., 2001) is a
performance measure used to summarize system per-
formance into an scalar value. The normalized rank
for a given image ranking Ω
α
, denoted as Rank(H
α
),
is defined as:
Rank(H
α
) =
1
NN
α
N
α
∑
i=1
Ω
i
α
−
N
α
(N
α
− 1)
2
!
, (10)
where N is the number of images in the dataset, N
α
is
the number of relevant images for the query H
α
, and
Ω
i
α
is the rank at which the i-th image is retrieved.
This measure is 0 for perfect performance, and ap-
proaches 1 as performance worsens, being 0.5 equiv-
alent to a random retrieval. The average normalized
rank, ANR, for the full dataset is given by:
ANR =
1
N
N
∑
α=1
Rank(H
α
). (11)
5.3 Methodology
We independently test the NCD (3), the NDD (4) and
the FDD (5) in three experiments corresponding to
each of the three previously defined datasets. Each
hyperspectral image is first converted to a text file in
two ways: pixel-wise and band-wise. Given that a
image in a dataset is 64× 64 pixels size and has 125
bands, in the pixel-wise ordering the text file is built
concatenating the pixels of the images in a zig-zag
way, where a pixel is a 125-components vector. In
the band-wise ordering the text file is built concate-
nating the bands of the image, where a band is re-
ordered in zig-zag to form a 64
2
-components vector.
The NDD and FDD are calculated using the dictio-
naries extracted by the LZW compression algorithm.
The NCD is calculated by CompLearn
2
software us-
ing default options, that is BZLIB compressor.
For each hyperspectral image H
α
in a dataset we
calculate the dissimilarity measure between H
α
and
2
http://www.complearn.org
DICTIONARY BASED HYPERSPECTRAL IMAGE RETRIEVAL
429
each of the remaining images in the dataset using a se-
lected distance. These dissimilarities are represented
as a vector s
α
= [s
α1
, . . . , s
αN
], where N is the number
of images in the dataset and s
α,β
is the dissimilarity
between the images H
α
and H
β
, with α, β = 1, . . . , N.
We can define the ranking of the dataset relative to the
query image, Ω
α
= [ω
α, p
∈ {1, . . . , N}; p = 1, . . . , N],
as the set of image indexes ordered according to in-
creasing values of their corresponding entries in the
dissimilarity vector s
α
. That is, we sort in increas-
ing order the components of s
α
, and the correspond-
ing rendering of image indexes constitute Ω
α
, so that
s
α,ω
α, p
≤ s
α,ω
α, p+1
.
Finally, we estimate the CBIR system perfor-
mance measures, average precision, average recall
and average normalized rank, as follows. For each hy-
perspectral image H
α
, a query Q
k
(H
α
) is formulated
returning the k most similar (less dissimilar) images
H
β
in the dataset relative to the image H
α
, where k is
the scope of the query and takes values in the range
1 ≤ k ≤ N. The groundtruth for a query image H
α
is
a ranking, Ω
GT
α
, given by the a-priori categorization
made by visual inspection. Given a query Q
k
(H
α
),
the set of returned images T
k
(H
α
) and the set of rele-
vant images V
k
(H
α
) are defined as follows:
T
k
(H
α
) = Ω
α,k
=
h
ω
α, p
s.t. s
α,ω
α, p
≤ s
α,ω
α,k
i
(12)
V
k
(H
α
) = Ω
GT
α
= [β s.t. C (β) = C (α)] (13)
where C (γ) indicates the category to which the
patch H
γ
belongs. This way, the relevant set for a
query patch H
α
is formed for all those patches be-
longing to its same category C (α). Now T
k
(H
α
) and
V
k
(H
α
) can be used to calculate the average precision
and recall measures of the system, as well as the av-
erage normalized rank.
6 RESULTS
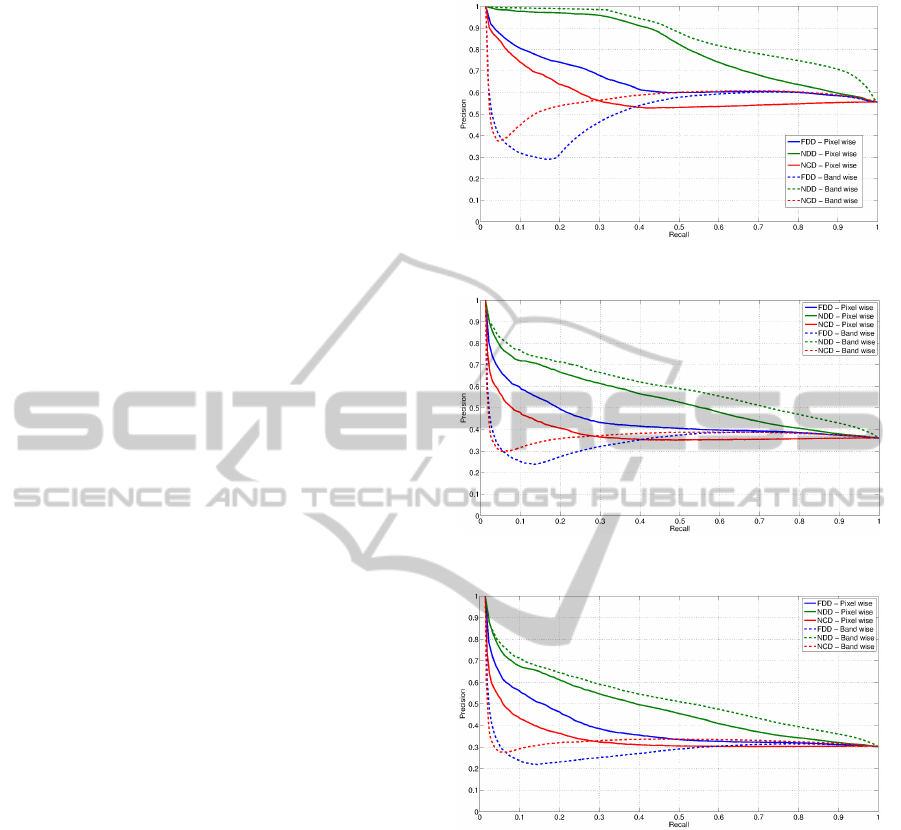
Figures 3-5 show the precision-recall curves for ex-
periments 1, 2 and 3 respectively. In each figure six
precision-recall curves are drawn, corresponding to
the three compared distances, NDD, FDD and NCD,
applied to the datasets converted into text strings us-
ing pixel-wise and band-wise orderings. In all the ex-
periments NDD outperforms the other distances inde-
pendently of the image to text string conversion or-
dering used. NCD outperforms FDD showing that
the lack of a normalization factor in the FDD is an
important issue, affecting the performance of the re-
trieval system. Furthermore, we expected the band-
wise ordering to perform better than the pixel-wise
Figure 3: Precision-recall curves for HyMAP experiment 1.
Figure 4: Precision-recall curves for HyMAP experiment 2.
Figure 5: Precision-recall curves for HyMAP experiment 3.
ordering due to the high correlation on consecutive
bands. Accordingly, the band-wise NDD gives the
best performance in all the experiments. However,
surprisingly, the band-wise ordering shows a bad per-
formance for low recall values using FDD and NCD,
improving as the recall values increase up to perfor-
mances similar to the pixel-wise ordering. In gen-
eral, the performance decreases smoothly as we in-
clude hardest categories, ’Mixed’ category in experi-
ment 2 and ’Others’ category in experiment 3, yield-
ing still good precision-recall values for the NDD
function. Also, NCD presents a general lower preci-
sion compare to dictionary-based distances, although
its performance decreases more slowly than the per-
formances of NDD and FDD as we add more difficult
categories.
ICPRAM 2012 - International Conference on Pattern Recognition Applications and Methods
430

Tables 1-3 show the Average Normalized Rank
(ANR) for the experiments 1, 2 and 3 respectively.
ANR results confirms the average outperform of
NDD over FDD and NCD, although FDD slightly
outperforms NDD in some cases. Interestingly, ANR
can partially explain the effect in the FDD and NCD
precision-recall curves using band-wise ordering for
low recall values, as it shows FDD is having problems
retrieving the ’Fields’ category and NCD is having
problems retrieving the ’Forests’ and ’Urban Areas’
categories. Further experiments must be conduced to
give a better explanation to why band-wise ordering
affects so much FDD and NCD performance.
Table 1: ANR results for HyMAP experiment 1.
ANR
Category FDD NDD NCD
Forests 0.015 0.010 0.129
Fields 0.143 0.090 0.180
Urban Areas 0.005 0.005 0.086
Average 0.055 0.035 0.132
(a) Pixel-wise ordering
ANR
Category FDD NDD NCD
Forests 0.073 0.014 0.292
Fields 0.159 0.038 0.118
Urban Areas 0.004 0.004 0.668
Average 0.079 0.019 0.359
(b) Band-wise ordering
Table 2: ANR results for HyMAP experiment 2.
ANR
Category FDD NDD NCD
Forests 0.069 0.053 0.168
Fields 0.283 0.210 0.299
Urban Areas 0.011 0.012 0.108
Mixed 0.223 0.236 0.311
Average 0.146 0.128 0.222
(a) Pixel-wise ordering
ANR
Category FDD NDD NCD
Forests 0.130 0.064 0.310
Fields 0.316 0.142 0.219
Urban Areas 0.005 0.006 0.681
Mixed 0.219 0.226 0.359
Average 0.167 0.109 0.392
(b) Band-wise ordering
7 CONCLUSIONS
We have introduced a Content-Based Image Retrieval
System for hyperspectral databases using dictionar-
ies. The use of a parameter-free approach based on
Table 3: ANR results for HyMAP experiment 3.
ANR
Category FDD NDD NCD
Forests 0.065 0.049 0.162
Fields 0.323 0.235 0.315
Urban Areas 0.011 0.013 0.107
Mixed 0.246 0.254 0.318
Others 0.197 0.232 0.425
Average 0.169 0.156 0.266
(a) Pixel-wise ordering
ANR
Category FDD NDD NCD
Forests 0.130 0.061 0.304
Fields 0.369 0.164 0.226
Urban Areas 0.006 0.008 0.674
Mixed 0.254 0.250 0.360
Others 0.177 0.210 0.570
Average 0.187 0.139 0.427
(b) Band-wise ordering
the Normalized Compression Distance (NCD) is not
possible due to the computational cost of compriss-
ing the query image together to each of every image
in the database. The dictionaries approach solves the
computational cost problem by approximating NCD
using dictionaries extracted offline from each of the
database images. Results using real hyperspectral
datasets show that the Normalized Dictionary Dis-
tance (NDD) outperforms the Fast Dictionary Dis-
tance (FDD) and the NCD. We also show that in or-
der to extract the dictionaries (or compress the sig-
nals for the NCD) the arrangement of the image data
in the conversion of the image to a text file affects
severelly the performance of the FDD and NCD sim-
ilarity functions. Further experiments must be con-
duced to find an explanation of that unexpected effect.
Generally, we can conclude that the presented results
validate the use of dictionaries for hyperspectral im-
age retrieval.
ACKNOWLEDGEMENTS
The authors very much acknowledge the support of
Dr. Martin Bachmann from DLR. Miguel A. Vegan-
zones is supported by predoctoral grant BFI 07.225
from the Basque Government.
REFERENCES
Bennett, C., Gacs, P., Li, M., Vitanyi, P. M., and Zurek,
W. (1998). Information distance. Information Theory,
IEEE Transactions on, 44(4):1407–1423.
DICTIONARY BASED HYPERSPECTRAL IMAGE RETRIEVAL
431

Cerra, D. and Datcu, M. (2010). Image retrieval us-
ing compression-based techniques. In 2010 Interna-
tional ITG Conference on Source and Channel Coding
(SCC), pages 1–6. IEEE.
Cerra, D., Mallet, A., Gueguen, L., and Datcu, M. (2010).
Algorithmic information Theory-Based analysis of
earth observation images: An assessment. IEEE Geo-
science and Remote Sensing Letters, 7(1):8–12.
Chaitin, G. J. (2004). Algorithmic Information Theory.
Cambridge University Press.
Cilibrasi, R. and Vitanyi, P. (2005). Clustering by com-
pression. Information Theory, IEEE Transactions on,
51(4):1523–1545.
Daschiel, H. and Datcu, M. (2005). Information mining
in remote sensing image archives: system evaluation.
Geoscience and Remote Sensing, IEEE Transactions
on, 43(1):188–199.
Li, M., Chen, X., Li, X., Ma, B., and Vitanyi, P. (2004). The
similarity metric. Information Theory, IEEE Transac-
tions on, 50(12):3250–3264.
Li, M. and Vitanyi, P. (1997). An Introduction to Kol-
mogorov Complexity and Its Applications. Springer,
2nd edition.
Macedonas, A., Besiris, D., Economou, G., and Fotopou-
los, S. (2008). Dictionary based color image retrieval.
Journal of Visual Communication and Image Repre-
sentation, 19(7):464–470.
Muller, H., Muller, W., Squire, D. M., Marchand-Maillet,
S., and Pun, T. (2001). Performance evaluation in
content-based image retrieval: overview and propos-
als. Pattern Recognition Letters, 22(5):593–601.
Plaza, A., Plaza, J., Paz, A., and Blazquez, S. (2007). Paral-
lel CBIR system for efficient hyperspectral image re-
trieval from heterogeneous networks of workstations.
In International Symposium on Symbolic and Numeric
Algorithms for Scientific Computing, 2007. SYNASC,
pages 285–291. IEEE.
Shannon, C. E. (2001). A mathematical theory of commu-
nication. SIGMOBILE Mob. Comput. Commun. Rev.,
5(1):3–55.
Smeulders, A., Worring, M., Santini, S., Gupta, A., and
Jain, R. (2000). Content-based image retrieval at the
end of the early years. Pattern Analysis and Machine
Intelligence, IEEE Transactions on, 22(12):1349–
1380.
Solomonoff, R. J. (2009). Algorithmic probability: Theory
and applications. In Information Theory and Statisti-
cal Learning, pages 1–23. Springer US, Boston, MA.
Veganzones, M. A., Maldonado, J. O., and Grana, M.
(2008). On Content-Based image retrieval systems
for hyperspectral remote sensing images. In Compu-
tational Intelligence for Remote Sensing, volume 133
of Studies in Computational Intelligence, pages 125–
144. Springer Berlin / Heidelberg.
Watanabe, T., Sugawara, K., and Sugihara, H. (2002). A
new pattern representation scheme using data com-
pression. Pattern Analysis and Machine Intelligence,
IEEE Transactions on, 24(5):579–590.
ICPRAM 2012 - International Conference on Pattern Recognition Applications and Methods
432
