
AUTOMATIC DETECTION OF PALE PATH AND OVERLAPS
IN CHROMOSOME IMAGES USING ADAPTIVE SEARCH
TECHNIQUE AND RE-THRESHOLDING
Rajeev Ranjan
1
, Akila Subasinghe A.
2
, Jagath Samarabandu
2
, Peter K. Rogan
3
and Joan H. M. Knoll
4
1
Indian Institute of Technology, Electronics and Electrical Communication Engineering, Kharagpur, India
2
Image Recognition & Intelligent Systems Laboratory, Electrical and Computer Engineering,
University of Western Ontario, Ontario, CA, N6A 5B9, Canada
3
Departments of Biochemistry, Schulich School of Medicine & Dentistry,
University of Western Ontario, Ontario, CA, N6A 5C1, Canada
4
Departments of Pathology, Schulich School of Medicine & Dentistry,
University of Western Ontario, Ontario, CA, N6A 5C1, Canada
Keywords: Image Analysis, Segmentation, Chromosomes, Cut-points, Pale Path, Search Window, Thresholding.
Abstract: Detection and separation of overlapping and touching chromosomes is a critical issue in image analysis
applications for cytogenetics where accurately segmented chromosomes are essential. We present a novel
method of automatic pale path detection for all types of stained chromosome images. Optimum number of
cut-points for each cluster of touching or overlapping chromosomes is obtained and analysed sequentially
for the pale paths. A self-adaptive search window searches for the minimum grayscale intensity beginning
from the vicinity of a cut-point and propagates gradually till the end of pale path. Efficient image and area
thresholding restricts the faulty detection of touch or overlap in a chromosome cluster.
1 INTRODUCTION
Images of human metaphase cells show individual
chromosomes as discrete objects, each of which can
adopt varied and inconsistent morphologies. For
cytogenetic analysis, it is important that the
chromosomes in an image be analyzed individually
in order to detect structural abnormalities
responsible for congenital diseases or cancer. During
preparation, chromosomes may overlap or touch one
another. The degree to which they coincide with one
another may significantly vary from cell to cell. The
process of segmenting images into individual
chromosomes involves defining the boundaries of
chromosomes. This procedure needs to be both
accurate and comprehensive in order to detect
chromosome abnormalities.
In order to analyse the structure of individual
chromosomes, a digital cell image has to be
segmented accurately. The segmentation process can
be challenging mainly due to intensity dispersions
and overlapping between chromosomal bodies.
Detecting and separating touching and overlapping
chromosomes in a digital cell image will improve
segmentation accuracy significantly.
Manual detection and separation of occluded
chromosomes in digital images can be very time
consuming. Early work in automating this process
included applying a variety of segmentation methods
like heuristic edge-linking, region growing, fuzzy-
logic, etc. A rule based chromosome segmentation
procedure (Liang, 1994) explores the possibility of
using a rule based classification and segmentation
parameter set for each cell. In the knowledge-based
chromosome contour searching method (Agam and
Dinstein, 1997) an edge-preserving smoothing
nonlinear filter is applied to remove random noise
while preserving the edges of chromosomes. A
classification driven partially occluded object
segmentation (CPOOS) method was proposed to
resolve partial occlusion in chromosome images
(Lerner, Guterman, and Dinstein, 1998). Minimum
entropy segmentation algorithm was also
investigated to decompose or separate groups of
chromosomes that touch and overlap each other
(Schwartzkopf, 2001). Automatic segmentation of
metaphase cells was also discussed based on global
context and variant analysis (Ritter and Gao, 2008).
Watershed algorithm also finds its utilisation in
segmentation of narrow-touching chromosomes
462
Ranjan R., Subasinghe A. A., Samarabandu J., K. Rogan P. and H. M. Knoll J..
AUTOMATIC DETECTION OF PALE PATH AND OVERLAPS IN CHROMOSOME IMAGES USING ADAPTIVE SEARCH TECHNIQUE AND
RE-THRESHOLDING.
DOI: 10.5220/0003862604620466
In Proceedings of the International Conference on Computer Vision Theory and Applications (VISAPP-2012), pages 462-466
ISBN: 978-989-8565-03-7
Copyright
c
2012 SCITEPRESS (Science and Technology Publications, Lda.)

(Ming and Tian, 2010). Most of the procedures
discussed above cater only to a particular type of
banded chromosomes. They fail in analysing any
chromosome images that are stained in a different
manner than what the procedure demands.
In this paper, we propose an algorithm that
automatically separates the touching chromosomes
and detects overlapping chromosomes by optimum
thresholding and self-adaptive search window for
pale path detection. Unlike other methods, this
algorithm is applicable for all types of stained
chromosome images.
The rest of the paper has been organized as
follows. Section 2.1 provides an insight into the
classification of chromosome images into two basic
categories. Section 2.2 introduces the proposed
method of obtaining high concavity points using
moving average filter while section 2.3 presents the
proposed method of local thresholding for pale path
detection in case of touching chromosomes. A given
area constraint is also applied to prevent
segmentation of unwanted small groups of pixels
from a chromosome and is discussed in section 2.4.
2 PROPOSED ALGORITHM
2.1 Image Classification
The chromosome images can be broadly classified
into two groups: one with more of “cross-like”
chromosomes (in which sister chromosomes have
prematurely separated) and another in which the
sister chromosomes have coalesced into a single,
uninterrupted homologous pair.We apply an
automatic classification mechanism based on
counting branch-points of the binarized and thinned
image. This classification plays crucial role in
decision making of pale path (Section 2.3).
2.2 Determination of Cut-points
A window size of 200 x 200 pixels is manually
selected from nuclei free grayscale image containing
the object of our interest as shown in Figure 1.
To determine the points of concavity in the
contour, we use the exterior angle of boundary
pixels (calculated between adjacent pixels). Due to
the discreteness of the pixels, they belong to the set
of angles {π/2,3π/4, π, 5π/4 and 3π/2}
A high concavity point in the boundary layer
demands following characteristics.
• Its angle should be either 3π/4 or π/2
(a) (b)
Figure 1: (a) Binary image of the selected object. (b) The
single pixel thick contour developed from the given binary
image.
• The mean of the angles for a given set of
neighbourhood [x-N, x+N] must be less than π
(1)
• This mean obtained above should never exceed
π for all the sets of neighbourhood less than
(+N) range of that point.
(2)
To obtain the mean of the angles, a moving
average filter with a width of 3 is applied to the set
of angles.
Moving average filter is then applied with
iterating filter width initially set to 1. The iteration
stops if the mean angle value exceeds pi or when the
iterations reach N cycles. To meet all the 3
conditions specified above for a concave point, we
define two sets of boundary pixels X and Y. Set X
contains all the pixels having angles π/2 or 3π/4. Set
Y comprises of pixels with angles after application
of moving average filter being less than π. The
intersection of Set X and Set Y gives us the desired
high concavity points or cut-points.
2.3 Singularity/touch/overlap Detection
An object is classified as a single chromosome if the
number of cut-points (NCP) is less than 2 because
any overlap or touch requires at least two high
concavity points. If their number is more than 2, we
try to find a pale path originating from each cut-
points to judge whether the object contains touching
chromosomes (section 2.3.1). Once the pale path
succeeds in dividing the object, the sub-parts are
further analysed individually by finding out their
NCPs. If they exceed the value 2, we go for the
search of pale path in that sub-part until there are no
(
)
)(
12
1
∑
−
=
<+
+
N
N
i
ixangle
N
π
(
)
,)(
12
1
NKallforixangle
K
K
K
i
<<+
+
∑
−
=
π
AUTOMATIC DETECTION OF PALE PATH AND OVERLAPS IN CHROMOSOME IMAGES USING ADAPTIVE
SEARCH TECHNIQUE AND RE-THRESHOLDING
463
more pale paths possible. Each newly sub-parts
formed are analysed in the same fashion till all the
cut-points are analysed for pale paths.
After analysing all the high concavity points, the
sub-parts are fed through morphological thinning
operation and again the X or T intersections are
checked. We already know whether an image
constitutes mainly of homologous chromosomes in
which sister-chromatid separation occurs (class A)
or does not (class B). In general, an X shaped
chromosome consists of 2 T-intersections or nodes
whereas a normal chromosome does not contain any
of them. Therefore, a sub-part with number of cut-
points greater than or equal to 2 is considered a
single chromosome, if it contains 2 or more skeleton
nodes for the image of class A or no node for the
image of class B. Any sub-part not complying with
this rule is tagged as overlap.
2.3.1 Pale Path Detection
We can categorize the cut-points into three different
types depending on their local convergent angles:
π/2, 3π/4 and π. The cut-point with convergent angle
π is resultant for close vicinity cut-points reduction.
All the cut-points are set to ‘0’ in the binary image.
For each of them, a 3x3 search is defined. Smallest
intensity within this window is then set to 0, which
is then used as the center of next iteration. The
iteration terminates only when the centre reaches the
boundary of object or the size of the search window
is reduced to 0.
An important point to note here is that the
iterative 3-pixel window search won’t always
provide the correct pale path. It will simply find a
path from one boundary end to another irrespective
of the intensity value traced. That may lead to
dissection of “cross-like” chromosome which would
result in false positive pale path. To overcome this
limitation, we classify the object further into high
intensity regions and pale regions. Only those pixels
which lie in the pale regions are searched for
minimum intensity in the 3-pixel window. If none of
the pixels of the window lie in the pale region, then
the search iteration is stopped, which indicates a
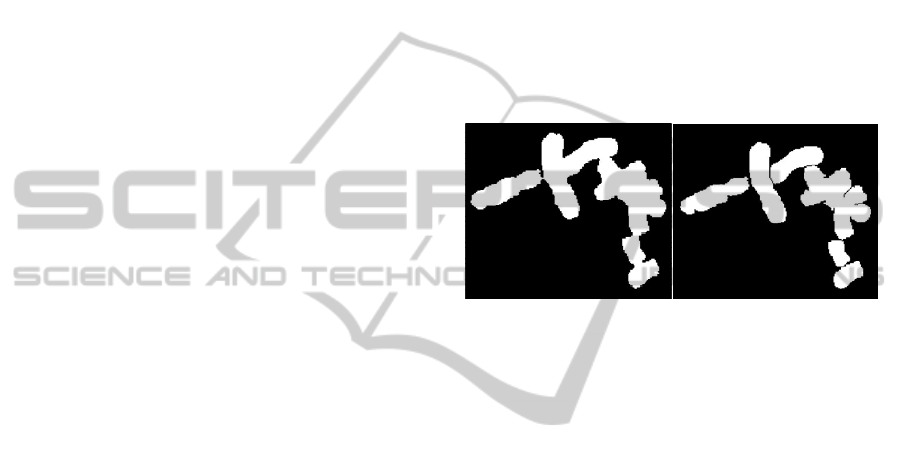
“cross-shaped” chromosome. The pale paths
detected for a group of 8 overlapping and touching
chromosomes is shown in Figure 2.
The classification into relatively high intensity
and pale regions is done by re-thresholding of the
object. The Otsu method applied to the object forms
a pale region that may contain the pale path as well
as a lot of the unwanted surrounding area. To avoid
this, we propose a novel method of classification
using the object’s image histogram.
It can be clearly seen that the pixels of grayscale
intensity less than the Otsu’s threshold plus an offset
can be subdivided into two regions: relatively high
intensity region comprising of chromosome bands
and relatively low regions comprising of pale paths.
In the envelope of the image histogram plot, we find
peaks corresponding to these two regions. Our aim is
to find the threshold around the minima to separate
the pale path region from the unwanted dark bands.
This is fulfilled by applying Intermeans Method on
the pixels less than the sum value of object’s Otsu’s
Threshold and the offset (set to 10) so that the search
window pixels are formed of grayscale intensity less
than the new threshold.
(a) (b)
Figure 2: (a) Binary image of a cluster of overlapping and
touching chromosomes. (b) The pale paths detected for
touching chromosomes.
For the case of class A type chromosomes, the
Intermeans method becomes inefficient because of
the large number pixels in the pale regions. To
compensate for this, Intermeans method is applied
only between the maxima of the two peaks of image
histogram. Hence, the reduced range of intensity
values increases the accuracy for this method.
The new threshold divides the object in a more
constricted pale region. A pixel in a search window
is applicable for search only if it lies in the pale
region obtained from the final threshold. When none
of the window pixels are a part of that region, the
search process stops.
2.4 Optimum Area Criterion
Sometimes, a small-sized extension of the
chromosome may split itself if it lies in the pale
region generated. To avoid such kind of anomalies,
we restrict the ‘pale-path splitting’ by an area
threshold. Only those sub-parts with a size more
than the area threshold can split to form a separate
chromosome. The area threshold is decided by
computing the mean and standard deviation (SD) of
the area of all the objects of binary image. Objects
with very large area are excluded, as they have a
VISAPP 2012 - International Conference on Computer Vision Theory and Applications
464
high chance of containing an overlap. The minimum
area of an object is also calculated and stored (A
min
).
We define an area threshold which is given by:
A
th
i
= Mean – (i/2)*SD, i ϵ I (3)
We increment ‘i’ starting from 1 and compute
A
th
i
successively. At each iteration, A
th
i
is compared
against A
min
. The iteration stops when A
th
i
becomes
less than this minimum area. The final threshold area
is chosen to be A
th
i-1
that is, the area threshold just
greater than A
min
.
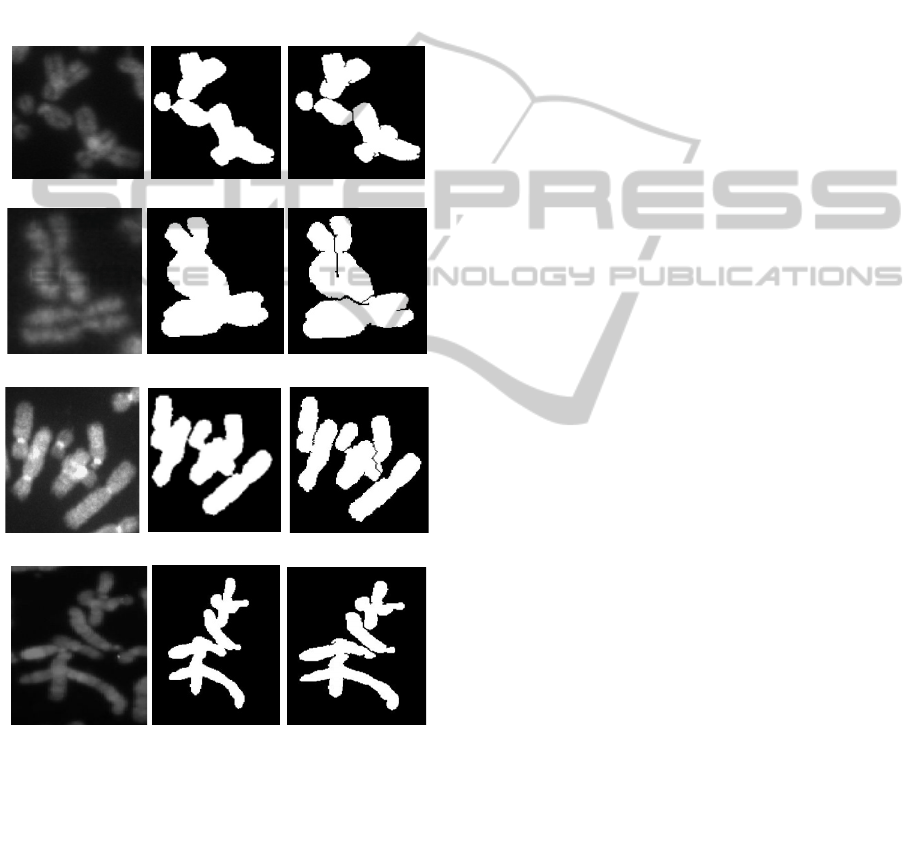
(a)
(b)
(c)
(d)
Figure 3: Pale path detection in chromosomes, left:
grayscale image, centre: binary image, right: binary image
with pale paths. (a) Class A, non-banded. (b) Class A,
banded. (c) Class B, non-banded. (d) Class B, banded.
Hence, A
th
i-1
is taken as the minimum area
threshold. This area thresholding ensures prevention
of unnecessary splitting of very small pixel groups
in the pale region of object.
3 RESULTS AND DISCUSSION
The method discussed above was tested for
successful separations of touching chromosomes
using a variety of chromosome images. It was tested
with ‘cross-like’ chromosomes as well as smooth
curvature chromosome images in which it succeeded
in providing reliable results.
Pale path, touch and
overlap detection in a typical chromosome cluster of
‘Class A’ and ‘Class B’ images for both banded and
non-banded chromosomes is depicted in figure 3.
The proposed does not require any prior set of
knowledge, hence minimising the complexity. It also
requires minimum pre-processing and post-
processing techniques, hence further reducing
computational burden. Optimum area and intensity
thresholds restrict any plausible flaw that may arise
during pale path detection.
4 CONCLUSIONS
This paper introduces a simple and effective method
for pale path detection to separate touching
chromosomes in images of metaphase cells. A low
order finite impulse response moving average filter
is used to evaluate potential cut- points. Efficient re-
thresholding helps in discarding the unwanted search
regions, especially those which produce false paths
due to chromosome banding.
An analogous approach can be used for the
segmentation of overlapping chromosomes so that
they can also be analysed for valuable information.
This would involve the length ratio of the arms of
overlapping ‘class A’ chromosomes. Multiple
overlaps could also be separated by first computing
the number of overlaps and satisfying the arm length
ratios accordingly.
REFERENCES
Otsu, N., 1978. A threshold selection method from gray-
level histograms, IEEE Trans. Sys. Man. Cyber.,
SMC8 1277-1294.
Liang, J., 1994. “Fully automatic chromosome
segmentation,” Cytometry, vol. 17, pp. 196–208.
Agam, G., Dinstein, I., 1997. Geometric separation of
partially overlapping nonrigid objects applied to
automatic chromosome classification IEEE Trans.
Pattern Anal. Mach. Intell. 19 1212–22.
Lerner, B., Guterman, H., Dinstein, I., 1998. A
classification-driven partially occluded object
segmentation (CPOOS) method with application to
chromosome analysis. IEEE Transactions on Signal
AUTOMATIC DETECTION OF PALE PATH AND OVERLAPS IN CHROMOSOME IMAGES USING ADAPTIVE
SEARCH TECHNIQUE AND RE-THRESHOLDING
465

Processing, 46:2841-2847.
Schwartzkopf, W., Evans, B. L., Bovik, A. C., 2001
Minimum entropy segmentation applied to multi-
spectral chromosome images, International
Conference on Image Processing vol 2, pp 865–8.
Ritter, G., Gao, L., 2008. Automatic segmentation of
metaphase cells based on global context and variant
analysis. Pattern Recognition, 41(1):38-55.
Ming, D., Tian, J., 2010. Automatic Pattern Extraction and
Classification for Chromosome Images. Journal of
Infrared, Millimeter and Terahertz Waves, Volume 31,
866-877.
VISAPP 2012 - International Conference on Computer Vision Theory and Applications
466
