
OBJECT VOLUMETRIC ESTIMATION BASED ON GENERIC
FITTED PRIMITIVES FOR SERVICE ROBOTICS
Tiberiu T. Cociaș, Sorin M. Grigorescu and Florin Moldoveanu
Departament of Automation, Transilvania University of Brașov, Brașov, Romania
Keywords: Robot Vision, 3d Object Reconstruction, Surface Approximation, Primitive Fitting, Service Robotics.
Abstract: This paper present an approach for object surface estimation from a single perspective using a stereo camera
configuration. The goal of the method is to capture the particularity of an object of interest by fitting a
generic primitive who best models the recognized shape. The shape modeling process is performed on 3D
Regions of Interest (ROI) obtained by classifying the objects present in disparity maps. The principle uses a
number of control points, calculated from the primitive Point Distribution Model (PDM). These control
points drive the modeling behavior in the disparity point cloud data based on the principle of active
contours, or snakes. Finally a compact 3D object mesh can be generated using Delaunay triangulation. The
obtained PDM models are intended to be used for the purpose of precise object manipulation in service
robotics applications.
1 INTRODUCTION
Nowadays most service robotics applications use
depth perception for the purpose of environment
understanding. In order to precisely locate, grasp and
manipulate an object, a robot has to estimate as good
as possible the pose and the structure of that object
of interest. For this reason different visual
acquisition devices, such as stereo cameras, range
finder or structured light sensors, are used (Trucco
and Verri, 1998).
For online manipulation, together with the pose
of the object, it is needed to determine the 3D
particularities of the viewed structure in order to
estimate its shape (Hartley and Zisserman, 2004).
There are several types of methods that focus on
the 3D reconstruction of objects using multiple
perspectives. Such methods try to reconstruct the
convex hull of the object (Matsuyama et al., 2004),
or to recover its photo-hull (Kutulakos and Seitz,
2000). Other algorithms explore the minimization of
the object’s surface integral with a certain cost
function over the surface shape (Lhuillier and Quan,
2005).
On the other hand, the reconstruction can be
addressed also from a single view. This technique is
usually efficient when applied to regular surface
objects. An early approach for this challenge was
investigated for piecewise planar reconstructions of
paintings and photographs (Horry et al., 1997).
Subsequent improvements of the technique
(Criminisi et al., 2000), (Sturm and Maybank, 1999)
increased the geometric precision especially for
scenes with multiple vanishing planes.
In terms of reconstruction resolution and
accuracy, range images (e.g. from laser scanners)
provide one of the best surface estimations from all
techniques. However, it has speed deficiency, sensor
dimension and power consumption (Kim et al.,
2009).
The main challenge encountered during 3D
reconstruction is the automatic computation of the
3D transformations that align the range data. Thus,
the registration of different perspective point clouds
into one common coordinate system represents one
of the most researched topics in the vision
community (Kim, 2009), (Stamos et al., 2008).
The rest of the paper is organized as follows. In
Section 2 a brief description of the image processing
chain is provided. The main contribution of the
paper, that is the 3D shape modeling approach, is
given in Section 3. Finally, before conclusions,
performance evaluation results are presented in
Section 4.
191
CociaÈ
´
Z T., Grigorescu S. and Moldoveanu F..
OBJECT VOLUMETRIC ESTIMATION BASED ON GENERIC FITTED PRIMITIVES FOR SERVICE ROBOTICS.
DOI: 10.5220/0003862801910197
In Proceedings of the International Conference on Computer Vision Theory and Applications (VISAPP-2012), pages 191-197
ISBN: 978-989-8565-04-4
Copyright
c
2012 SCITEPRESS (Science and Technology Publications, Lda.)
2 MACHINE VISION APARATUS
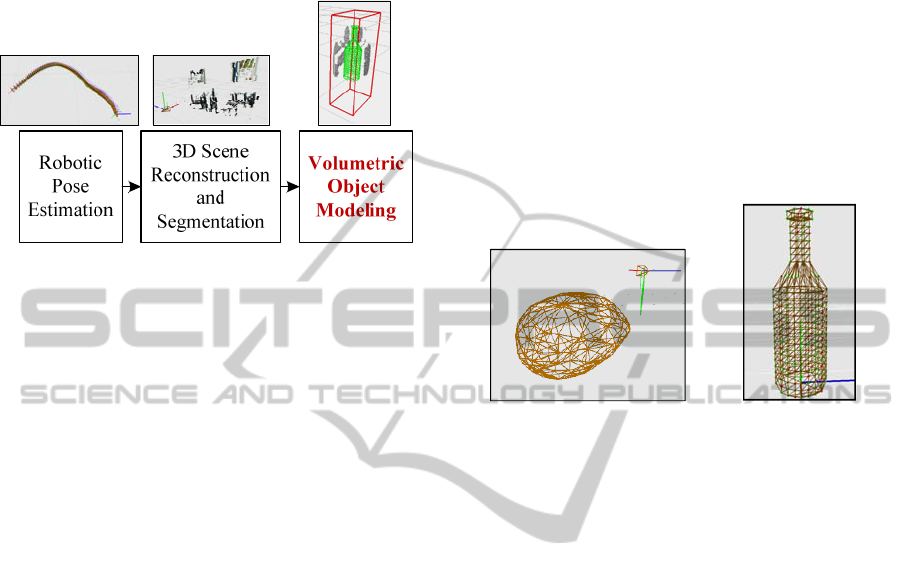
The block diagram of the proposed scene perception
system can be seen in figure 1.
Figure 1: Block diagram of the proposed scene perception
system.
The reference coordinates of the obtained visual
information is related to the on-line determined
position and orientation (pose) of a robot, that is, of
a robot’s stereo camera system (Grigorescu et al.,
2011). Once a certain pose is determined, the
imaged scene can be reconstructed and segmented
for the purpose of environment understanding. The
main objective here is to get the depth, or disparity,
map which describes the 3D structure of an imaged
scene. This information is further used by the final
object volumetric modeling algorithm, which is
actually the main focus of this paper. One of the
main algorithms used in the proposed vision system
is the object classification method which delivers to
the volumetric modeling method the object class and
the 2D object ROI. The classification procedure is
based on color and depth information. A detailed
description of the approach can be found in
(Grigorescu et al., 2011).
3 OBJECT VOLUMETRIC
MODELLING
The object volumetric modeling system is based on
the active contour principle used to manipulate a set
of pre-defined Point Distribution Models (PDM) by
stretching them over a disparity point cloud
describing an object in a given Region of Interest
(ROI). In the considered process, three main
challenges arise: the sparse nature of the disparity
maps, the calculation of the 3D ROI and the
nonlinear object modeling.
3.1 PDM Primitive
In the presented work, an object generic primitive is
defined as a PDM model which serves as a backbone
element forconstructing a particular object, or shape.
The generic PDM primitive is represented by a data
structure that has as background component a shape
vector which contains 3D feature points
describing the model of an object class. Such
example models are shown in figure 2. Additionally,
the structure contains a scale factor , a rotation
matrix and a translation matrix that relates the
PDM to a canonical reference coordinate system.
(a)
(b)
Figure 2: Generic meshed PDM models. (a) Potato.
(b)Bottle.
Since in the considered source of visual
information, that is disparity images, only one
perspective of the imaged object is available, the
PDM model is actually used to compensate for the
missing information. In this case we consider objects
that have a symmetrical shape. Nevertheless, the
proposed approach can be applied on irregular
shaped entities. Depending on the complexity and
regularity of the surface object, the primitive model
can be defined either by a low or a high number of
3D feature points. For example, the bottle shown in
figure 2 is described by 382 feature points. Since the
PDM describing such an object represents a regular
surface, not all these points are important for the
object modeling process. The so-called control
points, namely those points that define the shape of
an object, can be automatically determined based on
three main characteristics (Cootes, 1995):
1. Points marking the center of a region or sharp
corners of a boundary;
2. Points marking a curvature extreme or the
highest point of an object;
3. Points situated at equal distance around a
boundary between two control points obeying
rule one.
In the same time, control points can be
determined manually under the guidance of a human
VISAPP 2012 - International Conference on Computer Vision Theory and Applications
192
(Zheng et al., 2008). This last method captures the
features of an object more efficiently but suffers
from subjectivity on features definition since the
process is controlled by a human person. Depending
on the modeled object, in our approach we used both
the automatic and the manual techniques to
determine control points. Using the introduced
points, the computation time is increased since the
number of points describing the shape of an object is
usually much lower than the total number of points
from the PDM. The 3D positions of the PDM points
are actually directly dependent on the positions of
the control points, as it will later be shown in this
section. For example, from a total of 382 points
describing the bottle primitive from figure 2(b), only
71 of them (marked with red dots) are considered to
be control points. On the other hand,for a complex
object, this number can be equal to the initial PDM
features number, meaning that all points from the
primitive are considered to be control points since
all of them are needed to capture a specific feature.
Taking into account a lower number of control
points will considerably increase the computational
speed of the modeling process.
3.2 Disparity Map Enhancement
As opposed to newer structured light sensors, such
as the MS Kinect
®
, one main drawback of the
considered visual information is the sparse 3D
structure of disparity maps. Namely, it contains
“holes” or discontinuities in areas where no stereo
feature matching exists (Brown, 2003). Such
discontinuities are present in low textured regions or
constant color areas from the environment.
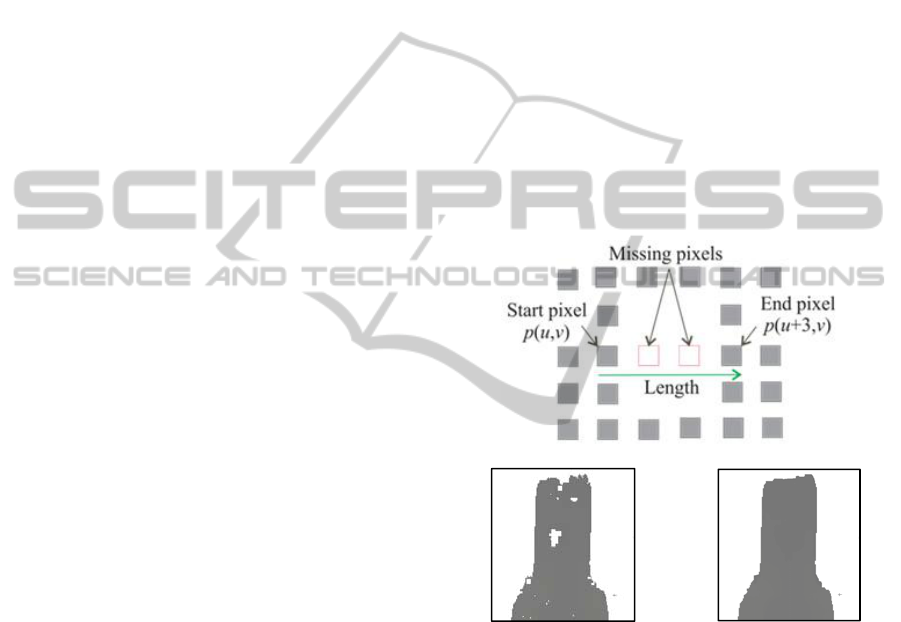
To overcome this issue we propose an
enhancement method which deals with disparity
maps discontinuities. Basically, the idea is to scan
each point from a disparity image and determine if
there is a gap between the considered point and a
neighboring point situated at a certain distance, as
shown in figure 3(a). Since we apply the principle
on disparity maps, which are defined on the 2D
domain, there are only 5 main neighboring
directions from a total of 8 in which we search for
discontinuities. The untreated 3 directions refer to
the back of the centered point and it is assumed that
are no discontinuities in that direction since the
position is already searched.
The disparity map is actually a grey scale image
with pixel intensities inverse-proportional to the
distance between the considered 3D world point and
the camera’s position. Having in mind that the
disparity image is represented using 8 bits, we
sample it using 256 layers, each corresponding to
certain intensity in the disparity domain. The
enhancement process searches for discontinuities
only in one layer at a time, since there is no
information about the connectivity of the intensities.
In this sense, the layers are stored using a 256 bins
histogram. For each pixel in each layer the number
of the same intensity along a direction is calculated.
In order not to merge two different objects, the
search area is reduced to a finite value, dynamically
calculated. The search process starts from the lowest
neighboring distance value, which has a two pixels
length, and ends when a discontinuity is found or the
maximum length is reached. The discontinuity is
determined by comparing the length of the direction
with the number of the same intensity pixels found
along this direction. If the number of pixels found is
below the length of the considered direction, the
missing positions are filled with pixels with the
same intensity as the ones alreadyfound.
(a)
(b)
(c)
Figure 3: Disparity enhancement algorithm. (a) Missing
pixels searching principle. (b)Original disparity map. (c)
Enhanced disparity image.
There is a slight chance that two closely
positioned objects are merged by the algorithm. In
order to overcome this challenge, a variance driven
image of the disparity map has been used (Turiac et
al., 2010). From the variance image only object
contours are extracted. In this way it can be
determined if the points which take part in the fill
process belong to one single region or to a
neighboring region. The result of the presented
method will be a compact and dense representation
of the disparity image, as shown in figure 3(c). On
the other hand, it is needed to connect the layers
OBJECT VOLUMETRIC ESTIMATION BASED ON GENERIC FITTED PRIMITIVES FOR SERVICE ROBOTICS
193

which are very close (in terms of disparity) in the 3D
model. This can be achieved by diffusing the
gradient separating two neighboring intensities. In
order to preserve the 3D features of the object, the
diffusing process will occur only for regions with
translation of intensity no grater then 5 intensities
layers. In this way, the obtained layers are smoothly
connected.
3.3 3D ROI Definition
The 2D segmentationand classification process
provides, besides the class to which the object
belongs, a ROI feature vector
],[
ii
RL
pp
, = 1,2,3,4
defined in the stereo image pair domain. This
description restricts the object search area to a
quadratic region of interest. By computing the
disparity between the left and right ROI points we
obtain a 3D representation of the considered ROI. In
this way only a planar representation (slice)in the 3D
space is obtained. The volumetric property is
evaluated starting with the assumption that the pixels
inside the 2D ROI describe only the object. The
depth is determined statistically by finding the
highest density of 3D points which lie inside the
planar ROI along the Z 3D Cartesian axis. A 3D
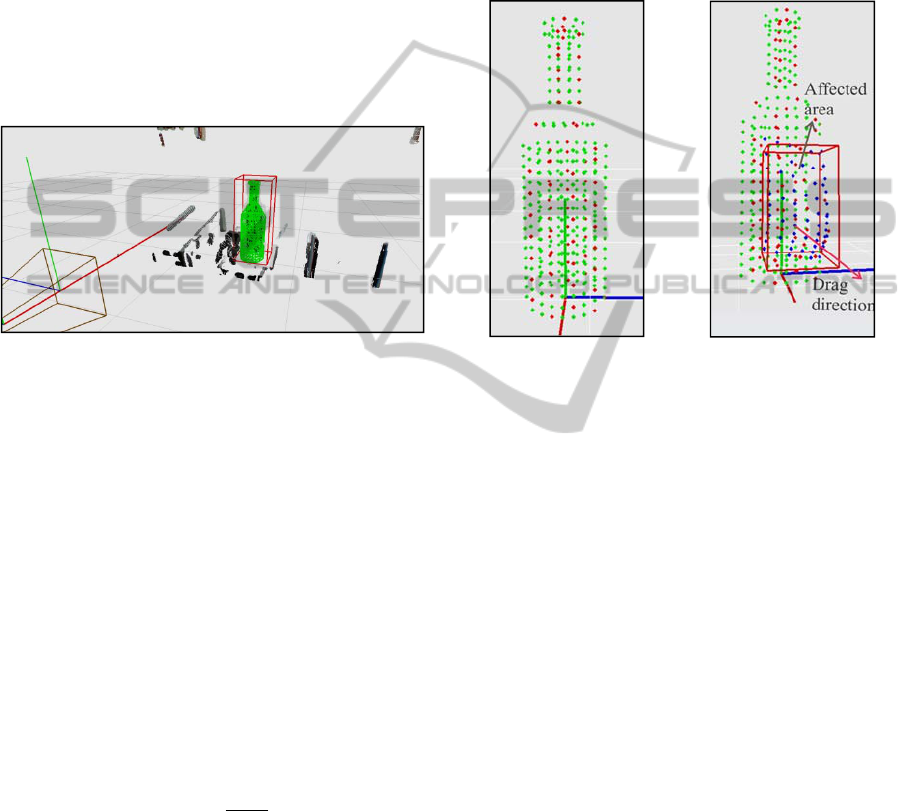
representation of the ROI can be seen in figure 4.
However, there is a possibility that the highest
density of 3D points belongs to a noise entity outside
the object border but still inside the ROI.
(a) (b)
Figure 4: 3D ROI computation. (a) Input image together
with the calculated 2D ROI. (b) 3D ROI reprojection.
To overcome this problem, a histogram of the
disparity image is calculated. Instead of searching
only the top density value of the intensities in
histogram, we check also the highest aperture of the
histogram for the considered top density. Basically
we determine the highest distribution of connected
points by summing all the densities from the slices
of the aperture belonging to a top value of the
histogram as:
∑
+
+
=
bi
ai
ihd ))(max(
,
(1)
Where d represent the highest cluster of 3D points,
ℎ() is the number of pixels for a certain bin i and a,
b are the closest and farthest non zero ℎ
(
)
relatively
to the considered intensity i, respectively. The
margin of the aperture is actually defining the first
and last planes of the 3D ROI volume along the Z
axis, respectively.
3.4 PDM Shape Alignment
The 3D alignment process deals with the calculation
of the rotation and translation of the primitive shape
with respect to the point cloud distribution of the
disparity information inside the 3D ROI. Because
each PDM, that is primitive and point cloud, is
defined in its own coordinates system, a similarity
transformationis used to align the two models. Since
the ROI’s PDM is related to the same coordinate
system as the 3D virtual environment, we have
chosen to bring the primitive’s PDM into a reference
3D environment coordinate system. The reference
coordinate system is given by the on-line determined
pose of the stereo camera (Grigorescu et al., 2011).
In this sense, the primitive is considered to be a
translational shape, while the 3D ROI is marked as a
static cube. The similarity transformation is
described by:
=(
−),
(2)
where,
old
X and
new
X represent the 3D coordinate
of a point before and after the similarity
transformation, s is a scale factor, while R and t are
the matrices defining the rotation and translation of a
point, respectively. These coefficients represent the
Degrees of Freedom (DoF) of a certain shape.
The scale factor is determined based on the 3D
point cloud information inside the ROI. Since a
disparity enhancement is considered before the 3D
reprojection process, it can be presumed that inside
the ROI exist one or more large densities of points
which describe the object of interest. Thus, by
evaluating the distribution of these densities we can
compute a percentage of the size difference between
the object PDM shape and the point cloud within the
3D ROI.
The translation of the moving shape is easily
determined by adding the center of gravity of the
points inside the 3D ROI from the center of gravity
of the primitive PDM, as follows:
∑∑
==
+=
pp
n
i
p
n
i
p
b
n
a
n
t
11
11
(3)
VISAPP 2012 - International Conference on Computer Vision Theory and Applications
194
where,
p
n
represent the number of points of the
model and a and b are the two densities of points,
that is of the object’s shape (primitive model) and of
the fixed point cloud inside the 3D ROI. The
rotation matrix R is determined by evaluating the 3D
distribution of the disparity point cloud information,
that is, 3D slope from which the point data is
aligned.
By using the proposed alignment method, a
rough object volumetric estimation is obtained based
on the fitting primitive principle. An example result
of the similarity transformation can be seen in figure
5, where, the green silhouette represents the PDM
primitive shape.
Figure 5: Primitive PDM shape alignment example.
3.5 PDM Primitive Modeling
The points which drive the modeling process are the
control points described in a previous subsection.
The behaviorof the other points in the PDM model is
automatically derived from the movement of the
control points. The modeling process is achieved by
dragging after each control point the neighbors from
the surrounding area. Each of the neighbor point is
moved based on a physical relation describing the
property of the considered object. This relation can
be either linear, as in equation 4, or non-linear for
more complex surfaces. For simplicity if
explanations, we have considered in this work a
linear relation between control and the rest of the
PDM points:
,1
max
⎟
⎟
⎠
⎞
⎜
⎜
⎝
⎛
+=
d
d
XX
curr
oldnew
(4)
where,
new
X and
old
X represent the new and old 3D
coordinates of the considered neighboring points,
respectively,
max
d is the distance between the
control point and the farthest neighbor within the
affected area and
curr
d
represent the distance
between the control point and the translated
neighbor. The results of such a linear modeling are
shown in figure 6, where control points are marked
with red, their neighbors are labeled with blue the
rest of the PDM points are green.The surrounding
dragged area has the shape of a cube centered on the
control point 3D coordinate and has its area defined
as double the distance between the initial and the
new position of the control point, as depicted in
figure 5.
(a) (b)
Figure 6: A linear dependency between a control point and
its neighbors. (a) Initial PDM shape model.(b) Point
deformation along a considered direction.
The proposed approach for estimating an object’s
volume starts with a generic object PDM model,
namely a primitive, and ends by capturing by each
primitive control point the local features of the
modeled object of interest. As explained, this is
achieved by minimizing the distance between the
control point and the PDM in a respective
neighborhood. The minimization procedure is based
on the active contours principle, better known as
snakes (Kass et al., 1988). This approach represents a
deformable contour model of the considered object.
In an image, an active contour is a curve
parameterized by the minimization of and energy
functional:
,))](())(([)()()(
1
0
intint
∫
+=ε+ε=ε dsscEscEccc
extext
(5)
where,
int
E and
ext
E are the internal and external
energies, respectively and () = [(), (), ()]
represents the curve describing the object’s surface.
while
]1,0[∈s
. By defining an initial contour within
an image, it will move under the influence of
OBJECT VOLUMETRIC ESTIMATION BASED ON GENERIC FITTED PRIMITIVES FOR SERVICE ROBOTICS
195

internal forces computed based on the derivatives
from the active contour an also under the influence
of the external forces captured from the image.
In the presented 3D object modeling approach,
the disparity image domain is equivalent to the 3D
representation of the scene. For this reason the same
energy minimization principle has been used to
model the shape of an object. Instead of using an
initial active contour, as in the original method, we
propose the use of a 3D generic primitive PDM
model. The movement of the contour surface is thus
described by the direction of the lowest functional
energy, that specific region actually corresponding
to aprobable contour in the image (Mark et al.,
2002). In the considered 3D case being the highest
density of points from the 3D scene.
The idea of using forces to move the primitive
points is that the primitive PDM must be attracted
and fitted on the border of the object. The internal
forces, which refer exclusively to the primitive
PDM, are responsible for supervising the shape
smoothness and continuity. As described in the
equation 6, the continuity property is controlled by
the first derivate while smoothens is define by the
second derivate of the surface.
),)()()()((
2
1
2
"
2
'
int
svssvsEEE
curvcont
β+α=+=
(6)
where,
cont
E
is the energy responsible for the
continuity of the surface and
curve
E
deals with the
bending property of the hull of the object.
α
and
β
are two parameters which influence the
cont
E
and
curve
E forces, while
)](),(),([)( szsysxsv =
represent
the coordinates of a point from the shape vector X.
In the discreet domain the two energies can be
rewritten as:
2
1
2
1
2
1
)()()(
−−−
−+−+−=
iiiiiicont
zzyyxxE
(7)
,)2(
)2()2(
2
11
2
11
2
11
+−
+−+−
+−+
+−++−=
iii
iiiiiicurv
zzz
yyyxxxE
(8)
where,
i
x ,
i
y ,
i
z
X∈
,
p
ni ...1=
and
p
n
is the
number of points in the shape PDM vector. In the
original formulation of the principle, each point
from the shape can be moved in one of the eight
possible 2D directions. In current3D approach,
because of the third dimension, a number of 24
directions are taken into account.
The correct moving direction is mainly
influenced by the external energy
ext
E which
evaluates for each direction the highest density of
3D points. Because this density can be spatially very
close, a weight factor for the external energy is
introduced. Thus, if these candidate positions have
an appropriate number of points, the weight factor
will be considered zero.
Since we have only one perspective of the
object, there are large object areas with no 3D point
cloud description needed to drive the contour
energies. The un-imaged back side of an object
represents such an example. In the proposed
approach, the missing information is filled by the
generic data introduced by the PDM primitive
model.
4 EXPERIMENTAL RESULTS
For evaluation purposes, a Point Grey Bumblebee
®
stereo camera system mounted on an autonomous
platform equipped with a robotic manipulator was
used. The objects used during tests were placed at
random location on flat surfaces present. The exact
location of an object is unknown. We tested the
algorithm on two different types of objects, namely
bottles and potatoes having different irregular
shapes. The bottles object class represents a large
number of geometrical regular shapes frequently
encountered in domestic settings. The potato is used
to test the algorithm against complex irregular
surfaces.
The Ground Truth (GT) data against which the
proposed method has been tested is composed of a
number of manual measurements conducted on the
objects: width, height, thickness, translation and
rotation. The translation and rotation was measure
with respect to a fixed reference coordinate system
represented by an ARToolKit
®
marker.
Table 1: Performance evaluation results for the proposed volumetric modelling system.
Shape Width[m] Height[m] Thickness[m] Φ[deg]
θ[deg] ϕ[deg]
[m] [m] [m]
Bottle
GT 0.085 0.35 0.08 0 1.3 5.7 0.1 0.05 0.850
Online 0.086 0.3491 0.0749 1.121 2.12 5.27 0.088 0.061 0.869
Potato
GT 0.087 0.059 0.06 0 2.5 1.5 0.1 0.05 0.850
Online 0.0855 0.0637 0.0651 2.08 1.67 -0.38 0.09 -0.055 0.873
VISAPP 2012 - International Conference on Computer Vision Theory and Applications
196

Because of its regular shape, the volumetric
estimation of bottles had the lowest modeling error,
as can be seen from Table. 1. The modeled primitive
captured efficiently the particularity of the surfaces,
thus resulting in a precise surface estimation. On the
other hand, due to their irregular shape, a higher
estimation error has been determined for the
considered potatoes. An example of obtained test
results can be seen in Table 1, were
Φ, θ and ϕ are
Euler angles and x, y, and z are positions along the
three Cartesian axes, respectively.
5 CONCLUSIONS
In this paper, an object volumetric modeling
algorithm for objects of interest encountered in real
world service robotics environments has been
proposed. The goal of the approach is to determine
as precisely as possible the 3D particular surface
structure of different objects. The calculated 3D
model can be further used for the purpose of visually
guided object grasping. As future work the authors
consider the time computation enhancement of the
proposed procedure through parallel computational
devices (e.g. Graphic Processors), as well as the
application of the method to other computer vision
areas, such as 3D medical imaging.
ACKNOWLEDGEMENTS
This paper is supported by the Sectoral Operational
Program Human Resources Development (SOP
HRD), financed from the European Social Fund and
by the Romanian Government under the projects
POSDRU/107/1.5/S/ 76945 and POSDRU/
89/1.5/S/59323.
REFERENCES
Brown, M., Burschka, D., Hager, G. 2003. Advances in
Computational Stereo, IEEE Transaction on Pattern
Recognition and Machine Intelligence, 25(8):993–
1008.
Cootes, T., Taylor, C., Cooper, D., Graham, J. 1995.
Active Shape Models-Their Training and Application,
Comp. Vision and Image Understanding, 61(1):38-59.
Criminisi, A., Reid, I., Zisserman, A. 2000. Single View
Metrology, International Journal on Computer Vision,
40(2):123–148,
Grigorescu, S., Cocias, T., Macesanu, G., Puiu, D.,
Moldoveanu, F. 2011, Robust Camera Pose and Scene
Structure Analysis for Service Robotics, Robotics and
Autonomous Systems, 59(11):899-909.
Hartley,R., Zisserman, A. 2004. Multiple View
Geometryin Computer Vision, Cambridge University
Press.
Horry, Y.,Anjyo, K., Arai, K. 1997. Tour into the Picture:
Using a Spidery Mesh Interface to Make Animation
from a Single Image, Proc. ACM SIGGRAPH.
Kass, M., Witkin, A., Terzopoulos, D. 1998. Snakes:
Active Contour Models, International Journal of
Computer Vision, 1(4):321-331.
Kim, T., Seo, Y., Lee, S., Yang, Z., Chang, M. 2009
Simultaneous Registration of Multiple Views with
Markers,Computer-Aided Design, 41(4):231–239.
Kutulakos, K., Seitz, S. 2000. A Theory of Shape by
Space Carving, International Journal of Computer
Vision, 38(3):199–218.
Lhuillier, M., Quan, L. 2005. A Quasi-Dense Approach to
Surface Reconstruction from Uncalibrated Images,
IEEE TPAMI, 27(3):418–433.
Matsuyama, T., Wu, X., Takai, T., Wada, T. 2004. Real-
Time Dynamic 3-D Object Shape Reconstruction and
High-Fidelity Texture Mapping for 3-D Video, In
IEEE Transactions on Circuits and Systems for Video
Technology, 14(3), 357–369.
Stamos, I., Liu, L., Chao, C., Wolberg, G., Yu, G., Zokai,
S. 2008. Integrating Automated Range Registration
with Multi-view Geometry for the Photorealistic
Modeling of Large-Scale Scenes. International
Journal of Computer Vision, Springer, 78(2/3):237–
260.
Sturm, P., Maybank, S. 1999. A Method for Interactive 3D
Reconstruction of Piecewise Planar Objects from
Single Images, In BMVC.
Trucco, E., Verri, A. 1998.Introductory Techniques for 3-
D Computer Vision, Prentice Hall PTR.
Turiac, M., Ivanovici, M., Radulescu, T. 2010.Variance-
driven Active Contours, International Conference on
Image Processing, Computer Vision, and Pattern
Recognition.
Zheng, Y., Barbu, A., Georgescu, B., Scheuering, M., and
Comaniciu, D. 2008. Four-Chamber Heart Modeling
and Automatic Segmentation for 3D Cardiac CT
Volumes Using Marginal Space Learning and
Steerable Features,IEEE Transaction on Medical
Imaging, 27(11):1668–1681.
OBJECT VOLUMETRIC ESTIMATION BASED ON GENERIC FITTED PRIMITIVES FOR SERVICE ROBOTICS
197
