
3D TEXTURE SYNTHESIS FOR MODELING REALISTIC ORGANIC
TISSUES
Juan-Carlos Prieto
1
, Chantal Revol-Muller
1
, Franc¸oise Peyrin
1,2
, Patrizia Camelliti
3
and Christophe Odet
1
1
CREATIS, CNRS UMR 5220, Inserm U1044, Univ. de Lyon1, INSA-Lyon, 7 Avenue Jean Capelle 69621, Lyon, France
2
ESRF, BP 220, 38043 Grenoble, France
3
NHLI, Imperial College London, London, U.K.
Keywords:
3D Texture Synthesis, Image-based Modeling, Organ Modeling, Histology, Patient-specific, Im-
age/Mechanical Simulation, Virtual Human.
Abstract:
Virtual anatomy models show in detail characteristics of the human body systems. These models are based in
surface representation of the structures and lack information from the interior of the object. Creating models
that represent the surface, the interior of the object and are able to provide pathological information is the
current challenge of research in life sciences. We present a method to synthesize realistic three-dimensional
organic tissues starting from bidimensional textured multi-channel samples. The method relies on an energy
function that measures the difference between the reference texture and the synthesized object, through a
distance metric that compares perpendicular neighborhoods in the object to neighborhoods in the sample.
When this function is minimized by IRLS, the result is a solid object that resembles the sample at every slice.
In some cases, the optimization might be aided by adding the feature distance transform, calculated from a
given binary mask. This allows to code large textured areas. Multiple textures can also be provided to the
optimization in order to create anistropic textures. We apply our method starting from various micrometric
images such as histology images or slices of Synchrotron Radiation Computed Micro-Tomography (SRµCT)
images. A major advantage of our method is to extend 2D histological information to a 3D representation.
We demonstrate the accuracy of the generated texture by comparing statistical and morphological parameters
computed from the synthetic object with those obtained from the real object underlying the reference images.
1 INTRODUCTION
Realistic modeling of the human body is the current
challenge in research of life sciences, projects around
the world such as VPH-NOE (Virtual Physiological
Human - Network of Excellence)
1
aim to create com-
puter models for personalized and predictive health-
care. The main goal is to create models capable of
integrating not only anatomical information but also
physiological, mechanical and the biochemical pro-
cesses related to the organ.
There are human anatomy models such as the
Google Body Browser
2
or the Visible Body
3
, they
offer a detailed 3D view of the human body systems
(digestive, nervous, skeletal etc.), and are based in su-
1
http://www.vph-noe.eu/
2
http://bodybrowser.googlelabs.com/body.html
3
http://www.visiblebody.com/
rface representations of the structures. These mod-
els are organized in a multi-scale fashion, giving the
possibility to navigate through the body system, they
are mainly used as a learning tool, as they are not con-
ceived to be used for patient-specific analysis or plan-
ning purposes. These models have another limitation
such as the lack of information at different scales e.g.
the structure of the bone tissue is not available.
Modeling different types of organs and tissues at
the cellular level represents an interest for histology
i.e. the study of tissues. Histology plays an important
role in the comprehension of morphological relation-
ships between the organs and tissues, as it considers
the structural organization or precise hierarchy of the
organs with the smallest details. This represents an
advantage as tissues are formed by cells, we could
have structural information at different scales.
In this paper, we propose a method generic enough
that is able to reproduce complex 3D objects, by us-
60
Prieto J., Revol-Muller C., Peyrin F., Camelliti P. and Odet C..
3D TEXTURE SYNTHESIS FOR MODELING REALISTIC ORGANIC TISSUES.
DOI: 10.5220/0003863800600065
In Proceedings of the International Conference on Computer Vision Theory and Applications (VISAPP-2012), pages 60-65
ISBN: 978-989-8565-04-4
Copyright
c
2012 SCITEPRESS (Science and Technology Publications, Lda.)
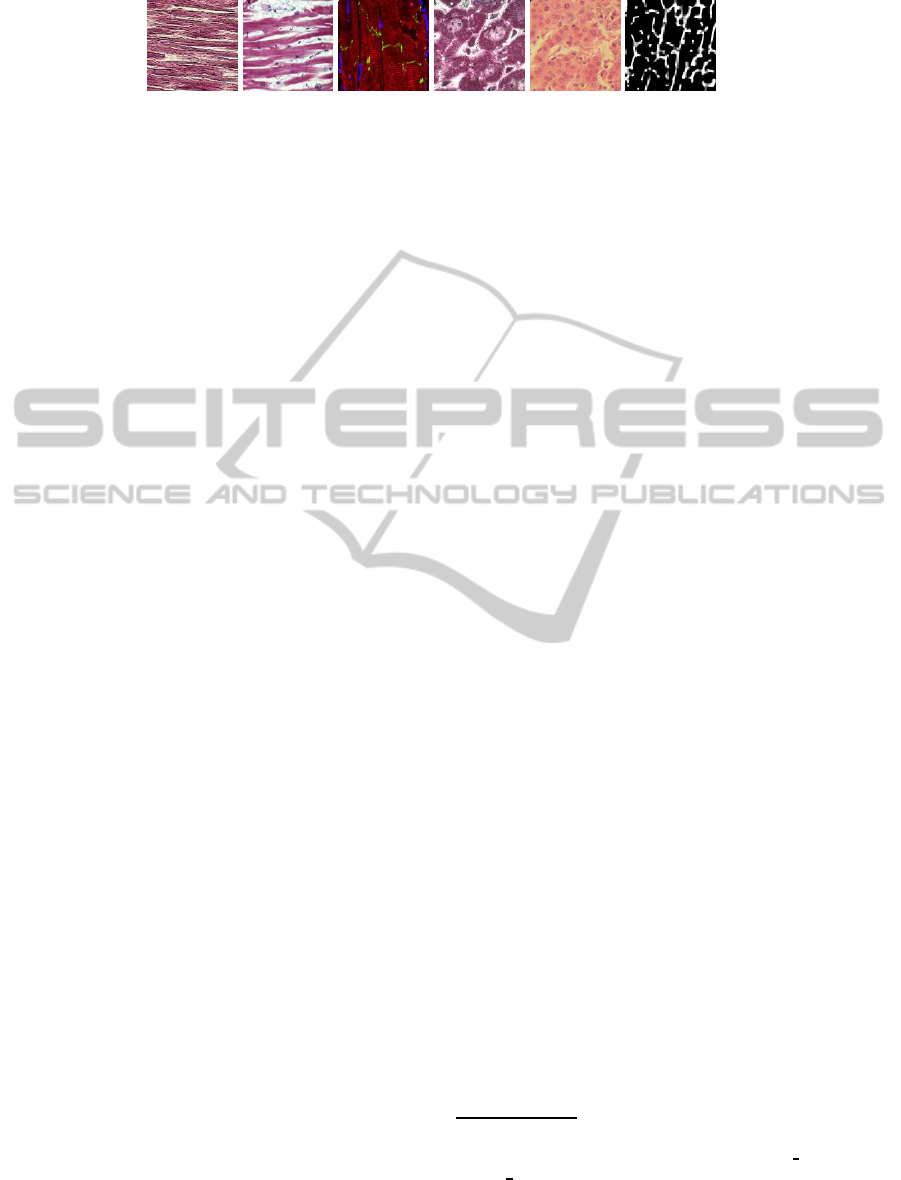
(a) (b) (c) (d) (e) (f)
Figure 1: 128
2
textured samples available to create volumetric data: (a) skeletal muscle sample artistically created; histology
images of (b) striated cardiac muscle, (c) myocytes, (d-e) hepatocytes; (f) a slice from a SRµCT image of a trabecular bone
sample.
ing 2D textured samples. Our method derives from
Kopf’s approach (Kopf et al., 2007), it starts with a
2D reference image and by means of an energy opti-
mization process described by Kwatra (Kwatra et al.,
2005), it is able to create a 3D texture that resembles
the 2D image in every slice. The reference 2D images
can illustrate any textured element and can be of dif-
ferent kinds: i) artificial images artistically created for
computer graphic design or medical atlases or ii) real
images with very complex texture provided by digital
microscopy of biomedical histological slices. Figure
1 show samples of textured images, available to pro-
duce different types of volumetric data.
The texture synthesis optimization has the advan-
tage to be able to constraint separately the axial, lon-
gitudinal and transversal planes of the 3D texture by
taking into account one or multiple reference textures.
Moreover, extra channels can be added to the exem-
plar, like distance maps when large texture features
must be coded (Lefebvre and Hoppe, 2006).
The method also maintains the global statistics of
the sample by using a histogram matching approach
presented by (Rolland et al., 2000) and (Heeger and
Bergen, 1995).
In the remainder of this paper, we present in detail
our method to synthesize realistic 3D textures mod-
eling organic tissues and provide an overview of the
different types of texture that can be generated. As
we shall show in the section 4, the accuracy of the 3D
synthetic texture is demonstrated by comparing sta-
tistical and morphological parameters computed from
both the synthetic texture and the reference object.
2 METHOD
2.1 3D Texture Synthesis
3D texture synthesis has been used before to create re-
alistic solid objects, giving the possibility to perform
scattering simulations or cut through them. Our ap-
proach is based on an energy proposed by (Kwatra
et al., 2005) and defined by the following equation:
E(o, {e}) =
∑
t
∑
i∈{x,y,z}
||o
t,i
− e
t,i
||
r
(1)
It is based on a distance metric that compares the
neighborhoods x, y, z of a texel t in the object o
and neighborhoods from the sample texture e. When
minimized, using IRLS (iterative re-weighted least
squares), the result is an increase of similarity be-
tween the sample and the synthetic object.
The procedure begins at a coarse resolution as-
signing random values from the sample to the syn-
thetic object. Then, it alternates between a search
phase where the closest neighborhoods are found and
an optimization phase where the weighted average of
every texel is calculated. When the optimization con-
verges, it changes to a finer resolution level using lin-
ear interpolation.
2.1.1 Search Phase
The sample image is divided into 9∗9 neighborhoods
that overlap each other, these neighborhoods are vec-
torized i.e. every texel from the neighborhood is
stacked into a single vector. For RGB texels we have
9∗ 9∗ 3 = 243 values in a single vector. It is possible
to use a distance map as an extra channel by giving
the algorithm a binary image as input, this is useful
when the texture has large unstructured areas. Once
the vectors from the sample are constructed, we apply
PCA (principal component analysis)
4
to reduce the
dimensionality of each vector passing from 243 to 18
values approximately.
Reducing the vectors is a very convenient step,
there are less values but we are still keeping 95% of
the relevant information. The reduced vectors can
be used to perform a standard closest neighborhood
search in a high dimensional space. For this purpose,
we use ANN library
5
.
4
L. Smith 2002, A Tutorial on Principal Components
Analysis; www.cs.otago.ac.nz/cosc453/student
tutorials/pr
incipal
components.pdf
5
ANN: A library for approximate nearest neighbor
searching; http://www.cs.umd.edu/∼mount/ANN/ Mount,
D. M. and Arya, S. 2006.
3D TEXTURE SYNTHESIS FOR MODELING REALISTIC ORGANIC TISSUES
61
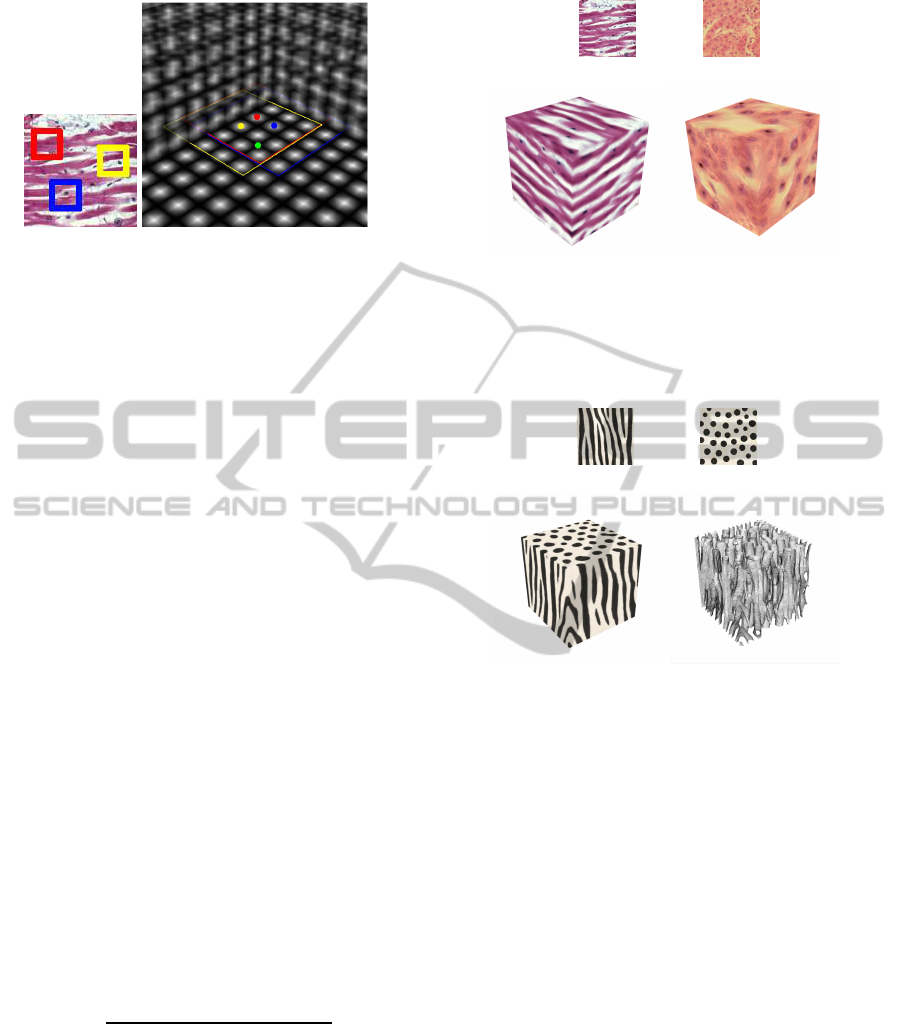
Figure 2: 9x9 red, blue and yellow neighborhoods for a slice
in the volume, the center is represented by the colored dot.
The green voxel is affected by multiple neighborhoods.
E(o, {e}) =
∑
t
∑
i∈{x,y,z}
∑
u∈N
i
(t)
w
t,i,u
(o
t,i,u
− e
t,i,u
)
2
(2)
w
t,i
= ||o
t,i
− e
t,i
||
r−2
(3)
During the search phase a weight for each neigh-
borhood is calculated, for this purpose the energy
function is written as equation 2 and the weight is cal-
culated as shown in equation 3. N
i
(t) represents the
neighborhoods found in each dimension x, y, z and
u is the texel in the neighborhood of t, this means
that a texel in the object is affected by multiple tex-
els from different neighborhoods in the exemplar tex-
ture. The search is performed for every two texels
g
x
= {(i, 2∗ j, 2∗ k), ∀i, j, k}, g
x
is the voxel in a slice
perpendicular to x. This is done similarly for y and
z, as shown in figure 2. We set r = 0.8 to perform a
robust optimization (Kwatra et al., 2005).
Once the search phase is done the optimization
phase takes place and it consists in averaging all the
values found for each texel of the volume.
2.1.2 Optimization Phase
The optimization phase consists in averaging the val-
ues that affect one texel in the object. Note that if the
search phase is performed for every two texels as in
2.1.1, then the average will be for at most 75 texels
(25 for each dimension).
o
t
=
∑
i∈{x,y,z}
∑
u∈N
i
(t)
w
u,i,t
∗ e
u,i,t
∑
i∈{x,y,z}
∑
u∈N
i
(t)
w
u,i,t
(4)
Equation 4 shows the value of a texel in the ob-
ject. When the texels present a high variability, the re-
sulting object might be blurred, in order to avoid this,
clustering is performed to only average those texels
that correspond to the principal cluster.
Following the optimization phase, the histogram
matching is done to preserve the global statistics of
the object relative to the exemplar.
(a) Exemplar textures.
(b) Generated volumes.
Figure 3: Results of isotropic synthesis. The striated car-
diac muscle tissue (left) and liver cell tissue (right) were
generated using a single reference texture for the axial, lon-
gitudinal and transversal planes.
(a) Exemplar textures.
(b) Generated volume. (c) Surface rendering.
Figure 4: Results of anisotropic synthesis. The optimization
was performed using the zebra texture to constraint the lon-
gitudinal and transversal planes. The dot texture was used
in the axial plane.
2.1.3 Histogram Matching
To perform histogram matching, the CDF (cumula-
tive distribution function) is calculated for both the
exemplar and the object. Two LUTs are constructed
in order to perform faster calculations. The lookup
table LUT
o
maps the RGB values of the object to
their corresponding value in the CDF
o
, the lookup ta-
ble LUT
e
maps the CDF
e
to the corresponding RGB
values from the sample. The object is then modified
by taking each of the texels t, using LUT
o
(t) to find
the CDF
o
(t) and then using LUT
e
(CDF
o
(t)) to find
the corresponding RGB value from the sample. The
value of the object is then replaced by the correspond-
ing value of the sample.
VISAPP 2012 - International Conference on Computer Vision Theory and Applications
62

3 RESULTS
The algorithm was implemented in C++ using ITK
6
for image processing and VTK
7
for visualization.
Using ITK allowed the image processing to be per-
formed in parallel, thus gaining computational time.
Synthetic 3D images of both 128
3
pixels and 256
3
pixels were generated using different type of textures,
from histology images acquired with a digital micro-
scope.
3.1 Isotropic Texture from a 2D
Exemplar Texture
Figure 3 shows some results when the same exemplar
is used to perform the optimization in the perpendic-
ular planes of each three axis. Our method allows the
3D synthesis of the striated cardiac muscle tissue and
the liver cell tissue from only one histology slice. It
can be noted that any axial, longitudinal or transversal
slice of the volume is similar to the reference texture
without being, however, identical.
3.2 Anisotropic Texture from Many 2D
Exemplar Textures
Figure 4 shows the result of selecting two differ-
ent textures to constraint the optimization. Selecting
the zebra texture for the longitidunal and transversal
planes with the dot pattern for the axial plane gener-
ated cylinder like structures. When rendering the sur-
face of the object, we can see that the generated struc-
ture is very complex and consists of tubes that join
and separate at arbitrary slices. This synthetic struc-
ture was used in our lab to test Brownian simulation
algorithms that reveal the environment’s structures.
3.3 Anisotropic Texture Constrained by
Additional Masks
Figure 5 shows the synthesis results using different
exemplar textures obtained from confocal images
8
and extra channels provided by signed Euclidean dis-
tance maps computed from binary masks. The 3D
texture representing a myocyte cell tissue are quite
representative of cells organisation (myocytes in red
and fibroblasts in blue).The anisotropy of the cells is
conspicuous and the contrast of staining is well pre-
served thanks to the use of the binary masks.
6
http://www.itk.org
7
http://www.vtk.org
8
http://www1.ic.ac.uk/medicine/people/p.camelliti/
(a) Exemplar textures + binary masks.
(b) Longitudinal view
of the volume.
(c) Axial view of the
volume.
Figure 5: Results of anisotropic synthesis starting from two
different textures and their additional binary masks.
One main advantage of our method is to generate
a 3D tissue from 2D information. Up to now, it was
impossible for the biologist or the physician to have a
3D representation of the cell tissue, since it is techni-
cally very difficult or even impossible to have an axial
resolution as good as those in the slice. Thanks to our
approach, the experts can get a virtual 3D represen-
tation of the tissues that are close to reality without
being it.
4 EVALUATION AND
DISCUSSION
We propose to assess the quality of our synthetic 3D
texture according to two criteria: statistical and mor-
phological accuracy. As the ultimate goal of our work
is to produce a 3D texture as close as possible to the
reference object, we will compare statistical and mor-
phological features computed from the reference ob-
ject with to those computed from the synthetic tex-
ture.
4.1 Statistical Assessment
Figure 6 shows the histograms from the exemplar tex-
ture and the synthesized object shown in figure 3. The
total number of pixels in the texture are 128
2
= 16384
and 128
3
= 2097152 for the volume. Note that when
a randomly chosen slice is taken from the volume, the
global statistics are still preserved. Table 1 contains
the means and the standard deviations calculated from
the histograms, the values from the object are similar
to those of the exemplar with a variation lower than
1% for the means and lower than 2% for the standard
deviations.
3D TEXTURE SYNTHESIS FOR MODELING REALISTIC ORGANIC TISSUES
63
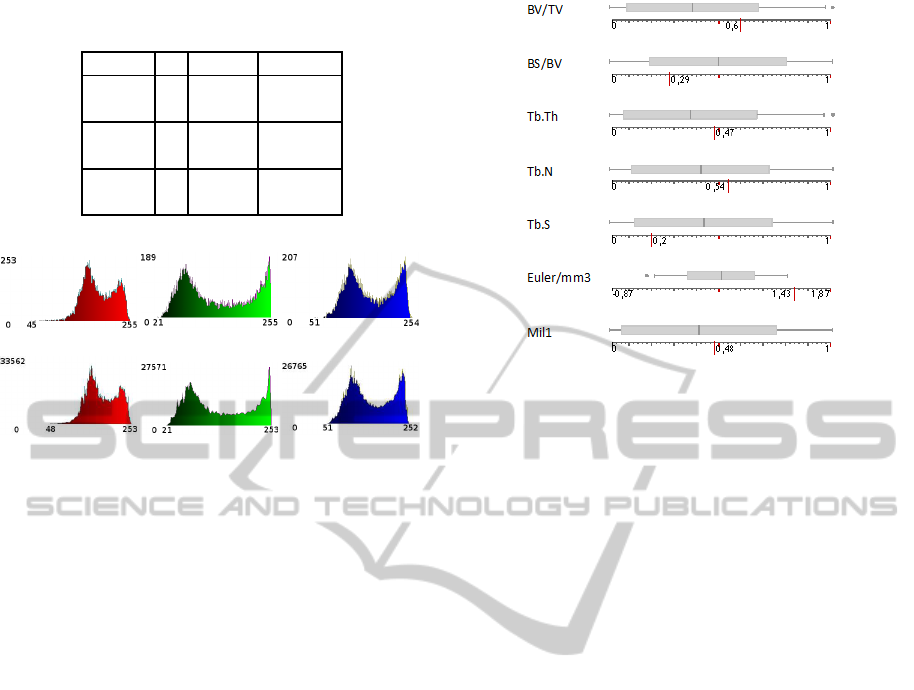
Table 1: Means and standard deviations for the RGB chan-
nels of the exemplar and the object.
Mean St. Dev
Red
e 189.6 34.7
o 188.7 34.0
Green
e 142.4 70.2
o 141.4 69.3
Blue
e 168.8 48.7
o 168.0 48.1
(a) Exemplar.
(b) Object.
Figure 6: RGB histograms of the exemplar and the object
for the striated cardiac muscle shown in figure 3.
4.2 Morphological Assessment
We propose to quantitatively assess the accuracy of
the morphological structure given by our synthetic
3D texture. For this study, we generate a 3D tex-
ture from images provided by Synchrotron Radia-
tion Computed Micro-Tomography (SRµCT). These
images were acquired few years ago on beam-line
ID19 at the European Synchrotron Radiation Facility
(ESRF) in Grenoble for the needs of a study focused
on osteoporosis. Osteoporosis is a bone fragility dis-
ease leading to spontaneous bone fractures and char-
acterized by a bone mass reduction and a bone struc-
ture deterioration. 3D Synchrotron Radiation Com-
puted Micro-Tomography(SRµCT) provided 3D high
resolution images with an isotropic voxel of 10 µm
width and a volume size of 330 ∗ 330 ∗ 330 pixels
helpful to assess trabecular bone architecture (Revol-
Muller et al., 2002). Therefore, we have at our dis-
posal a set of twelve 3D SRµCT images obtained from
twelve calcaneus bone samples excavated from de-
ceased human. For the test of our method, we worked
on decimated SRµCT images with a resolution of
80µm and a size of 83 ∗ 83 ∗ 83 voxels. At this res-
olution, the signal to noise ratio is still high enough to
extract trabecular bone from the background by sim-
ple automated thresholding. This binarizing step is
needed for the computation of the bone parameters.
We computed morphologic and topological archi-
tecture parameters similar to those used in histomor-
phometry but computed on three-dimensional images
Figure 7: Box plots for morphologic and topological archi-
tecture of bones.
from the set of the twelve volumes. A 3D MIL
(Mean Intercept Length) method based on a three-
dimensional version of the directed secant algorithm
was chosen to produce many parameters related to
the trabecular bone morphology (Hipp and Simmons,
1997) and the Euler number was computed to esti-
mate the bone topology. We considered the seven fol-
lowing parameters: Partial Bone Volume (BV/TV),
Bone Surface to Bone Volume ratio (BS/BV), Trabec-
ular Thickness (Tb. Th), Trabecular Number (Tb. N),
Trabecular Separation (Tb. Sp) and Mean Intercept
Length (MIL1). The connectivity was estimated by
the Euler number (Euler/mm3) implemented follow-
ing the method described in (Odgaard and Gundersen,
1993) and normalized by the total volume. The higher
the Euler number’s value, the less connected the bone
structure is.
We generated by our method a 3D SRµCT-like
texture (128∗ 128∗ 128 voxels) from two random ref-
erence slices (83∗ 83 pixels) taken into one out of the
twelve SRµCT volumes. We binarized the texture in
order to extract the virtual bone architecture by the
same automated thresholding than that used for the
set of SRµCT volumes. Then we assess the accuracy
of the virtual bone structure by comparing the bone
parameters computed from the set of SRµCT images
with those computed from the synthetic 3D volume.
Figure 7 displays the box plots associated to each
bone parameter obtained from the set of SRµCT im-
ages. As our aim is not focused on the analysis or
the interpretation of these parameters but only on the
comparison of them, we normalized each parameter
by the range between their maximum and minimum
values. The score of the synthetic texture is displayed
on the scale line under each box plot by a long red
VISAPP 2012 - International Conference on Computer Vision Theory and Applications
64
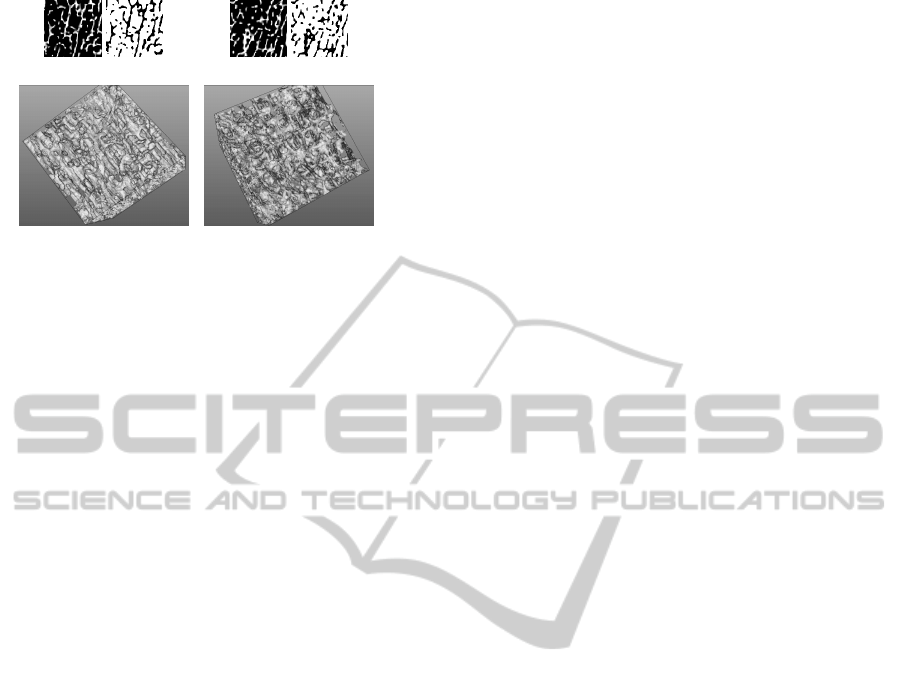
(a) Exemplars + binary masks.
(b) Generated volume. (c) Real volume.
Figure 8: Anisotropic synthesis with additional binary
masks. Surface rendering of trabecular bone architecture
obtained with the synthetic texture and the SRµCT image.
line. It can be noticed that for all the morphologic pa-
rameters the score for the virtual bone is spread in a
range lower than +/- one standard deviation from the
mean value obtained from the SRµCT set, thus prov-
ing its resemblance with the architecture of real bone.
For the topology parameter (Euler/mm3), the score is
slightly higher than the maximum value obtained with
the SRµCT set, but that remains satisfying. It means
that the virtual bone structure has a somewhat lower
connectivity than the reference set. It could represent
a high degree of osteoporosis.
In Figure 8, the surface of the virtual bone is com-
pared to the surface of the 3D SRµCT image from
which were taken the reference slices for the texture
synthesis. We retrieve visually the similarity demon-
strated by the bone parameters.
5 CONCLUSIONS
Our method allows to create realistic organic tis-
sue from small samples acquired by a digital micro-
scope or other image acquisition devices such as Syn-
chrotron Radiation Computed Micro-Tomography.
We demonstrated quantitatively the accuracy of the
synthetic texture from both statistical and morpho-
logical points of view. Latter tests showed that our
synthetic objects like the zebra-dot 3D texture can be
useful for simulation especially in the framework of
Brownian simulation. In future work, we will use our
method to enhance surface models. We will aim at
coupling texture synthesis with minimal skeleton rep-
resentations such as the m-reps developed by Pizer et.
al (Pizer et al., 2003) and reproducing the interior of
the organs at multi-scale levels using 2D samples of
tissue.
REFERENCES
Heeger, D. J. and Bergen, J. R. (1995). Pyramid-based tex-
ture analysis/synthesis. In Proceedings of the 22nd
annual conference on Computer graphics and inter-
active techniques, SIGGRAPH ’95, pages 229–238,
New York, NY, USA. ACM.
Hipp, J. and Simmons, C. (1997). Method-based dif-
ferences in the automated analysis of the three-
dimensional morphology of trabecular bone. Journal
of Bone and Mineral Research, 12.
Kopf, J., Fu, C.-W., Cohen-Or, D., Deussen, O., Lischinski,
D., and Wong, T.-T. (2007). Solid texture synthesis
from 2d exemplars. ACM Transactions on Graphics
(Proceedings of SIGGRAPH 2007), 26(3):2:1–2:9.
Kwatra, V., Essa, I., Bobick, A., and Kwatra, N. (2005).
Texture optimization for example-based synthesis.
ACM Transactions on Graphics, SIGGRAPH 2005.
Lefebvre, S. and Hoppe, H. (2006). Appearance-space tex-
ture synthesis. ACM Trans. Graph., 25:541–548.
Odgaard, A. and Gundersen, H. (1993). Quantification of
connectivity in cancellous bone, with special empha-
sis on 3d reconstructions. Bone, 14:173–182.
Pizer, S. M., Fletcher, P. T., Joshi, S., Thall, A., Chen,
J. Z., Fridman, Y., Fritsch, D. S., Gash, A. G., Glotzer,
J. M., Jiroutek, M. R., Lu, C., Muller, K. E., Tracton,
G., Yushkevich, P., and Chaney, E. L. (2003). De-
formable m-reps for 3d medical image segmentation.
Int. J. Comput. Vision, 55:85–106.
Revol-Muller, C., Benoit-Cattin, H., Carillon, Y., Odet, C.,
Briguet, A., and Peyrin, F. (2002). Bone mri seg-
mentation assessment based on synchrotron radiation
computed microtomography. IEEE Trans Nucl Sci,
49(1):220–224.
Rolland, J. P., Vo, V., Bloss, B., and Abbey, C. K. (2000).
Fast algorithms for histogram matching: application
to texture synthesis. Journal of Electronic Imaging,
9:39–45.
3D TEXTURE SYNTHESIS FOR MODELING REALISTIC ORGANIC TISSUES
65
