
GRAPH BASED DESCRIPTOR EVALUATION TOWARDS
AUTOMATIC FEATURE SELECTION
Anita Keszler, Levente Kov´acs and Tam´as Szir´anyi
Distributed Events Analysis Research Group,
Computer and Automation Research Institute of the Hungarian Academy of Sciences (MTA SZTAKI), Budapest, Hungary
Keywords:
Graph Representation, Components, Feature Selection.
Abstract:
This paper presents the first steps towards an automated image and video feature descriptor evaluation frame-
work, based on several points of view. First, evaluation of distance distributions of images and videos for
several descriptors are performed, then a graph-based representation of database contents and evaluation of
the appearance of the giant component is performed. The goal is to lay the foundations for an evaluation frame-
work where different descriptors and their combinations can be analyzed, with the goal of later application for
automatic feature selection.
1 INTRODUCTION
Recent multimedia databases require large amounts
of memory and computing power for storage and pro-
cessing, and there is a need to efficiently index, store,
and retrieve the embedded information.
Usual methods in dimensionality reduction in-
volve various areas including Principal Component
Analysis, clustering methods, neighbour searching al-
gorithms, and so on. One of the recent approaches in-
volvesgraph based clustering and componentanalysis
methods. The generic questions and open issues here
remain how to build the graphs (regarding selection of
edges and weights), and how to navigate the graphs
efficiently (i.e. neighbourhood searching). Numer-
ous graph based methods have been published in the
area of image/video clustering and retrieval. How-
ever, there are still several open questions in image
processing and graph theory as well. Among several
other problems, one of the most important step is to
select the proper descriptors.
Feature selection algorithms typically can be cat-
egorized into feature ranking (based on a metric) and
subset selection (optimal set of features) methods.
The most common selection techniques are some sort
of subset selection (e.g. wrappers). In this case the
high dimensionality can be considered. In (Chapelle
et al., 2002) a SVM based feature selection method is
applied where the scaling factors are adjusted using
the gradient of a theoretical upper bound on the error
rate.
We propose and work towards practically proving
that graph theoretic approaches can be useful in de-
scriptor selection as well. As others have also begun
to investigate, we build our approach on the investi-
gation of image/video distance distributions accord-
ing to several descriptors and analysing their relation
and behaviour w.r.t. component formulation and giant
component appearances.
In (Zhang et al., 2010) a query by example ap-
proach where histograms of point distances are in-
vestigated for 2 vs 100 feature dimensions for low
number of vertices (250), as a basis to show that
with increased dimensions the distance distribution of
points tend to be narrower (distances decrease, show-
ing poorer discrimination). An approach for feature
selection in the presence of irrelevant features (noise)
is introduced in (Sun et al., 2010), taking into con-
sideration of sample datapoints in 2D space for de-
cision boundary selection and investigating the dis-
tribution of feature weights in high dimensions. An-
other method (Morris and Kender, 2009) is based on
an approx. 1000 features on real videos, using a
heuristic algorithm for feature retention, and using
the sort-merge approach for selecting ranked feature
groups. A method for sports video feature selection
is presented in (Shen et al., 2007) using Mean Shift
clustering based on motion signatures and colour fea-
tures. Setia et al. (Setia and Burkhardt, 2006) present
a method for automatic image annotation by a fea-
ture weighting scheme and SVM using a combina-
tion of colour, texture and edge features.Guldogan et
al. (Guldogan and Gabbouj, 2008) present an auto-
matic feature selection approach for finding features
375
Keszler A., Kovács L. and Szirányi T..
GRAPH BASED DESCRIPTOR EVALUATION TOWARDS AUTOMATIC FEATURE SELECTION.
DOI: 10.5220/0003868503750380
In Proceedings of the International Conference on Computer Vision Theory and Applications (VISAPP-2012), pages 375-380
ISBN: 978-989-8565-03-7
Copyright
c
2012 SCITEPRESS (Science and Technology Publications, Lda.)

that best describe a specific dataset investigating mu-
tual information and principal component analysis.
Conversely to other approaches, in our case we do
not use artificial weighting of features and distances
or a priori clustering or machine learning steps, but
instead use real data with multiple features and weigh
the built distance graphs by the points’ differences ac-
cording to a specific feature, and investigate the be-
haviour of the difference distributions. We investi-
gate the possible connections between distance dis-
tribution histograms and the appearance of the giant
component in random geometric graphs, which are
the closest representation of point vs. difference (i.e.
distance) behaviour in real life datasets. The goal is to
show that the method of difference distribution anal-
ysis is a good alternative to previous methods to find
features with higher discrimination. We intend to lay
the foundations of a framework for automatic feature
evaluation and selection based solely on the descriptor
difference statistics and the respective graph analysis
with the goal of finding the best possible selection of
descriptor combinations for the representation of re-
lated image and video contents.
2 DESCRIPTOR EVALUATIONS
FOR FEATURE SELECTION
2.1 Dataset
The dataset used for the performed tests was a video
database collected from real television captures, re-
sized to 320 pixel width. The captures consist of var-
ious content categories, e.g. sport , nature , cartoons,
news, street surveillance, outdoor, indoor, also con-
taining various types of camera motions, shot lengths,
and scene contents. Some example frames from vari-
ous videos are shown on Fig. 1. The videos were cut
into shots by our automatic shot detector, resulting in
6900 video shots with various length. The total time
length of the dataset videos is 515.82 minutes.
Figure 1: Sample frames from a small subset of different
video contents.
For each shot a representativeframe was extracted
(based on colour histograms). When running image-
based descriptors, these representative frames are
used as the input for a shot. When running shot/video-
based descriptors, the entire shot is used as an input.
For this dataset, we extracted all the features for im-
ages and video segments, and we also calculated the
distances of each element from all the others (thus en-
abling the creating of fully connected distance graphs
based on the extracted features).
2.2 Descriptors and Distance Measures
With the intent of evaluating various features for
general distribution and content differentiation, we
selected a set of descriptors. Some are standard
MPEG-7 descriptors (Manjunath et al., 2001), but we
also use other features as well: local binary patterns
(LBP) (Ojala and Pietikainen, 2002), curvelets (Can-
des et al., 2006), colour segmentation (Mean-Shift
(Comaniciu and Meer, 2002) based). Further fea-
tures were developed by us (average colour, relative
focus regions (Kov´acs and Szir´anyi, 2007), average
motion).
For calculating the differences between im-
ages/videos, we need to take into consideration which
types of information the extracted features contain.
For each descriptor, we used an Euclidean distance
metric, i.e. for a feature all elements can be displayed
along a 1D axis from 0 to d
max
(D) (maximal differ-
ence for the descriptor) and they all adhere to the tri-
angle inequality.
In the following we list the feature contents and
the used distance calculations for the used descriptors:
• MPEG-7 features: see (Manjunath et al., 2001)
for a comprehensive description of the extracted
feature and the used metrics.
• LBP and curvelets: Euclidean distance.
• Average colour: calculates the average colour for
image blocks and produces a quantized histogram
of such colours. Colour segmentation: calcu-
lates an image where different region classes are
colour coded and a quantized histogram is pro-
duced; the difference between two quantized his-
tograms in both cases is calculated as the sum
of absolute differences (SAD) of the 2 normal-
ized histograms: d(h
1
,h
2
) = SAD(h
1,N
,h2
1,N
) =
∑
4096
i=0
|h
1,N
(i) − h
2,N
(i)| where
h
1,N
(i) =
h
1
(i) − h
1,min
h
1,max
− h
1,min
(1)
and similarly for h
2,N
.
• Relative focus regions: blurred/focusedregion ex-
traction based on (Kov´acs and Szir´anyi, 2007);
produces a relative focus map; the difference be-
tween two focus maps is the sum of squared dif-
ferences: SSD( f
1
, f
2
) =
1
fw∗ fh
·
∑
fw∗ fh
i=0
( f
1
(i) −
VISAPP 2012 - International Conference on Computer Vision Theory and Applications
376

f
2
(i))
2
where fw, f h are the width and height of
the maps.
• Average motion: calculates the average motion
direction for frame blocks and produces a direc-
tion histogram for the video segment on which
it was run; the differences are calculated as the
root squared difference of the two histograms:
d(h
1
,h
2
=
p
∑
i
(h
1,i
− h
2,i
)
2
.
3 DISTRIBUTIONS OF PAIRWISE
DISTANCES
The graph of elements is built as follows. The vertex
set of the graph models the images/videos, the dis-
tance between them is calculated using the extracted
features. The edge weights of the graph are propor-
tional to the distances. The distribution of the result-
ing distance values is then analysed. The test results
show that depending on the descriptor used to calcu-
late the distances, the distance distributions can differ
in important aspects, which we intend to exploit.
The investigation of distance distributions among
database elements according to different descriptors
provides information about the discriminative proper-
ties of a certain descriptor (Fig. 2 shows some exam-
ples of such distributions). As others (Zhang et al.,
2010) have shown for small point sets, difference dis-
tribution behaviour can be a basis for descriptor se-
lection (or dropping). In our case, we produced dis-
tance distributions for approx. 7000 elements from
the database, applying 13 different descriptors (cal-
culating the distance of each image/video from each
other, for all descriptors). Our empirical results show
that descriptors which produce distance histograms
with the main peak near 0 will be less discriminative
than others (i.e. most of the elements gather in one
group).
4 GIANT COMPONENTS AND
PHASE TRANSITION IN
RANDOM NETWORKS
The appearance of the giant component is a well
known phenomenon and it was investigated in several
papers, but mostly in random networks. The results
known in this topic correspond to theoretical results
on the existenceof the giant component, and measure-
ments on the exact threshold where the giant compo-
nent first appears. Applications are usually restricted
to the ER-model, however in recent years random ge-
ometric graphs (RGG) have received more attention.
These type of graphs have the ability to model net-
works, where the edge weights are not independent,
for example derived from a metric between the ver-
tices, and this model stands closer to modelling real
image/video datasets. In this section we will give a
short overview on the problem of the giant compo-
nent, the random graph models, and the known re-
sults.
4.1 ER-model
Erdos and Renyi analysed the properties of a random
graph with uniformly distributed edges (Erdos and
Renyi, 1960). They considered the evolution of the
components, while adding randomly selected edges
to the graph. The process starts with n vertices and 0
edges, and in each step a randomly selected new edge
is added independently of the already chosen edges.
Recent results connected to this problem are formu-
lated using the number of vertices, and the p probabil-
ity of the existence of an edge (G(n, p)). p is usually
described as a function of a parameter c: p = c/n.
Part of the theorem of Erdos and Renyi presented
in (Erdos and Renyi, 1960) can be formulated as fol-
lows:
Theorem 1. (Erdos-Renyi) The behaviour of the ER-
graph from the point of view of component sizes can
be divided into three important phases: The size of
the largest component is denoted by C
max
1) c < 1: C
max
= O(lnn). (The graph has small
components)
2) c = 1: C
max
= Θ(n
2/3
).
3) c > 1: C
max
= O(n) (giant component), but all
the other components have size O(lnn).
The results presented in (Erdos and Renyi, 1960)
also deal with the complexity of the components, but
now we only interested in their size.
4.2 Random Geometric Graphs
Besides the above mentioned classic random graph
models, several different versions have been pub-
lished in order to model certain properties of complex
real networks. For example in case of distance graphs,
the edge-weights corresponds to pairwise distances of
objects based on a given metric. Random geometric
graph models offer a solution to mimic these type of
dependencies, since in this model, the edge-weights
are not selected independently of each other (Penrose,
2003).
Definition 1. A random geometric graph or RGG is
obtained as follows. We take X
1
,X
2
,...,X
n
∈ R at ran-
dom (according to some probability distribution ν on
GRAPH BASED DESCRIPTOR EVALUATION TOWARDS AUTOMATIC FEATURE SELECTION
377

0 0.2 0.4 0.6 0.8 1
0
0.02
0.04
0.06
0.08
0.1
0.12
0.14
0.16
Edgeweights
Ratio of appearance
N=4000
N=5000
N=6899
(a) Average colour based distance distributions
0 0.2 0.4 0.6 0.8 1
0
0.05
0.1
0.15
0.2
Edgeweights
Ratio of appearance
N=4000
N=5000
N=6899
(b) Focus histogram based distance distributions
0 0.2 0.4 0.6 0.8 1
0
0.01
0.02
0.03
0.04
Edgeweights
Ratio of appearance
Random samples − uniform, 10 dimensions
N=4000
N=5000
N=7000
(c) Random samples based distance distributions
Figure 2: Distance distribution histograms for different descriptors.
R
d
, where d is the number of dimensions). For i 6= j
we connect X
i
and X
j
if k X
i
− X
j
k< r
n
. r
n
is the ra-
dius of the random geometric graph.
The existence of the giant component in random
geometric graphs has also been examined. Thermod-
inamic limit, a term of statistical physics was used to
describe this phenomenon. This limit corresponds to
the critical radius of the RGG: r
n
∼ c· n
−1/d
. At this
limit, the expected value of the average degree in the
graph tends to a constant. Above a certain c constant
in the formula of the radius r
d
n
there is likely to be a
giant component.
Unfortunately, the exact value of r
n
is unknown.
The fact, that 0 < r
n
< ∞, if d ≥ 2 is an interesting
result of continuum percolation, in itself.
Our aim with the tests on random geometric
graphs is to analyse the correspondence between the
critical value r
n
(or in other words the critical edge
weight), the dimension of the RGG and the number
of vertices. Although we cannot give exact values,
the tendencies are also important in real applications,
and for our purposes.
In Fig. 3 the correspondence between the previ-
ously mentioned parameters is shown. It is important
to note, that the number of dimensions has a signif-
icant impact on the critical edge weight in case of
RGGs. There is a difference between the results in
case of different graph sizes as well, but it is not that
relevant compared to the number of dimensions.
0 20 40 60 80 100
0.55
0.6
0.65
0.7
0.75
0.8
0.85
0.9
0.95
Number of dimensions
Weight thresholds
Critical weight values
N=1000
N=2000
N=3000
N=4000
N=5000
N=6000
N=7000
N=8000
N=9000
N=10000
Figure 3: Critical weight values of artificial datasets.
5 GIANT COMPONENTS IN
REAL DATASETS
The appearance of the giant component in real net-
works with geometric restrictions on the edge weights
is an interesting mathematical topic on its own, but it
also has the potential to be used in applications where
the structure of the evolving graph is important as
well.
In retrieval and clustering tasks finding the ’op-
timal’ graph structure is still an open question. Al-
gorithms for weighted graphs are usually more com-
plex than the ones for non-weighted graphs. Due to
this fact, several applications transform the originally
weighted graph into a non-weighted one for process-
ing. In this case the question arises: how to transform
the weighted graph? The generally applied solution is
to select a distance threshold; if the distance between
two vertices is lower than the threshold, the vertex
pair will be connected. Studying the graph structure
with differentthresholds is a key step for selecting this
threshold.
On one hand, our tests intent to analyse the evolv-
ing components at different thresholds for a given de-
scriptor and the corresponding metric. On the other
hand, graphs of different descriptors are compared,
and based on the these test results, we propose a new
aspect of comparing the descriptors themselves.
5.1 Appearance of the Giant
Component
The ’descriptor graphs’ were analysed to find out
whether the appearance of the giant component is
traceable, and if it is, how does it depend on the se-
lected descriptor. By definition, the giant component
is a component with size O(n), while all other compo-
nents have size O(logn), so the exact critical threshold
can be determined by the analysis of the asymptotic
behaviour of the network. In the case of our tests on
VISAPP 2012 - International Conference on Computer Vision Theory and Applications
378

Figure 4: Example of components at an inner building step of the Edge histogram graph. The similar images tend to corre-
spond in the same component.
real data this type of test can not be carried out, since
we are working with a finite number of vertices, but
acceptable estimations are available.
The stopping condition for selecting edges in the
descriptor graph is the estimated threshold, where the
giant componentappears. In our finite graphsthe ratio
of the second and the largest component will be the
parameter to track the evolving components.
5.2 Ratios of Largest and Second
Largest Components
The ratio of the largest and second largest component
is relevant with relation to descriptor behaviour, dur-
ing the building of the graph in the search for the point
where the single giant component appears. This ratio
shows different behaviour w.r.t. simulated datasets,
showing multiple peak regions during the process.
This means, that during the graph edge/weight se-
lection there are intervals when multiple components
grow in parallel, which is inline with the expectations
that when multiple content classes of images/videos
are in the same dataset, a descriptor will produce
denser regions, containing smaller components with
similar contents.
As it was mentioned, the ratio of the largest and
second largest component is important in relation to
descriptor behaviour,during the building of the graph,
in the search for the point where the single giant
component appears. This ratio (examples shown in
Fig.5 and 6) shows different behaviour w.r.t. simu-
lated datasets, with multiple peak regions during the
process. This solidifies the expectations that different
components growing in parallel will produce separate
denser regions containing inter-similar contents.
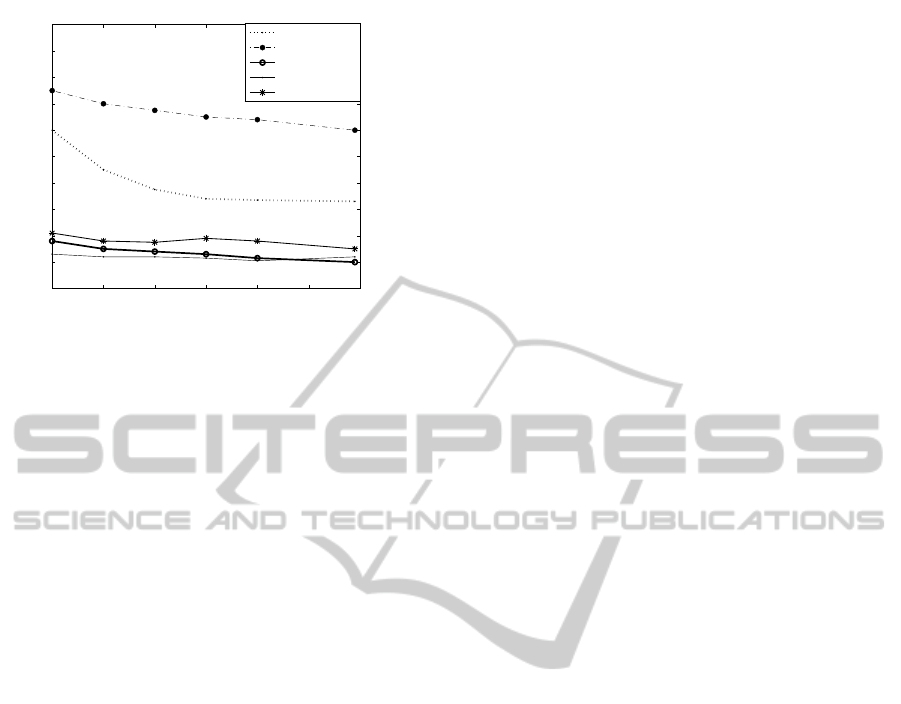
The critical edge weights of some descriptor
graphs are shown on Fig. 7. As shown, the criti-
cal weights depend on the number of vertices of the
graph, but the impact of this parameter depends on the
0 0.005 0.01 0.015 0.02 0.025 0.03 0.035 0.04
0
0.2
0.4
0.6
0.8
1
Weight tresholds
Second / largest component size
N=1000
N=2000
N=4000
N=5000
N=6899
Figure 5: Ratio of the second and the largest component
sizes of the Focus histogram graph.
0 0.02 0.04 0.06 0.08 0.1 0.12 0.14
0
0.2
0.4
0.6
0.8
1
Weight thresholds
Second / largest component size
Average Color
Edge Histogram
Focus
ColorStructure
Curvelets
Figure 6: Ratio of the second and the largest component in
case of different descriptors.
descriptor. Detailed test results on the critical weight
value of the Focus descriptor graph (see Fig.5) shows
how it depends on the size of the graph.
Depending on the task, the estimated values of the
critical edge weights have high importance. For ex-
ample in shortest-paths based clustering task (label
propagation) it is necessary to know whether labels
could spread through the graph - i.e. is the graph con-
nected (or almost connected). In this case the optimal
threshold would be near the phase transition’s critical
value. On the other hand, if we are interested in the
selection of possible cluster cores (dense regions), we
should select a threshold that results in a graph with
GRAPH BASED DESCRIPTOR EVALUATION TOWARDS AUTOMATIC FEATURE SELECTION
379
1000 2000 3000 4000 5000 6000 7000
0
0.02
0.04
0.06
0.08
0.1
0.12
0.14
0.16
0.18
0.2
Number of vertices
Weight thresholds
Average color
Edge histogram
Focus
LBP
Dominant color
Figure 7: Critical weight values in the graph of different
descriptors.
small dense components.
Our work presents the possibility of finding the
optimal threshold, depending on the selected descrip-
tor. This way we are also able to evaluate the ’quality’
of a descriptor. The lower the critical weight value is,
the smaller the chance of finding relevant dense clus-
ter cores.
6 CONCLUSIONS AND FUTURE
WORK
This paper presents the first steps towards an auto-
matic feature selection framework, investigating de-
scriptor behaviour based on the analysis of random
geometric graphs structures built from real data and
by using element distances based on several descrip-
tors and their distance / difference distributions along
with the generic behaviour of such graph types dur-
ing the appearance of the giant component. Our next
goal is to produce a descriptor evaluation framework
which analyses graph-connectednessweighted by dif-
ference distributions and their relation to the thresh-
olds associated to the estimated appearances of the
giant component, and rank descriptors (and combina-
tions of descriptors) based on these properties. His-
tograms of such distances combined with graph anal-
ysis based on random graph theory can provide a solid
foundation for image and video feature selection.
ACKNOWLEDGEMENTS
This work has been partially supported by Hungarian
Scientific Research Fund grants 83438 and 80352.
REFERENCES
Candes, E., Demanet, L., Donoho, D., and Ying, L. (2006).
Fast discrete curvelet transforms. Multiscale Model-
ing and Simulation, 5(3):861–899.
Chapelle, O., Vapnik, V., Bousquet, O., and Mukherjee,
S. (2002). Choosing multiple parameters for support
vector machines. Machine Learning, 46(1):131–159.
Comaniciu, D. and Meer, P. (2002). Mean shift: A ro-
bust approach toward feature space analysis. IEEE
Trans. on Pattern Analysis and Machine Intelligence,
24(5):603–619.
Erdos, P. and Renyi, A. (1960). On the evolution of random
graphs. Pbulication of the Mathematical Institute of
the Hungarian Academy of Sciences.
Guldogan, E. and Gabbouj, M. (2008). Feature selection
for content-based image retrieval. Signal, Image and
Video Processing, 2(3):241–250.
Kov´acs, L. and Szir´anyi, T. (2007). Focus area extraction
by blind deconvolution for defining regions of inter-
est. IEEE Tr. on Pattern Analysis and Machine Intel-
ligence, 29(6):1080–1085.
Manjunath, B. S., Ohm, J. R., Vasudevan, V. V., and Ya-
mada, A. (2001). Color and texture descriptors. IEEE
Trans. on Circuits and Systems for Video Technology,
2(6):703–715.
Morris, M. and Kender, J. (2009). Sort-merge feature selec-
tion and fusion methods for classification of unstruc-
tured video. In Proc. of IEEE international conference
on Multimedia and Expo, pages 578–581.
Ojala, T. and Pietikainen, M. (2002). Multiresolution gray-
scale and rotation invariant texture classification with
local binary patterns. IEEE Trans. on attern Analysis
and Machine Intelligence, 24(7).
Penrose, M. (2003). Random Geometric Graphs. Oxford
University Press.
Setia, L. and Burkhardt, H. (2006). Feature selection for
automatic image annotation. In Proc. of 28th Pat-
tern Recognition Symposium of the German Associ-
ation for Pattern Recognition. Springer.
Shen, Y., Lu, H., and Xue, X. (2007). A semi-automatic
feature selecting method for sports video highlight an-
notation. In Proc. of 9th Intl. Conference on Advances
in visual information systems, pages 38–48.
Sun, Y., Todorovic, S., and Goodison, S. (2010). Local
learning based feature selection for high dimensional
data analysis. IEEE Trans. on Pattern Analysis and
Machine Intelligence, 32(9):1610–1626.
Zhang, W., Men, S., Xu, L., and Xu, B. (2010). Feature
distribution based quick image retrieval. In Proc. of
Web Information Systems and Applications Confer-
ence, pages 23–28.
VISAPP 2012 - International Conference on Computer Vision Theory and Applications
380
