
EXPERIMENTS ON FACIAL CLASSIFICATION IN LOW LIGHT
CONDITIONS
Peter Paul
1
and Yuheng Wang
2
1
Xerox Research Center Webster, Xerox Corporation, 800 Phillips Road, MS147-57B, Webster, NY, U.S.A.
2
Golisano College of Computing and Information Sciences, Rochester Institute of Technology, Rochester, NY, U.S.A.
Keywords: Face Detection, SMQT, SNoW, Vehicle Occupancy Detection, Design of Experiments, DOE.
Abstract: Robustness of SNoW based face detection using local SMQT features to low light conditions is examined
through experimental investigation. Low light conditions are emulated by varying camera aperture and
camera exposure time to a xenon flash device in night time conditions. For face detection in the context of
vehicle occupancy detection, it was found that reducing the illumination to 25% of that required for a
properly exposed image to a human observer resulted in a reduction in face classification score that did not
significantly reduce classification performance.
1 INTRODUCTION
Face detection has been studied by many researchers
in the past with two popular algorithms being
AdaBoost and related methods (Viola, 2004), and
the Sparse Network of Winnows (SNoW) method
(Yang, 2002); and (Nilsson, 2007). By using local
Sequential Mean Quantization Transform (SMQT)
based features, the SNoW method proposed in
(Nilsson, 2007) possesses some robustness to
illumination variation. This paper examines the
extent of its robustness to low illumination
conditions.
One application where low illumination is
common is in face detection for vehicle occupancy
detection. Vehicle occupancy detection using image
analysis has been widely studied in the context of
automated high occupancy lane enforcement
approaches (Billheimer, 1990); (Wood, 2003);
(Birch, 2004); (Hao, 2010). In this application
artificial illumination is required for night time use.
However, visible light illumination at night time is
not desirable due to driver distraction. Near infrared
illumination (NIR) is used to avoid driver
distraction. However, cameras based on silicon
image sensors rapidly fall off in sensitivity in the
NIR spectral range, leading to low light image
capture conditions. Further, if xenon flash
illumination is used, low illumination is desired to
insure an adequate bulb life, to provide the quick
recharge time required for highway operation, for
lower power consumption, and for lower cost. Thus
it is important to understand the robustness of face
detection in low light conditions.
This paper is organized as follows: Section 2
contains the theory, Section 3 describes the
experimental setup, Section 4 describes the results,
and Section 5 contains the conclusions.
2 THEORY
The face detection method chosen in this work is the
SNoW method using local SMQT features as
described in (Nilsson, 2007). This method will be
briefly reviewed, emphasizing the aspects that result
in robustness to illumination variation.
For the face detection method described in
(Nilsson, 2007) a simple SMQT1 transformation is
performed on a local 3x3 pixel region surrounding a
pixel of interest. The level 1 SMQT procedure,
referred to as SMQT1, is simply as follows: (1)
Calculate the mean of the pixels in the local region,
(2) Set those pixels whose grey values are above the
mean to 1, (3) Set all other pixels to 0, (4) this
defines a 9 bit binary value (one bit per pixel in the
3x3 local region) which defines 1 of 512 possible
patterns associated with the pixel of interest. This 9-
bit pattern becomes the feature associated with the
pixel of interest. This process is performed for all
738
Paul P. and Wang Y..
EXPERIMENTS ON FACIAL CLASSIFICATION IN LOW LIGHT CONDITIONS.
DOI: 10.5220/0003871207380741
In Proceedings of the International Conference on Computer Vision Theory and Applications (VISAPP-2012), pages 738-741
ISBN: 978-989-8565-03-7
Copyright
c
2012 SCITEPRESS (Science and Technology Publications, Lda.)
pixels in a frame, where a frame is 32 pixels by 32
pixels area where face detection is to be performed.
SNoW is simply a linear classifier on this large
feature space using the winnow update rule to
update the linear classifier’s weights. This is
described in detail in (Yang, 2000); and (Nilsson,
2007). The 32x32 pixel frame is then slid around the
image to detect faces. The image is also rescaled to
detect faces at different scales.
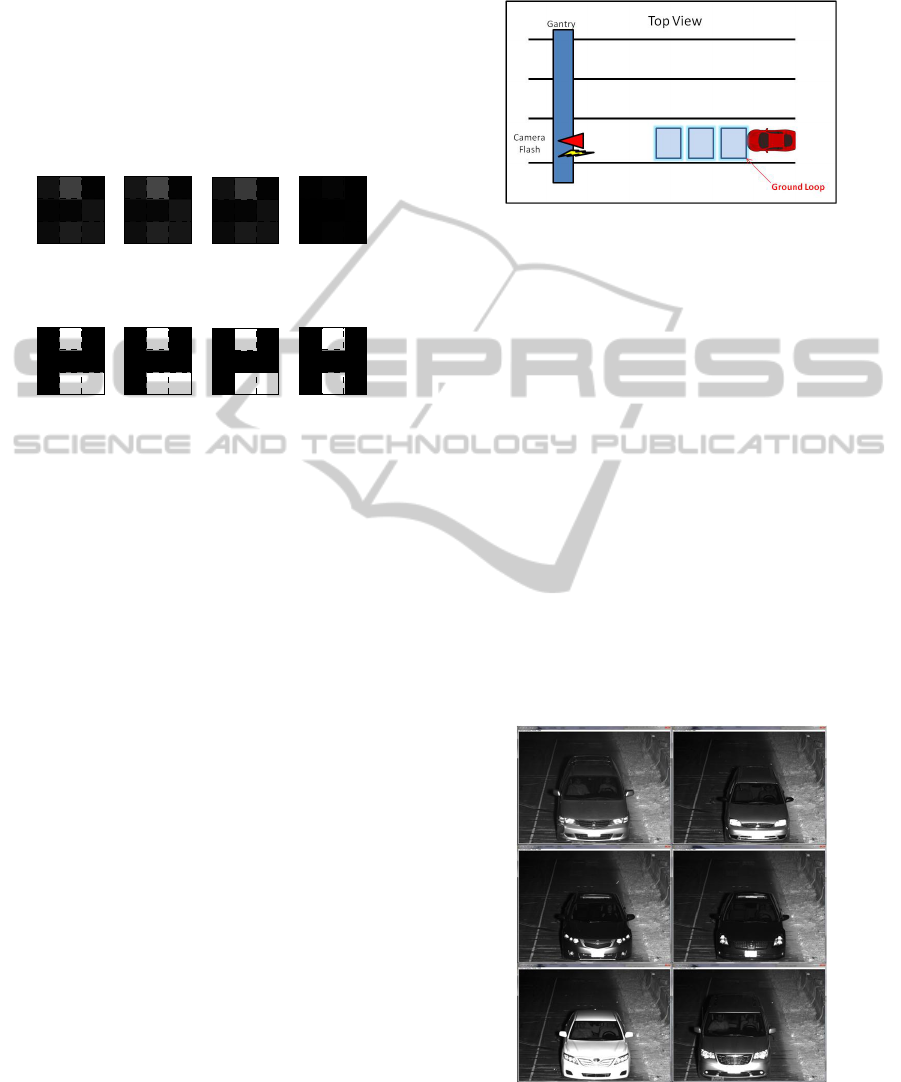
Figure 1: SMQT1 on 3x3 pixel local regions.
Figure 1 depicts the local SMQT1 features on
3x3 local image regions. The upper left 3x3 region
depicts the original 8-bit grey scale values. The 3x3
binary region directly below describes the 3x3
SMQT1 feature used for classification associated
with the center pixel. The upper two center 3x3
region depicts the original image subject to a 10%
gain and loss in grey value, respectively. This may
occur in a real image due to variations in ambient
lighting conditions, for example, or may be due to
variations in vehicle windshield transmission. In any
event, the SMQT1 process recovers the local pattern
independent of the gain on the grey values. This
shows why the SNoW face detector using local
SMQT features may be a good choice when lighting
variations are present. However, in the upper right
image, when imaging in very low light conditions,
information may be lost due to low light saturation
that is not recovered in the SMQT1 process,
depicted directly below. This is simply due to
quantization effects. A similar analysis can be made
for local pixel grey level offset (as well as was
shown, above, for gain), as shown in (Nilsson,
2007). Low level illumination may often present
itself as a combination of gain and offset variation,
so local SMQT features may have robustness to this
variation, and thus to low illumination levels.
However, at some point information is lost, and any
processing gain applied to the tone level will only
increase noise.
This analysis motivates the experimental
determination of the low light level that causes the
SNoW face detector based on local SMQT features
to show face classification performance degradation.
Figure 2: Top view of the experimental testbed.
3 EXPERIMENTAL SETUP
A race track was outfitted with an overhead highway
gantry system. The camera used in these
experiments was mounted on the overhead gantry.
The gantry based set up is depicted in Figure 2. The
camera was triggered from a ground induction loop
buried underneath the surface of the roadway. When
the vehicle drives on top of the ground loop, a
trigger signal is issued and the flash is fired and the
camera captures an image.
The camera consisted of a silicon CMOS sensor
based machine vision camera. The flash unit was a
photographic studio flash unit utilizing xenon flash
tube technology. Filters were used on both the
camera and the flash unit to limit the spectral
sensitivity of the camera and the spectral content of
the light to the NIR range.
Figure 3: The six vehicles used in the study.
Six vehicles were driven past the camera system.
They are depicted in Figure 3. Three vehicles had a
Original
SMQT1 of Above
Original x 1.1
SMQT1 of Above
Original x 0.9
SMQT1 of Above
Original x 0.1
SMQT1 of Above
EXPERIMENTS ON FACIAL CLASSIFICATION IN LOW LIGHT CONDITIONS
739
sole driver and three vehicles had a driver plus a
front seat passenger. The vehicles ranged from
sedans to minivans encompassing various makes and
models of vehicles. The vehicles were driven at a
relatively constant speed of approximately 72.4
km/h (45 mph) as maintained either by the driver or
by the vehicle’s cruise control.
3.1 Experimental Design
To investigate the effect of low lighting conditions
on face detection performance a Design of
Experiments (DOE) procedure was performed. The
design was a 2 factor multi level full factorial design
with 6 replicates. The 6 replicates were the 6
vehicles used in the experiment. The first factor was
Aperture Size as percent of nominal with 4 values
(1.0, 0.25, 0.1340, 0.0625), while the second factor
was Exposure Time in milliseconds with 3 values
(0.5, 1.0, 2.0). The full factorial design had 12 runs
for each of the 6 vehicles.
4 RESULTS AND ANALYSIS
For each of the 12 runs, six vehicle images were
captured and face detection was performed using
SMQT features and SNoW. Following (Nilsson,
2007), a classifier was constructed and trained using
approximately 2000 face samples and non-face
samples taken with Aperture at 1.0 and Exposure at
0.5.
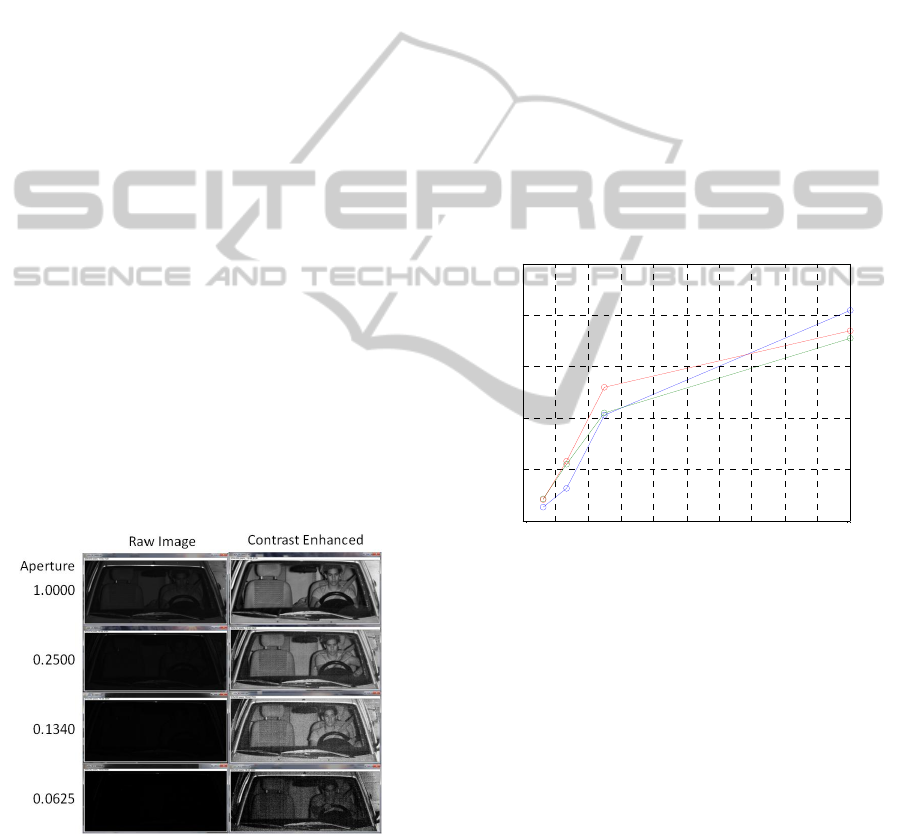
Figure 4: Vehicle images at various aperture settings. Raw
images and contrast enhanced.
The raw images for one of the vehicles, as the
camera aperture is varied, is shown on the left side
of Figure 4. As the aperture is decreased, the images
get quite dark. The right side of Figure 4 depicts the
images using histogram equalization for human
viewing only, it is not used in the face detection
algorithm. For the low light conditions, significant
noise appears in addition to the face patterns. Also
note that a human observer can easily discern the
number of human occupants in the contrast
enhanced version of even the lowest light image.
The SNoW classifier using SMQT local features
operates on the images to the left of Figure 5 in
attempting to classify the faces – contrast
enhancement is not used.
Figure 5 depicts the mean face classification
score versus camera aperture for the three exposure
durations used in the experiment. The classification
score is simply the sum of the active weights for an
image under test, which is the value compared to a
threshold to determine if the image is a face, see
(Nilsson, 2007) for more details. The mean is taken
over the six vehicles used for each case. Note that
changes in the camera aperture are roughly
equivalent to illumination changes.
Figure 5: Face classification score versus camera aperture
for three exposure durations.
The blue graph is Figure 5 depicts the 0.5 msec
exposure duration cases, the green graph depicts the
1 msec exposure duration cases, and the red graph
depicts the 2 msec exposure duration cases.
Face classification performs well at the nominal
aperture setting. The face classifier tends to drive
non-faces to classification scores less than zero. A
face classification score above 50 would lead to just
adequate classification performance, relative to false
alarms, for this application. Thus the aperture setting
equivalent to 0.25 of the nominal aperture would
give good face classification performance, while that
of 0.1340 would be marginal. An aperture of 0.0625
of the nominal would not give adequate
performance.
Figure 6 depicts the mean face classification
scores versus camera exposure duration, where the
0 0.1 0.2 0.3 0.4 0.5 0.6 0.7 0.8 0.9 1
0
50
100
150
200
250
Aperture (% of Nominal)
Face Classification Score
Face Classification Score versus Camera Aperture
VISAPP 2012 - International Conference on Computer Vision Theory and Applications
740

mean is taken over the six vehicles used in each
case. The blue graph represented the nominal
camera aperture, the green curve represented a
camera aperture at 0.25 of the nominal setting, the
red curve represented a camera aperture at 0.1340 of
the nominal setting, and the cyan curve represents a
camera aperture at 0.0625 of the nominal setting. As
seen in the flatness of the curves in the figure, the
face classification score only weakly depended on
exposure duration in this experiment.
Figure 6: Face classification score versus camera exposure
duration for four aperture value.
This is at least partly due to xenon flash
illuminators having very short illumination duration.
Most of the flash tube illumination energy is
produced during the first 0.5 msec. Thus holding the
camera exposure open for longer than this duration
may not yield much more light energy, and may
increase the noise.
5 CONCLUSIONS
An experiment to investigate the illumination
variation robustness properties of a face
classification method was performed. Camera
parameters of aperture and exposure were varied to
examine the low light performance of the face
classification method. It was found that camera
aperture was a significant factor in accounting for
the variation in face classification score during the
experiment, while exposure duration while using a
xenon flash illuminator was found to be not
statistically significant in explaining variations in
face classification score. A reduction in illumination
to 25% of that used to generate a properly exposed
image to a human observer was found to produce
adequate face classification scores. A further
reduction to 13% may or may not be usable,
depending on the application. Further, it was found
that in this experiment, when using a xenon flash
illuminator and training on a single exposure
duration, increased exposure duration did not make
up for lost illumination due to camera aperture, or
equivalently, the due to a smaller illuminator.
REFERENCES
Birch, P. M., Young, R. C. D., Claret-Tournier, F.,
Chatwin, C. R., 2004. Automated vehicle occupancy
monitoring. Optical Engineering 43(8), pp. 1828-
1832.
Billheimer, J., Kaylor, K., Shade, C., 1990. Use of
videotape in HOV lane surveillance and enforcement.
Technical Report, U.S. Department of Transportation.
Hao, X., Chen, H., Yao, C., Yang, N., Bi, H., Wang, C.,
2010. A near-infrared imaging method for capturing
the interior of a vehicle through windshield. IEEE
SSIAI 2010, pp. 109-112.
Nilsson, M., Nordberg, J., Claesson, I., 2007. Face
Detection using local SMQT Features and Split Up
SNoW Classifier, IEEE Int. Conference on Acoustics,
Speech, and Signal Processing, Vol. 2, pp. 589-592.
Viola, P., Jones, M. J., 2004. Robust Real-Time Face
Detection. Int. Journal of Computer Vision 57(2), pp
137-154.
Wood, J. W., Gimmestad, G. G., Roberts, D. W., 2003.
Covert Camera for Screening of Vehicle Interiors and
HOV Enforcement. Proc. SPIE – The International
Society for Optical Engineering, vol. 5071, pp. 411-
420.
Yang, M.-H., Roth, D., Ahuja, 2000, N., A. SNoW-Based
Face Detector. Advances in Neural Information
Processing Systems 12, S. A. Solla, T. K. Leen, and
K.-R. Muller, eds., pp. 855-861. MIT Press.
0.5 1 1.5 2
0
50
100
150
200
250
Exposure Duration (msec)
Face Classification Score
Face Classification Score versus Camera Exposure Duration
EXPERIMENTS ON FACIAL CLASSIFICATION IN LOW LIGHT CONDITIONS
741
