
NUMERICAL ANALYSIS OF IMAGE BASED HIGH
THROUGHPUT ZEBRAFISH INFECTION SCREENS
Matching Meaning with Data
Alexander E. Nezhinsky
1
, Esther Stoop
2
, Astrid van der Sar
2
and Fons J. Verbeek
1
1
Imaging and Bioinformatics, Leiden University, Leiden Institute of Advanced Computer Science, Niels Bohrweg 1,
2333CA, Leiden, The Netherlands
2
Department of Medical Microbiology and Infection Control, VU University Medical Center, van der Boechorststraat 7,
1081BT, Amsterdam, The Netherlands
Keywords: Image Analysis, Pattern recognition, Clustering and Classification.
Abstract: Tuberculosis is an ancient disease; however, the molecular mechanism of tuberculosis pathology is not
completely elucidated yet. In our research we aim to contribute to the understanding of the genes/proteins
that are involved in the infection. As a model for the infection study we use the bacterium Mycobacterium
marinum, which is closely related to Mycobacterium tuberculosis, the causative agent of tuberculosis in
humans. M. marinum causes tuberculosis like disease and is applied to the zebrafish larva as a model (host)
organism. We are using a novel pattern recognition framework which allows for in depth analysis of the
spread of infection within the zebrafish organism. The amount of infection has been analyzed. However, in
depth analysis of the spatial distribution was not yet accomplished. Therefore, as a proof of concept we
investigate the presence of specific spatial and quantitive infection patterns.
1 INTRODUCTION
Tuberculosis is a serious disease and a significant
part of the world population is infected.
Unfortunately, effective treatment is still difficult
due to bacteria resistance. In order to elucidate
which genes are responsible for infection, the
behavior of the tuberculosis bacteria -
Mycobacterium tuberculosis needs to be analyzed.
In our study this behavior is modeled by a close
relative – the Mycobacterium marinum (Mm). The
Mm is hosted in cold blooded animals. For our study
the zebrafish is used as a host. Zebrafish makes a
good model for analysis as its immune system is in
many ways comparable to human. The zebrafish
larvae can be obtained in large numbers and studied
by fluorescent imaging. In this matter a visual
inspection of bacteria can be obtained.
Infection of the zebrafish with Mm is
characterized by the presence of granulomas.
Granulomas are clusters of immune cells and
bacteria indicating infection. They can be visualized
with fluorescent agents.
In order to determine which genes of Mm are
involved in formation of granulomas we created
1000 random mutants of the Mm bacteria and
screened for those mutants that were not able to
efficiently infect zebrafish larvae (Stoop et al.,
2011). We have identified 30 mutant bacteria unable
to infect larvae.
In order to gain more insight on the progression
of Mm infection it is required to analyze infection
spread in the host, c.q. the zebrafish, over a certain
period of time. This requires the following questions
to be answered: (1) Is there a pattern in the
appearance of granuloma clusters in certain tissues,
(2) does appearance differ in bacterial mutants.
The analysis is accomplished though imaging.
For each zebrafish a bright field and fluorescence
microscopy image is acquired. Until recently, these
images were analyzed manually. The analysis
included localization of the zebrafish shape and
qualitative estimation of the granuloma cluster size
and spread. Consequently, no objective numerical
data could be retrieved.
We have designed and implemented an
automated framework for shape retrieval and cluster
analysis (Nezhinsky and Verbeek, 2011). This
framework has been applied in large scale
applications (Stoop et al., 2011).
257
E. Nezhinsky A., Stoop E., van der Sar A. and J. Verbeek F..
NUMERICAL ANALYSIS OF IMAGE BASED HIGH THROUGHPUT ZEBRAFISH INFECTION SCREENS - Matching Meaning with Data.
DOI: 10.5220/0003872902570262
In Proceedings of the International Conference on Bioinformatics Models, Methods and Algorithms (BIOINFORMATICS-2012), pages 257-262
ISBN: 978-989-8425-90-4
Copyright
c
2012 SCITEPRESS (Science and Technology Publications, Lda.)
The framework is based on an algorithm for
shape retrieval (Nezhinsky and Verbeek, 2010) to
automatically find the zebrafish shape(s) in the
image. The algorithm uses deformable template
matching (Jain et al., 1998) and labels the regions
for further analysis. This approach made it possible
to analyze the infection amount per fish in an
automated fashion.
As a proof of principle, a study for the detailed
analysis was performed to find a strategy for
analysis. As a test case we have chosen mutant 714,
as it is one of the 30 mutants which does not make
the fish ill. We are focusing on the question: can we
analyze the spread and size of the granuloma
clusters after infecting the zebrafish. In addition, we
compare similarity in larvae infected with the wild
type Mm and mutant 714.
2 DATASET
The dataset we have used for the analysis consisted
of 189 infected zebrafish larvae. The larvae were
divided into 3 groups: not infected larvae [NI](5),
infected with Mycobacterium marinum [MM](67)
and those infected with the 714 mutant [714M]
(117).
For the infection approximately the same amount
of bacteria was used; the volume was plated on
7H10 plates. At injection the zebrafish were 6 days
old; the imaging was done 5 days past infection
injection.
2.1 Microscopy
Images of wells containing zebrafish were acquired
with a Leica DC500 microscope. During the
experiment up to 3 zebrafish larvae were present in a
single well, as a result a single image can contain up
to 3 individuals.
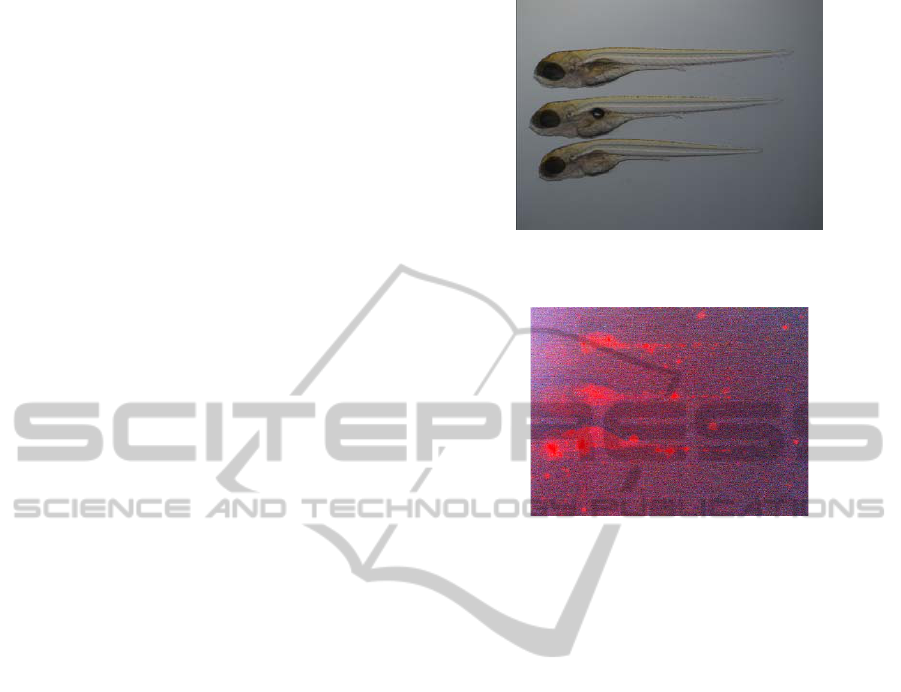
For each well, both bright field and fluorescent
images were acquired. The bright field image
contains the zebrafish shape, while the fluorescent
image contains the signal at granuloma locations. An
example of such images for a single well is
presented in Figure 1 and 2. As can be seen the
fluorescent images have very low (and different)
intensity values, which makes consistent manual
analysis very difficult and imprecise.
Images were taken in batches of 30 wells. Each
batch contained sibling zebrafish larvae of the three
groups in the same imaging settings.
Figure 1: A bright field image containing up to 3 shapes of
the zebrafish larva.
Figure 2: A fluorescent image containing the signal of
granuloma spread. For visualization purposes the contrast
is enhanced.
2.2 Software
The images are the input for the analysis framework
(Nezhinsky and Verbeek, 2011), which consisted of
two steps. First the zebrafish are localized and the
result is used as a mask for the fluorescent image.
Within the mask a threshold value is determined.
Finally the data is analyzed and written to a comma
separated file.
2.2.1 Bright Field imaging: Shape
Localization and Annotation
The algorithm is applied to the bright field images so
as to obtain a were region of interest (ROI) and
annotation of the relevant areas. A deformable
template was used for the retrieval of the zebrafish
shapes. In order to be able to detect different regions
of the fish, the template was divided in 11 parts
counting from head to tail (numbered from 0 to 10).
This allows annotating the shape as well as doing
spatial analysis. In Figure 3 the graphical
representation of a prototype template (Felzenwalb,
2003) used for our experiments is shown. Parts 0
and 1 can be seen as the head region, 2 till 4 as the
trunk region and other slices as the tail region. This
division of the larva in parts is inspired from the
literature (Volkman et al., 2004). The injection site
BIOINFORMATICS 2012 - International Conference on Bioinformatics Models, Methods and Algorithms
258
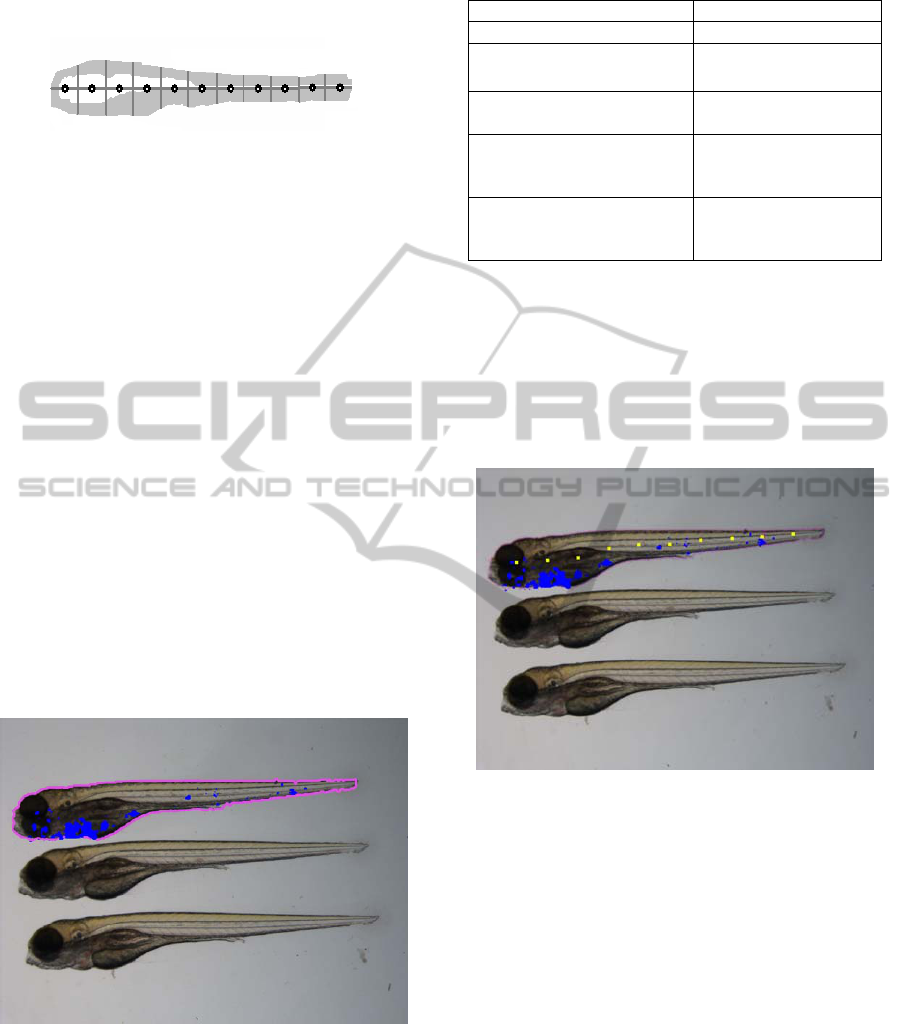
of infection is located at approximately part 5
(Cosma et al., 2006).
Figure 3: Graphical representation of the prototype
template used for our experiments. The template is created
from averaging a test set of 20 training shapes(Cootes et
al.,1994).
2.2.2 Fluorescent Imaging: Analysis
For the actual measurement of clusters fluorescent
images were used and related to the mask size,
obtained from the bright field images.
The NI group is expected to have no infection at
all and thus the level of their maximal fluorescent
signal is considered as noise level n. No infection/
granuloma formation is present at NI, therefore this
group was only used to obtain a noise level
reference. In the other groups all signal below n is
considered noise, while all signal above represents
granuloma presence. This signal is analyzed per fish
and written to an csv file as shown in Table 1
2.2.3 Output and Dataset Creation
Output is created in the form of an overlay image
containing the found zebrafish and infection as
shown in Figure 4 and csv file.
Figure 4: Graphical output of the framework overlaid on
the original image for the top fish in the image. The
magenta line denotes the shape mask contour and the blue
regions indicate the presence of granuloma formation.
This image is created in an automated fashion.
Table 1: Fields contained in the output csv per larva.
Field name Explanation
TotalArea Total shape area
ClusterCount (CC)
Total amount of
clusters in the larva.
ClusterTotalSize (CS)
Total sum of the area
covered by all clusters.
ClusterCountAt[#]
(CC[#])
Like ClusterCount but
measured for a single
template part.
ClusterTotalSize[#]
(Short: CS[#])
Like ClusterTotalSize
but measured for a
single template part.
Clusters of bacteria are labeled and for each of the
clusters the surface area is determined (CS[#]). The
total area (CS) of the spread is the sum over all
clusters. From the template we define 11 parts and a
cluster is always assigned to the part center with
closest geometrical distance (Nezhinsky and
Verbeek, 2010). In Figure 5 we show the part
centers as they are annotated on the fish.
Figure 5: Output for a single zebrafish larva. The yellow
dots denote the annotated part centers.
3 ANALYSIS AND RESULTS
In this section an analysis of the results is presented.
First the distribution of the clusters is discussed and
second a relation to the amount of infection is
established from the data.
3.1 Distribution of Cluster Amount
In our study we set out to analyze the relationship
between mutant and wild type in the amount of
clusters and spatial distribution. To that end we
compare the average number of clusters (
CC[]
variable) between MM and 714 (cf. Figure 6).
NUMERICAL ANALYSIS OF IMAGE BASED HIGH THROUGHPUT ZEBRAFISH INFECTION SCREENS -
Matching Meaning with Data
259
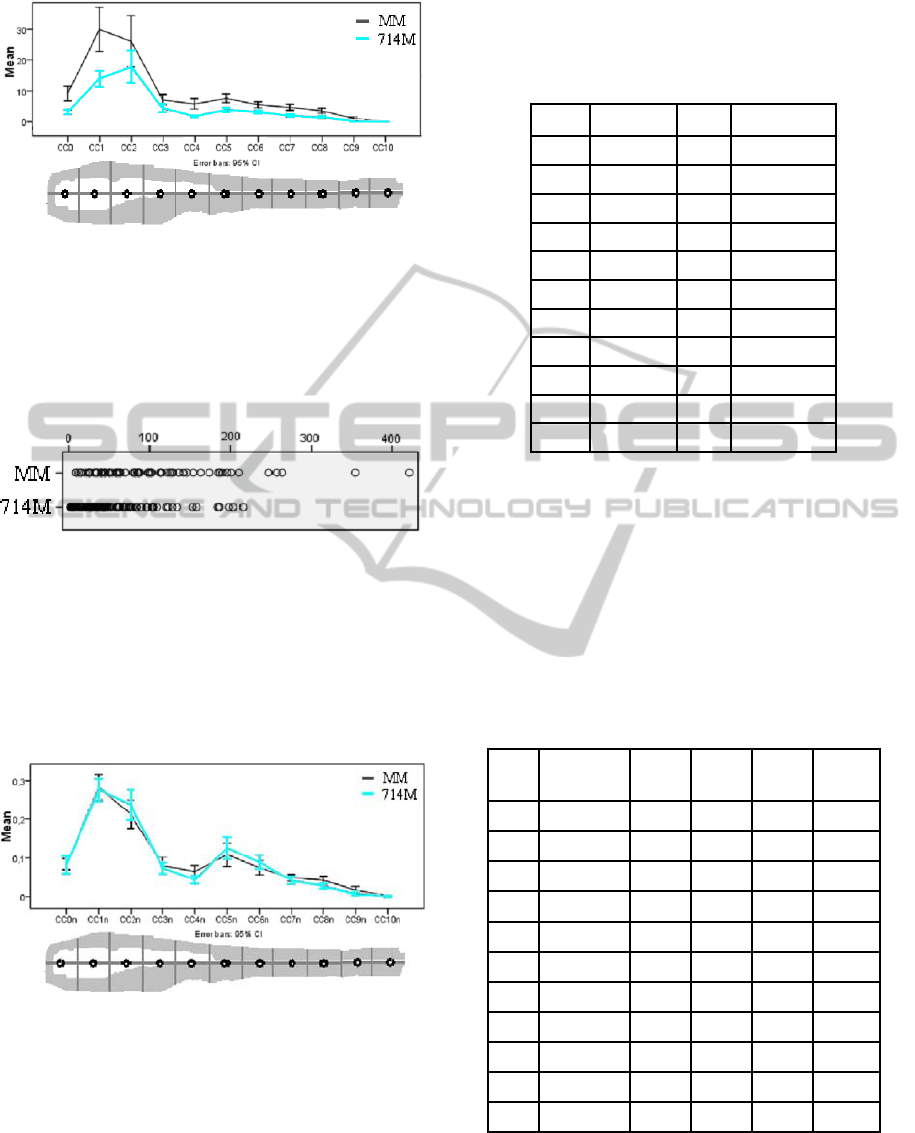
Figure 6: Spatial comparison of the average amount of
clusters for MM and 714M in relation to the zebrafish
template with a 95% confidence interval.
At this point this distribution is not conclusive. This
is due to the fact that the mean was taken from a
dataset with a certain scatter. We have analyzed the
scatter and the results are depicted in Figure 7.
Figure 7: Scatter plot of the amount of clusters in each
case of the test set used.
We are interested in the distribution of the
granuloma clusters and in order analyze the different
batches in the same way we normalize the CC[#]
over the total CC. The normalization is done for
each individual case and subsequently the mean is
calculated. In Figure 8 the results are depicted.
Figure 8: Spatial comparison of the normalized amount of
clusters for MM and 714M with a 95% confidence interval
as compared to the zebrafish template.
From the graph we can observe that MM and
714M have the same behavior. The mean and the
95% confidence interval suggest that the two
distributions can be considered as similar.
Our null hypothesis states that, under assumption
that the two groups are independent, their variances
are equal. We therefore, apply the Levene's Test for
Equality of Variances to the CC[i], i in range [0,10].
The results are shown in Table 2.
Table 2: Levene’s test for equality of variances for CC[i].
Part assume F Sig.
CC0 Equal var 5,836 0,017**
CC1 Equal var 1,526 0,218*
CC2 Equal var 6,834 0,010**
CC3 Equal var 0,403 0,526*
CC4 Equal var 0,431 0,512*
CC5 Equal var 1,508 0,221*
CC6 Equal var 6,545 0,011**
CC7 Equal var 4,200 0,042**
CC8 Equal var 0,483 0,488*
CC9 Equal var 4,029 0,046**
CC10 Equal var 0,192 0,662*
For zebrafish parts 1, 3, 4, 5, 8, 10 the
significance is always > 0.05 and thus the hypothesis
is accepted, the corresponding variances are equal
(marked with * in Table 2).
For parts 0, 2, 6, 7 and 9 the variances
significantly differ (marked with ** in Table 2).
Finally, we performed the independent samples t-
test. Based on the results from Levene’s test we
know which variances significantly differ; in Table 3
only the correct assumptions are listed.
Table 3: t-test for Equality of Means.
Part
assume t
Sig.
(2-t)
Mean
Diff
Std. Err
Diff
CC0 !Equal var
0,014
0,989 0,000 0,014
CC1 Equal var
0,244
0,808 0,006 0,023
CC2 !Equal var
-0,909
0,365 -0,024 0,027
CC3 Equal var
0,417
0,677 0,005 0,013
CC4 Equal var
2,216
0,028* 0,020 0,009
CC5 Equal var
-0,844
0,400 -0,018 0,022
CC6 !Equal var
-1,225
0,222 -0,015 0,013
CC7 !Equal var
0,815
0,416 0,005 0,007
CC8 Equal var
2,093
0,038* 0,013 0,006
CC9 !Equal var
1,603
0,112 0,008 0,005
CC10 Equal var
0,270
0,787 0,000 0,001
We observe that there is a significant difference
(this means significance < 0.05) in the mean value
for parts 4 and 8 (marked with * in Table 3).
Preliminary conclusions are as follows. In the
head the largest percentage of clusters is found,
BIOINFORMATICS 2012 - International Conference on Bioinformatics Models, Methods and Algorithms
260
followed by the injection site. Globally the
distribution is the same for both the MM and the
714M. Exceptions are part 4, adjacent to the
injection site, and part 8 where a significant larger
distribution of the MM bacteria is found compared
to 714M.
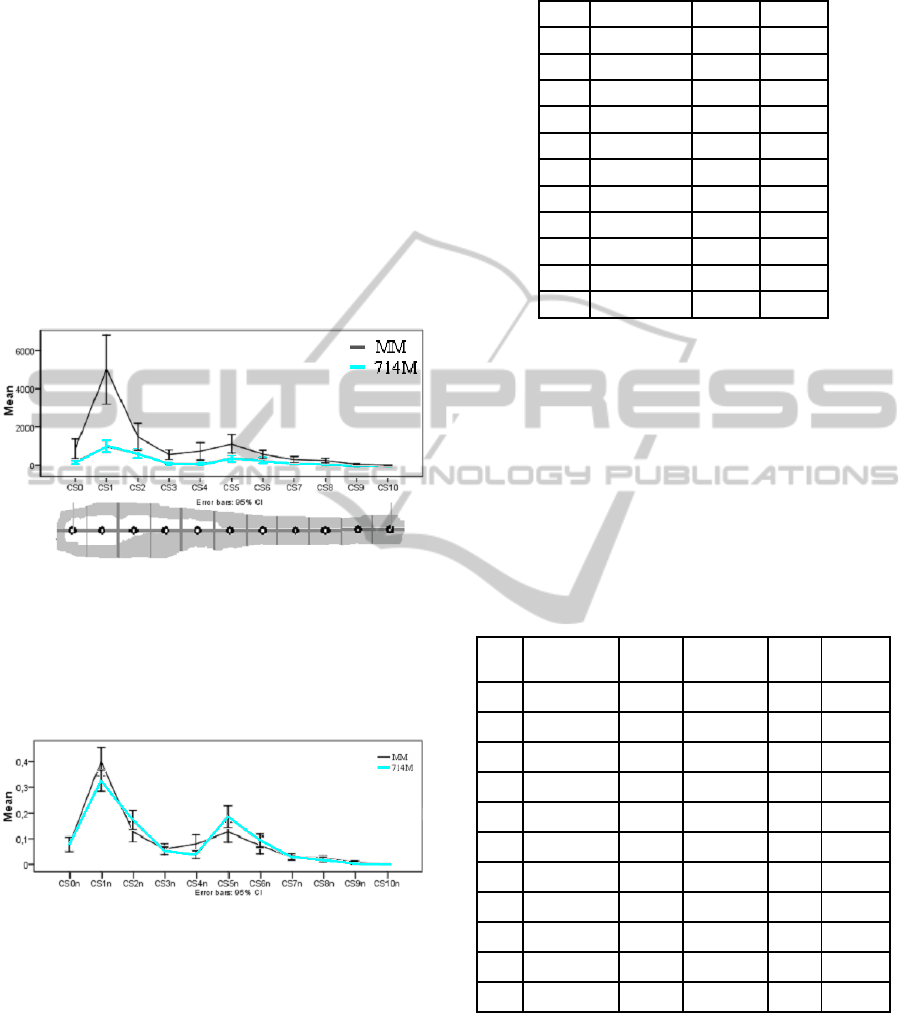
3.2 Distribution of the Amount of
Infection
Next, we analyze the relation between mutant and
wild type in the area covered by granulomas (cf.
CS[#]). In Figure 9 a graph, with 95% confidence, is
depicted of the comparison of the average area of
infection between MM and 714M.
Figure 9: Spatial comparison of the average total cluster
size for MM and 714M in comparison to the zebrafish
template.
Again, as with the cluster count, we normalize the
CS[i] over the total CS for both MM and 714M and
compare the results in Figure 10.
Figure 10: Spatial comparison of the normalized average
total cluster size for MM and 714M.
From the graph in Figure 10 it seems the mean
and the distribution is similar for some parts and
very different for others; i.e. 1, 4, 5 seems to have a
very different mean. Again, our null hypothesis
states that, under assumption that the two groups are
independent, the variances are equal. We apply the
Levene's Test for Equality of Variances to the CS[i],
with i in range [0,10]. The results are shown in
Table 4.
Table 4: Levene’s test for equality of variances for CS[i].
Part assume F Sig.
CS0 Equal var 1,245 0,266*
CS1 Equal var 0,060 0,807*
CS2 Equal var 5,108 0,025**
CS3 Equal var 0,159 0,690*
CS4 Equal var 12,545 0,001**
CS5 Equal var 10,019 0,002**
CS6 Equal var 0,750 0,388*
CS7 Equal var 1,306 0,255*
CS8 Equal var 0,014 0,907*
CS9 Equal var 4,466 0,036*
CS10 Equal var 1,202 0,274*
For parts 0, 1, 3, 6, 7, 8, 9,10 the significance
> 0.05 and thus our hypothesis is accepted. The
variances marked with * in Table 4 are equal and the
variances marked with ** are different. In Figure 10,
the differences in the mean seem considerable
though the variances for MM and 714M remains the
same.
To determine the difference of the mean values
we use the knowledge gained from the Levene’s test
to do the independent samples t-test. The results are
shown in Table 5.
Table 5: t-test for Equality of Means.
Part assume t Sig. (2-t)
Mean
Diff
Std. Err
Diff
CS0
Equal var
0,016 0,987 0,000 0,021
CS1
Equal var
2,065 0,040* 0,073 0,035
CS2
!Equal var
-1,739 0,084 -0,046 0,027
CS3
Equal var
0,517 0,606 0,006 0,012
CS4
!Equal var
2,176 0,032* 0,041 0,019
CS5
!Equal var
-2,102 0,037* -0,060 0,029
CS6
Equal var
-0,850 0,397 -0,018 0,022
CS7
Equal var
-0,305 0,761 -0,003 0,009
CS8
Equal var
0,558 0,578 0,004 0,007
CS9
Equal var
1,443 0,151 0,004 0,003
CS10
Equal var
-0,528 0,598 0,000 0,001
We observe there is a significant difference in
the mean value for parts 1, 4 and 5 (marked with * in
Table 5). This result is in correspondence with initial
observation of Figure 10 in which these means
seemed rather different.
The preliminary conclusions from these findings
are the following.
NUMERICAL ANALYSIS OF IMAGE BASED HIGH THROUGHPUT ZEBRAFISH INFECTION SCREENS -
Matching Meaning with Data
261

The larger part of the infection migrates towards
the head of the zebrafish. The second large part of
infection, however, remains at the injection site. In
wild type infected fish (MM), a larger percentage of
bacteria is located in the head compared to the 714M
mutant; i.e. significant difference of the mean while
the variance is equal.
4 CONCLUSIONS
We have used a novel framework for automated
granuloma cluster recognition in order to analyze the
spatial distribution in zebrafish larvae.
As a proof of concept we have analyzed the data
for the zebrafish larva infected with the wild type
Mycobacterium marinum and one of its mutants
(714M).
From a statistical analysis of the data we can
derive information on the spread of granuloma.
More granuloma clusters are found in the
Mycobacterium marinum infected fish. However, if
we look at the normalized spread of infection it
behaves approximately the same; it either stays at
the site of injection or it moves towards the head of
the larva. For the Mycobacterium marinum it seems
that the infection is likely to migrate towards the
head compared to the 714 mutant; in the 714 mutant
it is established that the majority of the infection
stays at the injection site.
The percentage of the amount of clusters is
distributed approximately in the same way for both
test groups.
In the near future this approach will be further
elaborated with more mutants and larger dataset.
Moreover, other measurement parameters will be
considered in the analysis. Large volumes of
analysis data will allow doing predictions from the
measurements using machine learning approaches.
ACKNOWLEDGEMENTS
This work was supported by the Smartmix Program.
REFERENCES
Cootes, T. F., Taylor, C. J., Lanitis, A., 1994. Active
Shape Models: Evaluation of a Multiresolution
Method for Improving Image Searches. In
Proceedings of the British Machine Vision
Conference, vol. 1.
Cosma, C. L., Swaim, L. E., Volkman, H., Ramakrishnan,
L. and Davis, J. M. 2006. Zebrafish and Frog Models
of Mycobacterium marinum Infection. In Current
Protocols in Microbiology.
Felzenszwalb, P, 2003. Representation and Detection of
Deformable Shapes. In cvpr, vol. 1, pp.102, 2003
IEEE Computer Society Conference on Computer
Vision and Pattern Recognition (CVPR '03) - Vol 1.
Jain, A. K, Zhong, Y., Dubuisson-Jolly, M., 1998.
Deformable Template Models: a Review. In Signal
Processing - Special issue on deformable models and
techniques for image and signal, Elsevier.
Nezhinsky, A. E., Verbeek, F. J. 2010. Pattern recognition
for high throughput zebrafish imaging using genetic
algorithm optimization. In: 5th IAPR Conference on
Pattern Recognition in BioInformatics, Lecture Notes
in Bioinformatics 6282: 302-312, Springer
Nezhinsky, A. E., Verbeek, F. J. Localization and
straightening of biological shapes using a deformable
template approach. Submitted.
Volkman H. E., Clay H., Beery D., Chang J. C. W.,
Sherman D. R., et al., 2004. Tuberculous Granuloma
Formation Is Enhanced by a Mycobacterium Virulence
Determinant. In PLoS Biol 2(11).
BIOINFORMATICS 2012 - International Conference on Bioinformatics Models, Methods and Algorithms
262
