
BEHAVIOURAL ANALYSIS OF AN IMPLANTABLE FLOW AND
PRESSURE SENSING DEVICE
J. A. Miguel, R. Mozuelos and M. Martinez
Technology Electronics, Automatic and System Engineering Department, University of Cantabria
Avda de los Castros s/n, Santander, Spain
Keywords: Biomedical transducers, Implantable biomedical devices, Cardiology.
Abstract: This paper presents a simplified MatLab model of an implantable device for pulmonary artery blood flow
velocity measurement. A comparative review of the most popular blood flow measurement techniques has
been carried out, showing the better suitability of pressure-sensing approaches to provide useful information
to cardiovascular diseases monitorization. Different possible grades of stenosis in the pulmonary artery have
been simulated in order to obtain an early estimation of the device behavior under real conditions.
1 INTRODUCTION
The development of micro-electro-mechanical
systems (MEMS), the continuous evolution in the
miniaturization and integration of sensor structures
and electronic circuits in the same chip, together
with recent advances in the field of biocompatible
materials have boosted the development of wearable
implantable medical devices .
Blood flow measurement represents one of the
most common procedures performed in hospitals for
the monitorization of cardiovascular diseases.
Recently, several implantable electronic devices
with both flow sensing and wireless communication
capabilities have been developed and tested, but
their power consumption, dimensions and long-term
reliability remain as unsolved constraints.
In this article, an initial model of a proposed
pulmonary artery flow sensing device is carried out
under several stenosed conditions. Section 1 presents
the definition of intelligent stent (e-stent) and its
impact on cardiovascular treatments. In Section 2,
different methods for blood flow measurement,
compatible with an implantable intelligent stent
design, are described. A simplified model of an
implantable device for pulmonary artery blood flow
measurement, based on pressure sensing, is
described in section 3. Different possible grades of
stenosis in the artery are simulated and presented in
order to obtain a first approximation of the device
behaviour under real conditions.
2 INTELLIGENT STENT
A stent is a bio-compatible flexible tube, made of
plastic or metal mesh, and designed to be implanted
in the human body during an angioplasty procedure.
A collapsed stent is mounted at the tip of the
catheter and then expanded in the site of an arterial
or venous blockage to push the vessel wall.
The impact of stents in modern cardiovascular
medicine has been enormous, reaching about 70% to
80% of all percutaneous coronary interventions
(PCI) (Lau, Johan, Sigwart and Hung, 2004),
significantly decreasing the total number of acute
complications in patients.
Unfortunately, the pressure applied by the
inflated balloon during an angioplasty procedure can
damage the vessel walls. Besides that, the patients’
body can respond using physiological repair
mechanisms, such as spasms, plaque deposition and
smooth muscle cells proliferation. In-stent restenosis
(ISR), defined as blood vessels narrowing due to
neointimal tissue growth inside an implanted stent,
keeps on being the major drawback in stent
implantation, seriously compromising its long-term
results. ISR has ratios from 10% to 70%, regarding
the nature of the disease (Hoffmann and Mintz,
2000). The introduction a drug-eluting stents, coated
with anti-proliferative drugs, has lowered the ISR
ratio to nearly 10% at the expense of higher cost and
long term reliability issues.
An intelligent stent (e-stent) that incorporates a
sensor capable of monitoring and transmitting real-
269
A. Miguel J., Mozuelos R. and Martinez M..
BEHAVIOURAL ANALYSIS OF AN IMPLANTABLE FLOW AND PRESSURE SENSING DEVICE.
DOI: 10.5220/0003873902690273
In Proceedings of the International Conference on Biomedical Electronics and Devices (BIODEVICES-2012), pages 269-273
ISBN: 978-989-8425-91-1
Copyright
c
2012 SCITEPRESS (Science and Technology Publications, Lda.)

time measurements of biological related parameters
for its clinical consultation can help to detect ISR.
The monitoring function is carried out through an
implantable sensor, which must fulfil certain
characteristics, like reduced dimensions, output
stability and reliability over an extended period of
time without recalibration, minimal invasiveness and
low power consumption and cost.
3 MEASUREMENT METHODS
Blood flow measurement is one of the most usual
techniques for monitoring various types of
cardiovascular diseases. There are three typical flow
measurement approaches compatible with intelligent
stent design, such as electromagnetic, ultrasonic and
pressure-based measurements.
3.1 Electromagnetic Flow
The stents with electromagnetic flow measurement
capability are based on a direct application of Hall-
effect. This effect is produced when an electrically
conductive fluid passes through an externally
applied magnetic field with a certain angle. Then,
the magnetic field exerts a transverse force on the
charge carriers in the flow, creating a voltage
difference perpendicular to the flow and to the
magnetic field itself. The magnitude of the voltage
measured by two diametrically opposed electrodes
attached to the vessel walls, is given by (Webster,
1999),
·cos·cos··
_
vBDV
MAXEM
(1)
Where D is the diameter of the blood vessel, B is the
magnetic flux density and v is the blood flow cross-
sectional mean velocity. The angles θ and φ,
represents the magnetic field alignment with the
flow and the generated electric field.
Electromagnetic flow-meters must overcome
some major drawbacks. First, a shift between the
actual positioning of the electrodes and the desired
diametrical line, due to a non-uniform expansion of
the angioplasty balloon, produces significant
deviations in blood flow measurements. Second,
these architectures present a strong dependence upon
the magnetic field orientation, so an efficient
correction method is needed (Takahata and
Gianchandani, 2006).
3.2 Ultrasound
Ultrasound flow measurement techniques are based
on a direct application of Doppler Effect. This
principle postulates that the frequency change
between an emitted sound wave and the received
one is proportional to the relative velocity between
the sound source and the observer. Doppler equation
can be applied to hemodynamic variables, like blood
flow, using the following expression (Webster,
1999),
cos
2
c
fv
f
T
(2)
Where v is the blood flow velocity, c is the
propagation velocity of the sound waves through
human body tissues, Δf is the Doppler frequency
shift, f
T
is the transmitted sound wave frequency and
θ is the angle between the axis of the emitted sound
wave and the direction of the blood flow.
This approach is the base for thoracic and
esophageal Ecocardiogram, commonly used
nowadays in hospital procedures.
Low frequency ultrasound waves present high
tissue penetration and low measurement resolution,
while high frequency ultrasonic waves have a better
resolution but are only able to scan the surface of the
tissue. This is why external ultrasound Doppler
blood-flow meters are incapable to reach deep inside
patient’s body without sacrificing the degree of
resolution in the measurements.
Devices bringing the ultrasound transmitter and
receiver closer to the blood vessel can avoid the
previous limitations, using an ultrasound frequency
high enough to allow good resolution (Wang and
Chen, 2011). However, it is necessary to overcome
important physical constraints to make this device
implantable. Among them we can point out the
determination of the angle between the probe and
the vessel and the amount of energy needed to
generate the ultrasound waveform and to process the
received signal.
3.3 Pressure
Blood flow velocity in an obstructed vessel can be
expressed as a function of the pressure gradient
between both sides of the stenosis. The general
expression can be written as (Young, 1983),
dt
dv
RvRvRP ···
3
2
21
(3)
Where ΔP is the pressure gradient between two
separate locations in a stented vessel, v is the mean
BIODEVICES 2012 - International Conference on Biomedical Electronics and Devices
270
cross-sectional flow velocity in the unobstructed
vessel and R
1
, R
2
and R
3
are coefficients that depend
on fluid properties and the geometry of the
obstruction. R
1
represents losses due to fluid
viscosity and it is directly related to the length of the
stenosis. R
2
represents nonlinear losses due to the
flow difference between downstream and upstream
locations and it is determined by the relationship
between the transversal un-stented area of the
obstructed vessel and its total area. R
3
is related to
fluid inertial effects, and can be neglected under
circumstances of severe stenosis (Young, 1983).
The simplest implantable version of the pressure
sensor is made of a capacitive MEMS to measure
blood pressure, and an inductance to form the LC
tank that transmits the information by proximity
coupling (Takahata, Gianchandani and Wise, 2006).
More elaborated systems incorporate electronic
circuits to process the information within the chip to
enhance the system performance (Chow,
Chlebowsky, Chakraborty, Chappell and Irazoki,
2010).
A pressure-based measurement allows the
integration of the sensor and the electronic circuits
in the same silicon substrate, decreasing the overall
cost of the system. The low energy requirements of
its components help to reduce the system size since
it can be powered by a wireless link. Moreover, this
approach provides the absolute pressure in the
vessel, providing additional information to carry out
the ISR monitorization.
4 ELECTRONIC SYSTEM
A simplified model of an implantable device for
pulmonary artery blood flow measurement based on
pressure sensing is described throughout this section.
Figure 1 shows the aforementioned model
description, to be implemented in the mathematical
program MatLab. Different possible grades of
stenosis in the artery will be simulated, by varying
R
1
and R
2
parameters, in order to obtain a first
approximation of the device behavior under real
conditions.
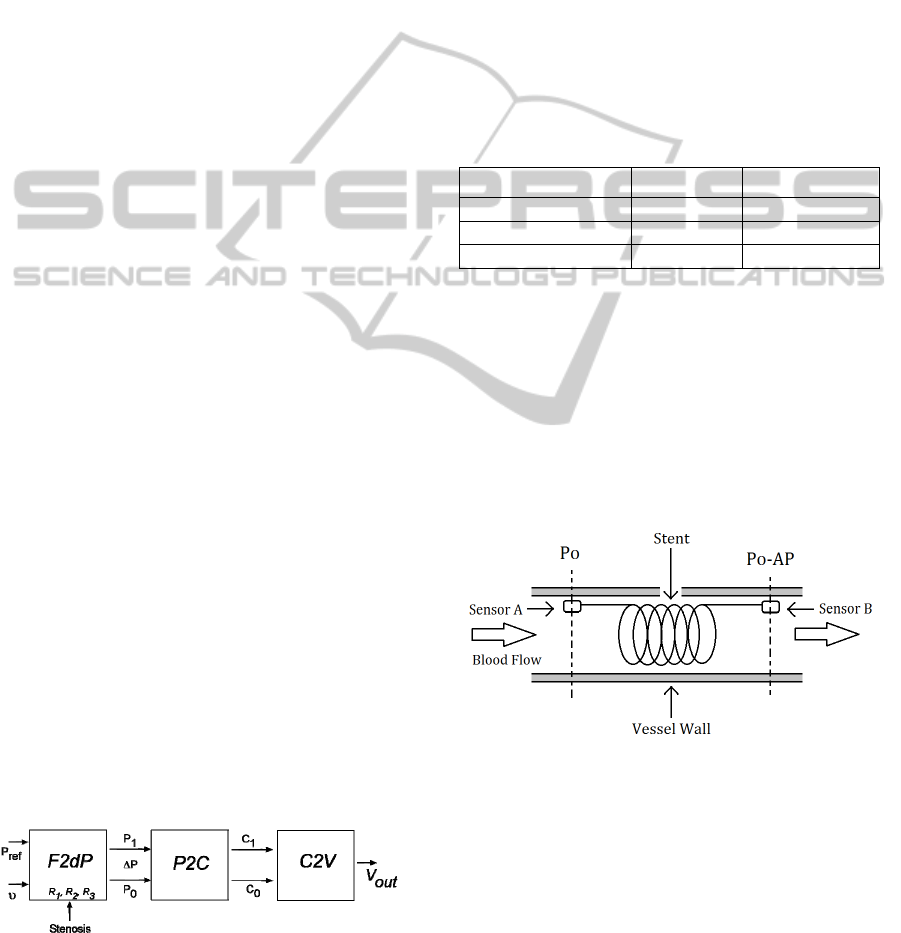
Figure 1: Simplified model of the electronic system.
The F2dP block performs the conversion from
blood flow to differential blood pressure in the
pulmonary artery using R
1
and R
2
parameters of eq.
3 to reflect the geometry of the stenosis. The
parameter’s values, as seen in Table 1, have been
taken from medical research publications regarding
the relationship between blood flow velocity and
pressure gradient in stenosed coronary arteries
(Marques, 2001). These values have been estimated
in an indirect way, by applying the arteries pressure
and blood flow measurements in the formula
described in eq. 3. However, stenosis shape can also
be correctly estimated with additional direct
procedures, such as angiographies and intravascular
ultrasonographies.
Table 1: Characteristics of the instantaneous flow velocity
and pressure gradient relationship (Marques, 2001).
R1 R2
Normal artery
0.032±0.018 0.00030±0.0049
Intermediate stenosis
0.15±0.11 0.0021±0.0014
Severe stenosis
2.67±1.58 0.0014±0.010
The F2dP block also takes into account the
absolute pressure in the heart side of the stent, in
order to provide two pressure waveforms whose
values represent the magnitudes to be measured by
the sensors placed at both sides of the stent. Figure 2
shows a simplified model of the device, focusing on
sensor placement inside the stented artery; where P
o
is the pressure in to the heart side of the stent and ΔP
is the difference of pressure measured between both
sensors.
Figure 2: Sensor placement and measures.
The P2C module emulates the behavior of a
capacitive MEM sensor, where the applied pressure
produces a deformation in a diaphragm that reduces
the chamber size, increasing the capacitance
between the two-plate structure. Figure 3 shows a
simplified cross-section of a MEMS capacitive
sensor, based on a deflecting diaphragm and a fixed
backplate; where P is the uniformly distributed
pressure applied, w
o
is the deflection of the
diaphragm center, t
g
is the undeflected gap between
BEHAVIOURAL ANALYSIS OF AN IMPLANTABLE FLOW AND PRESSURE SENSING DEVICE
271
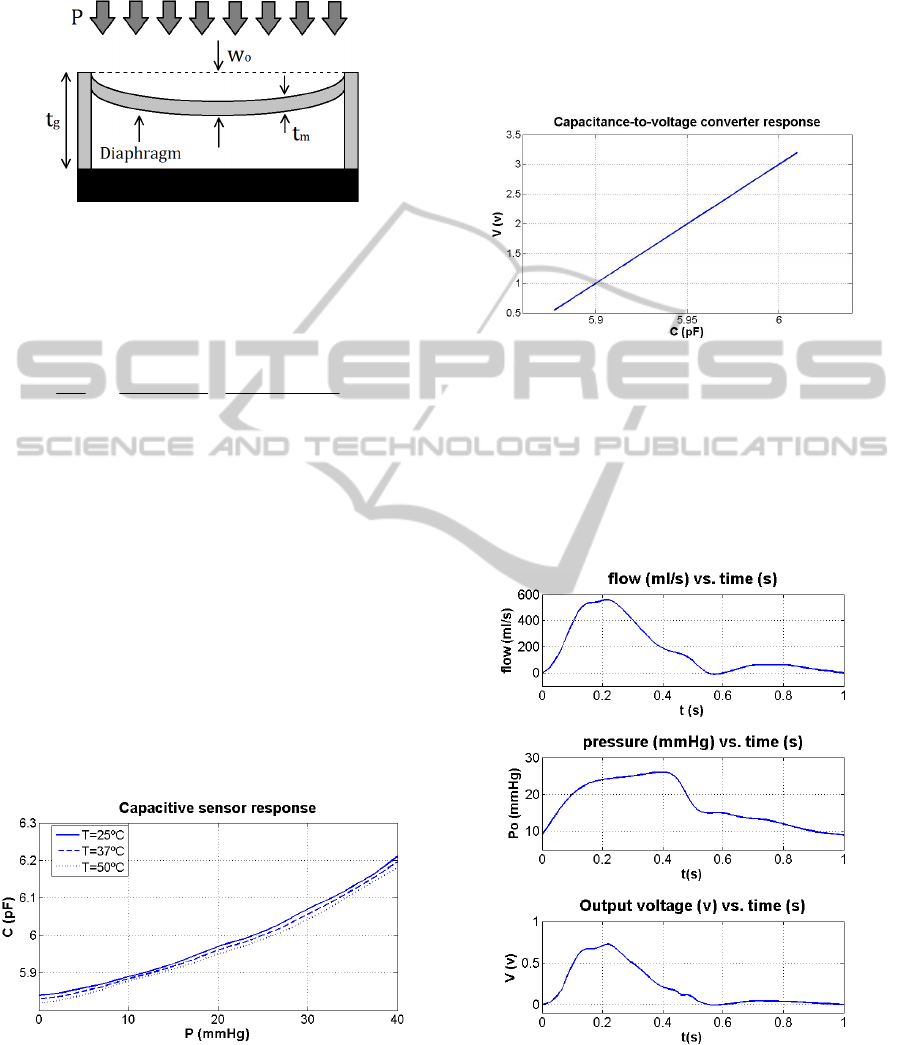
the diaphragm and the backplate and t
m
is the
thickness of the diaphragm.
Figure 3: MEMS pressure to capacitance transfer function.
The general expression regarding the relationship
between pressure and capacitance of a circular
diaphragm-based MEMS capacitive pressure sensor
can be written as (Chang, Lee and Allen, 2002),
26
2
2282
3
242
0
1280
)1(9
16
)1(
1
gmgm
g
ttE
aP
tEt
Pa
t
a
C
(4)
Where ε
0
is the dielectric permittivity of free space
and a, µ and E are the radius, the Poisson ratio and
the elasticity modulus of the diaphragm,
respectively.
The relationship between pressure and
capacitance of the actual pressure sensor, with an
average sensitivity of 9.1 fF/mmHg, is shown in
Figure 4. It can be seen that its pressure range has
been selected to fit the regular pulmonary artery
pressures, which ranges between 15 to 30 mmHg
during systole and 8 to 15 mmHg during diastole.
Moreover, the sensor must be able to measure even
higher pressure values, in order to be capable of
detecting pulmonary artery hypertension caused by
in-stent restenosis.
Figure 4: MEMS pressure to capacitance transfer function.
The last block C2V performs the conversion
from MEMS’ capacitance to an electric voltage,
reflecting the difference between the two measured
pressures and their absolute values. By this way, it is
possible to monitorize both the artery pressure and
the blood flow velocity, providing enough
information to make an early restenosis diagnosis.
The converter parameters have been selected to be
similar to the ones common to this class of
electronic circuits (Arfah, Alam and Khan, 2011),
and its response can be seen in Figure 5.
Figure 5: MEMS pressure to capacitance transfer function.
In this way, we can obtain a first approach to the
behavior of the electronic system. Figure 6 shows
the output voltage of the system (lower graph),
reflecting the differential pressure at both sides of
the stent when a blood flow signal (upper graph) and
a blood pressure signal (center graph) are applied to
a healthy artery (R
1
=0.032 and R
2
=0.0003).
Figure 6: Output voltage reflecting the measured
differential pressure under normal artery conditions.
This simplified model also allows to display the
mean value of the output voltage of the system for
different conditions of stenosis (R
1
and R
2
sweep)
BIODEVICES 2012 - International Conference on Biomedical Electronics and Devices
272

when reference waveforms of blood flow and
pressure are considered (Figure 7). As can be seen,
higher R
1
and R
2
magnitudes produce higher
pressure gradient along the stenosis, reflected in an
increased output voltage. In a similar way, as
expressed in eq. 3 formula, worse obstruction
conditions produce higher pulmonary artery
pressures, as expected according to medical reports
about stenosed arteries (Rothman, Perry, Keane and
Lock, 1990).
Figure 7: Output mean value of the system for R
1
and R
2
parameter sweep.
5 CONCLUSIONS
For the last forty years, several implantable
electronic devices with flow sensing and wireless
communication capabilities have been developed
and tested, but their power consumption, dimensions
and long-term reliability in such a hostile
environment as human body remain as unsolved
drawbacks. For this reason, a simplified model of an
implantable device for pulmonary artery blood flow
measurement based on pressure sensing has been
developed. This kind of devices present some
important advantages, such as its dual pressure and
blood flow velocity sensing capabilities, together
with an improved robustness and reliability
compared with the rest of the analyzed measurement
methodologies. Finally, different possible grades of
stenosis in the artery have been simulated, by
varying the obstruction geometry parameters
between ranges reported by medical studies, in order
to obtain a first approximation of the device
behaviour under real conditions.
REFERENCES
Lau, K. W., Johan, A., Sigwart, U., Hung, J. S., (2004). A
stent is not just a stent: stent construction and design
do matter in its clinical performance. Singapore Med.
J., 45(7), 305-311.
Hoffmann, R., Mintz, G. S., (2000). Coronary in-stent
restenosis - predictors, treatment and prevention.
European Heart Journal, 21, 1739-1749.
Webster, J. G., (1999). The Measurement, Instrumentation
and Sensors Handbook. Boca Raton, FL: CRC Press.
Takahata, K., Gianchandani, Y. B., Wise, K. D., (2006).
Micromachined Antenna Stents and Cuffs for
Monitoring Intraluminal Pressure and Flow. Journal of
Microelectromechanical Systems, 15(5), 1289-1298.
Wang, M., Chen, J., (2011). Volumetric Flow
Measurement Using an Implantable CMUT Array.
IEEE Transactions on Biomedical Circuits and
Systems, 5(3), 214-222.
Young, D. F., (1983). Some factors affecting pressure-
flow relationships for arterial stenoses. ASME Conf.
Appl. Mech. Bioeng. Flu. Eng., 87-90.
Chow, E. Y., Chlebowski, A. L., Chakraborty, S.,
Chappell, W. J., Irazoqui, P. P., (2010). Fully Wireless
Implantable Cardiovascular Pressure Monitor
Integrated with a Medical Stent. IEEE Transactions on
Biomedical Engineering, 57(6), 1487-1496.
Marques, K. M. J., (2008). Combined flow and pressure
measurements in coronary artery disease. Amsterdam:
Vrije Universiteit.
Chang, S.-P., Lee, J.-B. and Allen, M. G., (2005). Robust
capacitive pressure sensor array. Sensors and
Actuators A: Physical, 101, 231-238.
Arfah, N., Alam, A. H. M. Z., Khan, S., (2011).
Capacitance-to-Voltage Converter for Capacitance
Measuring System. 4th International Conference on
Mechatronics (ICOM), 1-4.
Rothman, A., Perry, S. B., Keane, J. F. and Lock, J. E.,
(1990). Early results and follow-up of balloon
angioplasty for branch pulmonary artery stenoses.
Journal of the American College of Cardiology, 15(5),
1109-1117.
BEHAVIOURAL ANALYSIS OF AN IMPLANTABLE FLOW AND PRESSURE SENSING DEVICE
273
