
HAPLOTYPE-BASED CLASSIFIERS TO PREDICT INDIVIDUAL
SUSCEPTIBILITY TO COMPLEX DISEASES
An Example for Multiple Sclerosis
Mar´ıa M. Abad-Grau
1
, Nuria Medina-Medina
1
, Andr´es Masegosa
2
and Seraf´ın Moral
2
1
Departamento de Lenguajes y Sistemas Inform´aticos, CITIC, Universidad de Granada, Granada, Spain
2
Departamento de Ciencias de la Computaci´on e Inteligencia Artificial, CITIC, Universidad de Granada, Granada, Spain
Keywords:
Genetic predictive model, Genome-wide search, Haplotype risk.
Abstract:
The enormous amount of genetic data that is currently being produced with the explosion of genome-wide
association studies is yielding an important effort in the construction of genetic-based predictive models for
individual susceptibility to complex diseases. However, a constant pattern of low accuracy is observed in most
of them. We hypothesize that a main cause of their low accuracy is the strong reduction of genetic information
considered by the classifiers, and propose a three-fold solution that considers haplotype instead of genotype
individual data, whole-genome markers instead of a more stringent selection and several-marker risk variants
instead of only one or two. We have compared the performance of our approach with current approaches to
predict individual genetic risk to multiple sclerosis, and have found that our method yielded significantly more
accurate classifiers.
1 INTRODUCTION
Building genetic-based risk models to predict individ-
ual susceptibility to a complex trait is a challenging
problem that nowadays can be tackled for some com-
plex diseases as more and more data from genome-
wide association studies (GWAS) are available. How-
ever, predictive accuracy from current models seems
to be very low, considering the role that genetic plays
in some diseases, such as diabetes or autoimmune dis-
eases (Wray et al., 2007; Evans et al., 2009). The very
little success obtained so far may help to explain a
lack in clinical application of these predictivemodels.
Most of these genetic-based predictive model use a
genetic risk score (GRS). There are two main modal-
ities of a GRS. One is an unweighted GRS defined
as the sum of all the allele risk variants (x
i
, i = 1..n)
an individual has: GRS(x) =
∑
n
i=1
x
i
, with n being the
number of genetic risk positions and x
i
being a three-
value variable representing the genotype of an indi-
vidual at position i, i.e. the number of risk variants
(0, 1 or 2) the individual may have at this position. By
considering h
i
a binary variable representing the two
different alleles at a given position i, x
i
= h
i1
+ h
i2
holds for every i = 1..n, with h
i1
and h
i2
being respec-
tively the two alleles making up the genotype x
i
for an
individual at position i. The other modality is a more
accurate weighted GRS whose weights are computed
as the logarithm of odds ratio at each risk position:
wGRS(x) =
∑
n
i=1
w
i
x
i
, with
w
i
= lnOR
i
= ln
p(D | h
i
= 1)
p(
¯
D | h
i
= 1)
p(
¯
D | h
i
= 0)
p(D | h
i
= 0)
. (1)
where D and
¯
D indicate an individual having or not
having the disease, respectively, and h
i
refers to any
of the two alleles.
As an example to predict multiple sclerosis (MS)
susceptibility, two different models using a weighted
GRS (wGRS) have been recently published (Jager
et al., 2009; Wang et al., 2011). The ability of the
first of the models (Jager et al., 2009), composed of
only 16 MS susceptibility loci as independent vari-
ables, to discriminate between affected and control
individuals –C statistic or area under the receiver op-
erating characteristic curve (AUC)–, was 0.64 in two
different replication data sets of MS. In the second
work (Wang et al., 2011), AUC rose from 0.68 to
0.769 in the replication data set when the model in-
creased the number of independent variables from 16
to 350 genes. Still predictive capacity is too low for
the model to be used for a clinical purpose. In both
works, and in others performed for other complex dis-
eases (Wray et al., 2007; Evans et al., 2009), AUC and
360
M. Abad-Grau M., Medina-Medina N., Masegosa A. and Moral S..
HAPLOTYPE-BASED CLASSIFIERS TO PREDICT INDIVIDUAL SUSCEPTIBILITY TO COMPLEX DISEASES - An Example for Multiple Sclerosis.
DOI: 10.5220/0003874003600366
In Proceedings of the International Conference on Bioinformatics Models, Methods and Algorithms (BIOINFORMATICS-2012), pages 360-366
ISBN: 978-989-8425-90-4
Copyright
c
2012 SCITEPRESS (Science and Technology Publications, Lda.)

accuracy (sensitivity and specificity) are always mea-
sured for case/control data sets.
The clinical situation highly departs from a
case/control study, in which controls may have a very
low number of risk loci and cases a very high number
of risk loci while in the clinic, relatives of affected in-
dividuals may have a larger number of risk loci even
if they are still not large enough to develop the dis-
ease. To differentiate these healthy individuals from
affected ones is a much more challenging task worth
for clinical purposes that is still an open research
problem. Therefore in most of the cases, the popula-
tion prone to need a test consists of individuals, may
be newborns, with a relative having a complex dis-
ease, for whom it may be worth to know their disease
susceptibility. It has to be noted, that the closer the re-
lationship with the relative, the more specific the pre-
dictor has to be to avoid false positives. A data set that
may resemble more accurately to this population is a
familial trio data set with affected offspring and, usu-
ally unaffected, parents. We focused on MS, a com-
plex disease whose genetic component is important,
as there are 30% pairwise concordance for monozy-
gotic twins (Kuusisto et al., 2008) but only 14.3% in
dizygotic twins. Although there have not been many
GWAS conducted on trio data sets because of the high
costs required compared with case/control samples,
we have been able to use genotype data from MS
GWAS performed on 931 nuclear families ((IMSGC),
2010).
To build a clinically-usable predictive model for
a complex disease from genome-wide data sets is a
huge challenge because many loci with different rel-
ative risks may be involved in a complex disease and
the environment also interacts with genetics for the
final outcome. Therefore, in the construction of a
predictive model, i.e., a classifier able to ascertain
whether an individual will develop a complexdisease,
all their components must be carefully chosen.
In this paper we present results obtained when us-
ing as a risk predictor one based on the wGRS, the
best of the current approaches, and show its inability
to distinguish between healthy parents and affected
offspring. Our conjecture to explain the lack of accu-
racy is that current approaches disregard genetic in-
formation by (1) only considering genotypes instead
of haplotypes so that they have to use a rough infer-
ence mechanism imposed by the use of genotype data,
(2) filtering loci so that only those with higher relative
risk to the disease are chosen and (3) using too sim-
ple loci with only one or two simple nucleotide poly-
morphism (SNP) so that marker dependencies are ig-
nored.
For those models trying the difficult task of
predicting susceptibility of complex diseases using
genome data, reason (1) is enough of a reason to ex-
plain their low accuracy. As a consequence of using
genotypes they have to use a rough inference mech-
anism that yields models with a low predictive ca-
pacity. By using haplotypes, we can improve the in-
ference mechanism so that we can assume a reces-
sive genetic model between haplotypes, which is the
genetic model on which the powerful transmission-
disequilibrium test (TDT) and their multimarker ex-
tensions rely on (BickeB¨oller and Clerget-Darpoux,
1995; Sham and Curtis, 1995; Abad-Grau et al., 2010;
Zhang et al., 2003; Yu et al., 2005; Sevon et al., 2006;
Moreno-Ortega et al., 2011). In addition, by filtering
loci (2) we disregard those ones with a small effect on
a polygenic disease ((IMSGC), 2010) but that may be
relevant for some individuals, so that sensitivity will
decrease.
In the last instance, it is well-known that multi-
marker haplotype-based association tests (Yu et al.,
2005; Abad-Grau et al., 2010) usually provide a
higher power than monomarker tests as in many cases
only one marker is not enough to tag a gene variant or
to capture a non-recombinant variant in linkage with
it. Therefore, (3) may be another reason for its low
accuracy.
In this work we also develop an strategy to face
these three issues. Section 2 details this strategy so
that the three issues above mentioned are handled. In
Section 3 we show how only by using this three-fold
strategy, the predictive accuracy increases enough for
the predictor to be clinically-usable. Conclusions are
written in Section 4.
2 METHODS
We first describe the current state-of-the-art solutions
(Wray et al., 2007; Evans et al., 2009; Jager et al.,
2009) (Section 2.1). We later explain the first strategy
in our solution: to use haplotypes instead of geno-
types (section 2.2) and the analytical relationship be-
tween the two approaches (Section 2.3). Finally we
provide a description of the way our approach goes
beyond the above-mentioned simplifications (2) and
(3) made by the current approaches (Section 2.4).
2.1 Currently used Predictive Models
The most widely-used approach is based on the use of
genotypes and the wGRS from which a simple logis-
tic regression model (Wang et al., 2011) is defined:
HAPLOTYPE-BASED CLASSIFIERS TO PREDICT INDIVIDUAL SUSCEPTIBILITY TO COMPLEX DISEASES - An
Example for Multiple Sclerosis
361

lnO(x) = ln
p(D | x)
1− p(D | x)
= α
0
+ α
1
wGRS(x). (2)
In terms of AUC, a classification rule based on
a Naive Bayes classifier (NBC) (Domingos and Paz-
zani, 1997) has been shown to be equivalent to a clas-
sification rule based on a wGRS logistic regression
(Equation 2) and any choice of parameters α
0
and α
1
(Sebastiani and Solovieff, 2011), i.e. this relationship
is independent of the regression coefficients.
We now show that under the assumption of inde-
pendent loci given the disease outcome, an assump-
tion that yields the NBC, and by considering that
h
ij
, j = 1, 2 are indentically distributed and are con-
ditionally independent given D, α
NBC
1
= 1 and α
NBC
0
is:
α
NBC
0
= ln
p(D)
1− p(D)
+ 2
n
∑
i=1
ln
p(h
i
= 0 | D)
p(h
i
= 0 |
¯
D)
, (3)
which becomes
α
NBC
0
= 2
n
∑
i=1
ln
p(h
i
= 0 | D)
p(h
i
= 0 |
¯
D)
, (4)
whenever p(D) = 1− p(D).
In effect, under the assumption made by NBC, the
odds of the risk of a genome-wide genotype x turns
out to be:
O
NBC
(x) =
p(D | x)
1− p(D | x)
NBC
=
p(D)
1− p(D)
n
∏
i=1
p(x
i
| D)
p(x
i
|
¯
D)
=
p(D)
1− p(D)
n
∏
i=1
p((h
i1
+ h
i2
) | D)
p((h
i1
+ h
i2
) |
¯
D)
. (5)
If I
k
(x
i
) is the indicator function (i.e I
k
(x
i
) is equal
to 1/0 whether x
i
is equal to k or not respectively) and
by considering that h
ij
are identically distributed and
are conditionally independent given D, then the fol-
lowing expression holds:
lnO
NBC
(x) = ln
p(D)
p(
¯
D)
+
n
∑
i=1
I
0
(x
i
)2ln
p(h
i
= 0 | D)
p(h
i
= 0 |
¯
D)
+
n
∑
i=1
I
1
(x
i
)ln
p(h
i
= 0 | D)
p(h
i
= 0 |
¯
D)
+
n
∑
i=1
I
1
(x
i
)ln
p(h
i
= 1 | D)
p(h
i
= 1 |
¯
D)
+
n
∑
i=1
I
2
(x
i
)2ln
2p(h
i
= 1 | D)
2p(h
i
= 1 |
¯
D)
= ln
p(D)
p(
¯
D)
+ 2
n
∑
i=1
ln
p(h
i
= 0 | D)
p(h
i
= 0 |
¯
D)
−
n
∑
i=1
x
i
ln
p(h
i
= 0 | D)
p(h
i
= 0 |
¯
D)
+
n
∑
i=1
x
i
ln
p(h
i
= 1 | D)
p(h
i
= 1 |
¯
D)
= ln
p(D)
p(
¯
D)
+ 2
n
∑
i=1
ln
p(h
i
= 0 | D)
p(h
i
= 0 |
¯
D)
+
n
∑
i=1
x
i
ln
p(
¯
D | h
i
= 0)
p(D | h
i
= 0)
p(D | h
i
= 1)
p(
¯
D | h
i
= 1),
(6)
being the first two addends the intercept α
NBC
0
and
the last one the weighted genetic risk score wGRS(x),
so that the coefficient α
NBC
1
= 1.
A simpler genotype-based approach assumes
α
1
= 1 and α
0
= 0 (Jager et al., 2009).
We compared both models with our haplotype-
based absolute-risk recessive model approach ex-
plained below. To avoid zero probability values be-
cause of small sample sizes, we estimated probabili-
ties p(D) and p(h
i
), i = 1..n by using a Bayesian esti-
mator, and considered a discrete uniform distribution
with n = 1 as the prior distribution for all of them, in
all the approaches.
2.2 Strategy 1: Haplotype-based
Absolute-risk Recessive Model
We performed two modifications to the simple logis-
tic regression model: a haplotype-based approach in-
stead of a genotype-based approach and a recessive
model on the absolute risk of the genome-wide haplo-
types instead of a multiplicativemodel of the genome-
wide haplotypes on the odds of the disease.
2.2.1 Haplotype-based Approach
We will first introduce the concept of genetic risk
score of an haplotype (hwGRS), i.e. the relative risk
score of the genetic material the individual inherits
from only one of their two parents:
hwGRS(h
j
) =
n
∑
i=1
w
i
h
ij
, j = 1, 2. (7)
The relationship between the two haplotype-based
scores and the genetic score of an individual is:
wGRS(x) = hwGRS(h
1
) + hwGRS(h
2
)
=
n
∑
i=1
w
i
(h
i1
+ h
i2
) =
n
∑
i=1
w
i
h
i1
+ w
i
h
i2
, (8)
with h
i1
and h
i2
being the two haplotypes making up
the individual’s genotype x
i
.
The odds for the disease are computed indepen-
dently for each of the two genome-wide haplotypes,
h
1
, h
2
, the genome-wide genotype x of an individual
has:
lnO(h
j
) = ln
p(D | h
j
)
1− p(D | h
j
)
= α
h
0
+ α
h
1
hwGRS(h
j
),
(9)
j = 1, 2.
BIOINFORMATICS 2012 - International Conference on Bioinformatics Models, Methods and Algorithms
362

As it has been done for the genotype-based ap-
proach, the intercept α
h
0
and α
h
1
were computed by
assuming loci are independent given the disease out-
come (i.e. by using NBC). Under this assumption,
and in the case of window size of 1, it is straightfor-
ward to show that α
NBCh
1
= 1 and
α
NBCh
0
= ln
p(D)
1− p(D)
+
n
∑
i=1
ln
p(h
i
= 0 | D)
p(h
i
= 0 |
¯
D)
, (10)
which becomes
α
NBCh
0
=
n
∑
i=1
ln
p(h
i
= 0 | D)
p(h
i
= 0 |
¯
D)
, (11)
whenever p(D) = 1− p(D).
The relationship between the haplotype odds and
the genotype odds for the disease is:
lnO
NBC
(x) = lnO
NBCh
(h
1
) + lnO
NBCh
(h
2
) − ln
p(D)
1− p(D)
,
(12)
and it becomes
lnO
NBC
(x) = lnO
NBCh
(h
1
) + lnO
NBCh
(h
2
) (13)
whenever p(D) = 1− p(D).
2.2.2 Absolute-risk Models
However, our proposal also changes the inference
procedure, so that the odds of the disease an individ-
ual has is not computed as the product of the odds for
each haplotype, as it occurs in the commonly used ap-
proaches. In those approaches,the absolute individual
risk is computed by assuming a multiplicative effect
on the odds of each haplotype (see Equation 12):
p(D | h
1
)
1− p(D | h
1
)
p(D | h
2
)
1− p(D | h
2
)
p(D)
1− p(D)
. (14)
In the case p(D) = 1− p(D) holds it will become:
O(X) =
p(D | x)
1− p(D | x)
= O(h
1
)O(h
2
) =
p(D | h
1
)
1− p(D | h
1
)
p(D | h
2
)
1− p(D | h
2
)
. (15)
The main problem of this approach is that the odds
of the disease for an individual with genotype x only
considers the odds of having the two genome-wide
haplotypes being high-risk haplotypes versus being
low-risk haplotypes but it is disregarding those cases
in which the genotype may have one high risk haplo-
type and other low risk haplotype.
Instead of that, we apply the genetic model on the
absolute individual risks, as we are assessing the ab-
solute individual risk in order to infer individual dis-
ease susceptibility. Depending on the genetic model
assumed between haplotypes (recessive, additive and
dominant) we have defined three different modalities
explained below.
Absolute-risk Recessive Model. Therefore, as-
suming a recessive effect on the haplotype risks, i.e.
the same assumption done by the TDT so that the
two genome-wide haplotypes have to be considered
of high risk for the individual to be at risk:
p(D | x) = p(D | h
1
)p(D | h
2
) (16)
so that we compute:
p(D | x)
1− p(D | x)
=
p(D | h
1
)p(D | h
2
)
1− p(D | h
1
)p(D | h
2
).
(17)
Absolute-risk Additive Model. Other genetic
model assumptions is the additive model, which
means
p(D | x)
1− p(D | x)
=
p(D | h1) + p(D | h2)
1− p(D | h1) − p(D | h2)
. (18)
Absolute-risk Dominant Model. Under the domi-
nant model, in which at least one high risk haplotype
is required to have the disease,
p(D | x) = p(D | h
1
)p(D | h
2
)
+p(
¯
D | h
1
)p(D | h
2
)
+p(D | h
1
)p(
¯
D | h
2
)
(19)
and thus
p(D|x)
1−p(D|x)
is computed as
p(D | h
1
)p(D | h
2
)
+p(
¯
D | h
1
)p(D | h
2
)
+p(D | h
1
)p(
¯
D | h
2
)
p(
¯
D | h
1
)p(
¯
D | h
2
)
. (20)
In our experiments, we only used the recessive
model, as it is the model on which TDT relies on and
the test has been proved to be very powerful to de-
tect association loci in several GWAS conducted on
polygenic diseases, including MS.
2.3 Analytical Relationship between
Genotype-based Classifiers and
Haplotype-based Classifiers
In order to reduce computation time, we have an-
alytically assessed the relationship between the es-
timation of individual risk made by the state-of-
the-art genotype-based classifier (p
G
(D | x)) and by
our haplotype-based classifier (p
H
(D | x)), under the
HAPLOTYPE-BASED CLASSIFIERS TO PREDICT INDIVIDUAL SUSCEPTIBILITY TO COMPLEX DISEASES - An
Example for Multiple Sclerosis
363

assumption of conditional independence made by
NBC. Therefore, we will compute both of them from
the haplotype-based weighted GRS (hwGRS) defined
above.
2.3.1 Genotype-based Predictors built from the
Haplotype-based and Weighted hwGRS
By considering Equation 12, it is straightforward to
show that
p
G
(D | x) =
1
1+ e
−lnO
NBC
(x)
=
1
1+ e
−α
NBC
0
−wGRS(x)
=
1
1+ e
−α
NBC
0
−hwGRS(h
1
)−hwGRS(h
2
)
=
1
1+ e
−lnO
NBC
(h
1
)−lnO
NBC
(h
2
)+ln
p(D)
p(
¯
D)
, (21)
with
α
NBC
0
= 2
n
∑
i=1
ln
p(x
i
= 0 | D)
p(x
i
= 0 |
¯
D)
+ ln
p(D)
1− p(D)
.
In the situation p(D) = 1− p(D), it becomes:
1
1+ e
−lnO
NBC
(h
1
)−lnO
NBC
(h
2
)
. (22)
In the situation of no intercept, the risk is esti-
mated as:
p
G
(D | x) =
1
1+ e
−lnO
NBC
(x)
=
1
1+ e
−wGRS(x)
=
1
1+ e
−hwGRS(h
1
)−hwGRS(h
2
)
. (23)
2.3.2 The Haplotype-based Predictor built from
the Haplotype-based and Weighted
hwGRS
As explained above, the individual predictive model
was defined by assuming a recessive genetic model,
i.e. a multiplicative effect of the haplotype risks
(Equation 17) and therefore by combining them to ob-
tain the individual risk. An individual-risk classifier
has a binary class representing whether the individ-
ual has the disease. The final score p(D | x) repre-
sents the probability for an individual susceptibility
to MS and is obtained by computing the joint proba-
bility for an individual of having both high risk haplo-
types. We computed the probability of having the two
high risk haplotypes because TDT assumes that both
haplotypes in affected individuals are high risk haplo-
types while in unaffected parents, only one haplotype
is a high risk haplotype.
p
H
(D | x) = p(D | h
1
)p(D | h
2
)
=
1
1+ e
−α
NBCh
0
−hwGRS(h
1
)
1
1+ e
−α
NBCh
0
−hwGRS(h
2
)
=
1
1+ e
−lnO
NBC
(h
1
)
1
1+ e
−lnO
NBC
(h
2
)
(24)
with
α
NBCh
0
=
n
∑
i=1
ln
p(h
i
= 0 | D)
p(h
i
= 0 |
¯
D)
+ ln
p(D)
1− p(D)
. (25)
2.4 Strategies 2 and 3: Multimarker
Variables and Loci Selection
Instead of considering single markers, we tested the
three approaches by grouping consecutive markers
into binary variables (low and high risk) so that each
variant is coded as high or low risk by using the
2G algorithm (Abad-Grau et al., 2011). 12 dif-
ferent amounts of consecutive markers were tried:
1, 2, 5, 10, 15, 20, 25, 30, 40, 50, 100, 150. To test the
effect of loci selection (strategy 3), we performed dif-
ferent levels of loci filtering, by imposing different
upper-limits in the p-value (0.8, 0.6, 0.4, 0.2, 0.15,
0.1, 0.050, 1e-2, 1e-3, 1e-4, 1e-5, 1e-6, 1e-7) ob-
tained by the multimarker TDT mTDT
2G
(Abad-Grau
et al., 2011), which measures whether there are sig-
nificant differences in the amount of high risk hap-
lotypes that are transmitted to the affected offspring
compared with those non-transmitted ones.
Therefore TDT
2G
was applied along the genome
by using sliding windows with the 12 different con-
figurations of window sizes and offset of 1 and the 13
p value upper limits above mentioned. By combining
the 12 different window sizes, the 13 different p value
upper limits and the three approaches compared we
produced12×13×3 predictivemodels. Since our ap-
proach was based on haplotypes and the relationship
between haplotype-based and genotype-based odds in
the current approaches has been established above,
we estimated as a first step the log odds for each
genome-wide haplotype. We considered as high/low
risk genome-wide haplotypes those that were trans-
mitted/not transmitted to the offspring (the 22 auto-
some transmitted/non-transmitted chromosomes).
In a second step, the log odds for each genome-
wide homologous chromosome of an individual were
combined in order to estimate the individual risk
p(D | x) by considering
p(D | x) =
1
1+ e
−lnO(x)
(26)
holds in a logistic regression model, being O(x) the
odds of D | x, and the way each of the methods work.
Once individual predictive models were built, we
used them to measure their generalization capacity,
BIOINFORMATICS 2012 - International Conference on Bioinformatics Models, Methods and Algorithms
364
i.e., how accurate would be a model when used in a
different data set. To encode, in a replication data set,
whether a haplotype at a given sliding window was a
high (1) or low (0) risk one, we computed the sim-
ilarity between it and every haplotype in the list of
high risk and low risk haplotypes for the correspond-
ing sliding window in the training data set. There-
fore, we classified it as 1 or 0 depending on whether
the closest haplotype belonged to the set of high or
low risk haplotypes respectively. For the similarity
measure we used the length measure (Tzeng et al.,
2003), which computes the largest number of consec-
utive matching alleles.
3 RESULTS
We computed the training and predictive accuracies
and C-statistics (AUC) for all the individual-risk pre-
dictive models built using the 13 different p-value up-
per limits and 12 different window sizes. Predictive
accuracies and AUCs are results obtained when differ-
ent independent data sets are used to learn the model
and to predict risk. We randomly selected 500 family
trios as the training data set and the remaining 431 as
the test data set.
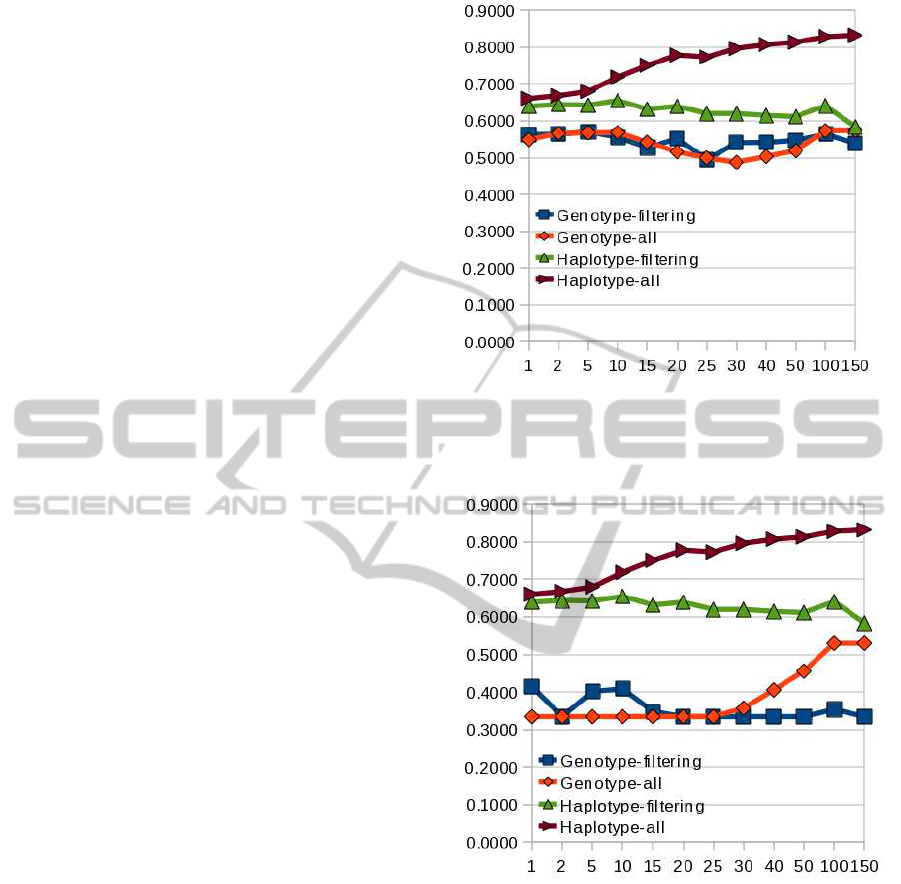
Results (predictive accuracy) shown in Figure 1
compares results between our approach (values at the
right side of the ”Haplotype-all” and brown line) and
the standard multiplicative genotype-based model us-
ing wGRSs (”Genotype-filtering” and blue line). The
current approach is not able to perform a good predic-
tion and neither did it succeed when we applied only
the strategy of no genetic filtering (”Genotype-all”
and orange line). However, we found a substantial
accuracy increase when trying the three-fold strategy
at a time consisting on a recessive haplotype-based
model with no filtering and large multimarker vari-
ables (values at the right side of the ”Haplotype-all”
and brown line) instead of shorter multimarker vari-
ables or single marker variables (values at the left
side), or risk-based filtering (”Haplotype-filtering”
and green line) alone. We used NBC to build all the
models. To make sure that the haplotype-based strat-
egy was crucial for the results obtained, we randomly
flipped positions and found an AUC decay to values
around 0.5 (data not shown). Figure 2 compares re-
sults between our approach and the standard multi-
plicative genotype-based model using wGRSs and no
intercept. With this plot we wanted to check whether
the intercept is important for the outcome and, as it
can be seen in the plot, accuracy is lower than when
using the intercept (Figure 1).
Figure 1: Accuracy (y-axis) of genetic predictors for dif-
ferent sizes of multimarker variables (x-axis). Comparison
between our approach and other logistic regression models
using the intercept.
Figure 2: Accuracy (y-axis) of genetic predictors for dif-
ferent sizes of multimarker variables (x-axis). Comparison
between our approach and other logistic regression models
disregarding the intercept.
4 CONCLUSIONS
These results shed light on the challenging task of
building predictive models of individual genetic risk
in complex diseases. Using allelic association be-
tween SNPs, a recessive genetic model and several
markers at a time seem to be all essential to obtain a
disease predictor enough accurate to be used in the
clinic. However, this is only a first step in a new
direction in the search of genome-wide predictors of
HAPLOTYPE-BASED CLASSIFIERS TO PREDICT INDIVIDUAL SUSCEPTIBILITY TO COMPLEX DISEASES - An
Example for Multiple Sclerosis
365

complex diseases. New wet-lab or in-silico methods
to accurately reconstruct very long haplotypes instead
of using the expensivenuclear family data sets haveto
be defined. Moreover, the method needs to be tested
in other polygenic diseases.
ACKNOWLEDGEMENTS
The authors were supported by the Spanish Research
Program under project TIN2010-20900-C04, the An-
dalusian Research Program under project P08-TIC-
03717 and the European Regional Development Fund
(ERDF). The authors thank Paola Sebastiani for her
help in the work undertaken.
REFERENCES
Abad-Grau, M., Medina-Medina, N., Montes-Soldado, R.,
Matesanz, F., and Bafna, V. (2011). Sample repro-
ducibility of genetic association using different multi-
marker tdts in genome-wide association studies: Char-
acterization and a new approach. PLoS ONE, ac-
cepted.
Abad-Grau, M., Medina-Medina, N., Montes-Soldado, R.,
Moreno-Ortega, J., and Matesanz, F. (2010). Genome-
wide association filtering using a highly locus-specific
transmission/disequilibrium test. Human Genetics,
128:325–44.
BickeB¨oller, H. and Clerget-Darpoux, F. (1995). Statis-
tical properties of the allelic and genotypic trans-
mission/disequilibrium test for multiallelic markers.
Genet Epidemiol, 12:865–70.
Domingos, P. and Pazzani, M. (1997). On the optimality
of the simple bayesian classifier under zero-one loss.
Machine Learning, 29:103–37.
Evans, D., Visscher, P., and Wray, N. (2009). Harness-
ing the information contained within genome-wide as-
sociation studies to improve individual prediction of
complex disease risk. Human Molecular Genetics,
18:3525–31.
(IMSGC), I. M. S. G. C. (2010). Evidence for poly-
genic susceptibility to multiple sclerosis - the shape
of things to come. Am J Hum Genet, 86:621–5.
Jager, P. D., Chibnik, L., Cui, J., Reischl, J., Lehr, S., Si-
mon, K., Aubin, C., Bauer, D., Heubach, J., Sand-
brink, R., Tyblova, M., Lelkova, P., ’Steering com-
mittee of the BENEFIT study, committee of the BE-
YOND study’, S., committee of the LTF study’, S.,
committee of the CCR1 study’, S., E, E. H., Pohl, C.,
Horakova, D., Ascherio, A., Hafler, D., and Karlson.,
E. (2009). Integration of genetic risk factors into a
clinical algorithm for multiple sclerosis susceptibil-
ity: a weighted genetic risk score. Lancet Neurol.,
8(12):1111–9.
Kuusisto, H., Kaprio, J., Kinnunen, E., Luukkaala, T.,
Koskenvuo, M., and Elovaara, I. (2008). Concor-
dance and heritability of multiple sclerosis in finland:
study on a nationwide series of twins. Eur J Neurol.,
15(10):1106–10.
Moreno-Ortega, J. J., Medina-Medina, N., Montes-
Soldado, R., and Abad-Grau, M. M. (2011). Improv-
ing reproducibility on tree based multimarker meth-
ods: Treedth. In Rocha, M., Corchado, J., Fern´andez-
Riverola, F., and Valencia, A., editors, PACBB ’11:
Proceedings of the 5th International Conference on
Practical APplications of Computational Biology and
Bioinformatics, volume 1, pages 1–8, Berlin, Heidel-
berg. Springer-Verlag.
Sebastiani, P. and Solovieff, N. (2011). Nave bayesian clas-
sifier and genetic risk score for genetic risk prediction
of a categorical trait: Not so different after all! sub-
mitted.
Sevon, P., Toivonen, H., and Ollikainen, V. (2006). Treedt:
Tree pattern mining for gene mapping. IEEE/ACM
Trans. Comput. Biol. Bioinf., 3(2):174–85.
Sham, P. C. and Curtis, D. (1995). An extended transmis-
sion/disequilibrium test (tdt) for multiallelic marker
loci. Annals of Human Genetics, 59:323–336.
Tzeng, J., Devlin, B., Wasserman, L., and Roeder, K.
(2003). On the identification of disease mutations by
the analysis of haplotype similarity and goodness of
fit. Am J Hum Genet, 72:891–902.
Wang, J. H., Pappas, D., Jager, P. L. D., Pelletier, D.,
de Bakker, P. I., Kappos, L., Polman, C. H., ‘Aus-
tralian, (ANZgene)’, N. Z. M. S. G. C., Chibnik,
L. B., Hafler, D. A., Matthews, P. M., Hauser, S. L.,
Baranzini, S. E., and Oksenberg, J. R. (2011). Mod-
eling the cumulative genetic risk for multiple scle-
rosis from genome-wide association data. Genome
Medicine, 3:3.
Wray, N., Goddard, M., and Visscher, P. (2007). Predic-
tion of individual genetic risk to disease from genome-
wide association studies. Genome Research, 17:1520–
28.
Yu, K., Gu, C. C., Xiong, C., An, P., and Province,
M. (2005). Global Transmission/Disequilibrium tests
based on haplotype sharing in multiple candidate
genes. Genetic Epidemiology, 29:223–35.
Zhang, S., Sha, Q., Chen, H., Dong, J., and Jiang, R. (2003).
Transmission/Disequilibrium test based on haplotype
sharing for tightly linked markers. Am J Hum Genet,
73:566–79.
BIOINFORMATICS 2012 - International Conference on Bioinformatics Models, Methods and Algorithms
366
