
A RULE-BASED CLASSIFICATION OF LARYNGOPATHIES
BASED ON SPECTRUM DISTURBANCE ANALYSIS
An Exemplary Study
Krzysztof Pancerz
1
, Wiesław Paja
1
, Jarosław Szkoła
1
, Jan Warchoł
2
and Gra˙zyna Olchowik
2
1
Institute of Biomedical Informatics, University of Information Technology and Management in Rzesz´ow, Rzesz´ow, Poland
2
Department of Biophysics, Medical University of Lublin, Lublin, Poland
Keywords:
Laryngopathy, Classification, Spectrum analysis.
Abstract:
Our research concerns data derived from the examined patient’s speech signals for a non-invasive diagnosis
of selected larynx diseases. The paper is devoted to the rule-based classification of patients on the basis of
a family of coefficients reflecting spectrum disturbances around basic tones and their multiples. The paper
presents a proposed procedure for feature selection and classification as well as the experiments carried out on
real-life data.
1 INTRODUCTION
Our research concerns designing methods for classi-
fication of patients with selected larynx diseases us-
ing a non-invasive diagnosis. Two diseases are taken
into consideration: Reinke’s edema (RE) and laryn-
geal polyp (LP). In general, the classification is based
on selected parameters of a patient’s speech signal
(phonation). Gathering parameters in this way is con-
venient for the patient because a measurement instru-
ment (microphone) is located outside the voice or-
gan. This enables free articulation. Moreover, dif-
ferent physiological and psychological patient factors
impede making a diagnosis using direct methods.
There exist various approaches to analysis of bio-
medical signals (cf. (Semmlow, 2009)). In general,
we can distinguish three groups of methods accord-
ing to a domain of the signal analysis: analysis in a
time domain, analysis in a frequency domain (spec-
trum analysis), analysis in a time-frequency domain
(e.g., wavelet analysis). Therefore, in our research,
we are going to build a specialized computer tool for
supporting diagnosis of laryngopathies based on a hy-
brid approach. A decision support system will have
a hierarchical structure based on multiple classifiers
working on signals in time and frequency domains.
A series of papers published earlier has presented
approaches designed for the computer tool being de-
veloped. Approaches presented in (Warchoł et al.,
2010) and (Pancerz et al., 2011) have been based on
the speech spectrum analysis. However, in the ap-
proach presented in (Szkoła et al., 2010b), (Szkoła
et al., 2010a), (Szkoła et al., 2011a), and (Szkoła
et al., 2011b), we have detected all non-natural dis-
turbances in articulation of selected phonemes using
the modified Elman-Jordan networks that are recur-
rent neural networks. They can be used for pattern
recognition in time series data due to their ability to
memorize some information from the past. The ap-
proach initialized in (Pancerz et al., 2011) is extended
in this paper.
2 CLASSIFICATION PROCESS
In the proposed approach, selected features (parame-
ters) reflecting patient’s speech spectrum disturbances
around a basic tone and its multiples (harmonics) are
calculated. Clinical experience shows that harmon-
ics in the speech spectrum of a healthy patient are
distributed approximately steadily. However, larynx
diseases may disturb this distribution (cf. (Warchoł,
2006)). Therefore, the analysis of a degree of distur-
bances can support diagnosis of larynx diseases.
Disturbances are expressed by a family of coeffi-
cients computed for neighborhoods of a basic tone f
0
and its four multiples (f
1
, f
2
, f
3
, f
4
). In a real situ-
ation frequencies f
1
, f
2
, f
3
, etc. are not distributed
steadily (cf. (Warchoł, 2006)). It means, that we need
to find a real distribution of harmonics. In the pre-
sented approach, it is done on the basis of the resul-
458
Pancerz K., Paja W., Szkoła J., Warchoł J. and Olchowik G..
A RULE-BASED CLASSIFICATION OF LARYNGOPATHIES BASED ON SPECTRUM DISTURBANCE ANALYSIS - An Exemplary Study.
DOI: 10.5220/0003874304580461
In Proceedings of the International Conference on Bio-inspired Systems and Signal Processing (BIOSIGNALS-2012), pages 458-461
ISBN: 978-989-8425-89-8
Copyright
c
2012 SCITEPRESS (Science and Technology Publications, Lda.)

tant spectrum (a sum of spectrums calculated for se-
lected N-point time windows into which an original
speech signal is divided). For each original frequency
f, a maximum magnitude is searched in the interval
[ f − d
1
, f + d
1
]. This maximum value is assumed as
a real harmonic. The original basic tone f
0
has been
obtained for each patient from histogram created in
the Multi-Dimensional Voice Program (MDVP). It is
a software tool for quantitativeacoustic assessment of
voice quality, calculating various parameters on a sin-
gle vocalization (see (MDVP, 2011)). On the basis of
f
0
, its harmonics(for ideal case) havebeen calculated.
Each coefficient expresses the distribution of a
spectrum around a given frequency f. We can dis-
tinguish two types of coefficients: the regularity coef-
ficient R determining a degree of slenderness of this
distribution and the deviation coefficient D determin-
ing a relative difference between a real multiple de-
rived from the spectrum and a multiple calculated on
the basis of the basic tone f
0
.
Let a speech signal of a given patient (a vector of
samples S = [s
1
, s
2
, . . . , s
n
]) be given. Our approach
can be expressed as a sequence of the following steps:
1. Normalizing signal sample values to the interval
[−1.0, 1.0], i.e., for each sample s ∈ S, a normal-
ized sample s
norm
is equal to s
norm
=
s
n
max
i=1
|s
i
|
.
2. Dividing the speech signal S into a family W
of N-point disjoint time windows, i.e., W =
[W
1
,W
2
, ...,W
m
], where W
1
= S[1, . . . , N], W
2
=
S[N + 1, . . . , 2N], etc.
3. Calculating harmonics (first f
1
, second f
2
, third
f
3
, and fourth f
4
) of a patient’s basic tone f
0
, i.e.,
f
1
= 2f
0
, f
2
= 3f
0
, f
3
= 4f
0
, and f
4
= 5f
0
.
4. Calculating a resultant discrete spectrum Sp for
the family W of time windows excluding some
initial and final ones, based on the Discrete-Time
Fourier Transform (DTFT), see e.g. (Semm-
low, 2009), i.e., X[k] =
N
∑
n=1
W[n]e
−2πjkn
N
, where
k = 0, 1, . . . , N − 1. The spectrum Sp(W) is
a vector of magnitudes |X[k]|, i.e., Sp(W) =
|X[0]|, |X[1]|, . . ., |X[
N
2
]|
. The resultant discrete
spectrum Sp is calculated as Sp =
∑
W∈W
Sp(W).
5. Finding real multiples (f
r
1
, f
r
2
, f
r
3
, and f
r
4
) of
the basic tone f
0
. A real multiple f
r
k
is as-
sumed to correspond to the maximum value of
Sp in a neighborhood of f
k
, i.e., in the interval
[ f
k
− d
m
, f
k
+ d
m
], where d
m
is the input parame-
ter and k = 1, . . . , 4.
6. Calculating the regularity coefficient R
k
, which
can also be treated as some kind of shape pa-
rameter, for each frequency f
k
(the basic tone
f
0
or its multiple f
R
1
, f
r
2
, f
r
3
, or f
r
4
). Two dis-
crete integrals I
1
and I
2
of the spectrum are cal-
culated, the first one for the frequency interval
[ f − d
2
, f + d
2
], the second one for the frequency
interval [ f − d
3
, f + d
3
], where d
2
and d
3
are input
parameters and d
2
< d
3
. The discrete integral I of
a fragment (between points k
1
and k
2
) of the spec-
trum Sp is equal to I =
k
2
∑
j=k
1
|X[ j]|. The ratio of I
1
to I
2
constitutes the regularity coefficient R
k
, i.e.,
R
k
=
I
1
I
2
. If both integrals are equal (ideal case),
then the regularity coefficient R
k
= 1. In a real
situation, some fuzziness of a spectrum around
a given harmonic frequency can be observed. It
causes that the regularity coefficient R
k
< 1, be-
cause I
1
< I
2
. It is easy to see, that the greater the
fuzziness of the spectrum, the smaller the regular-
ity coefficient (the smaller the slenderness of the
spectrum distribution).
7. Calculating the deviation coefficient D
k
for each
multiple f
k
of the basic tone f
0
. The deviation
coefficient D
k
is the ratio D
k
=
| f
r
k
− f
k
|
f
k
, where |x|
denotes the absolute value of x.
After execution of the procedure consisting of
steps presented above, we obtain a decision table
which is an input for classification algorithms. A sam-
ple of the decision table is presented in Table 1.
In the decision table being a training set of cases
for classifiers, we assign to each patient one of the
two classes: norm - a norm - for the patient from the
control group, i.e., without disturbances of phonation
confirmed by a phoniatrist opinion, path - pathology
- for the patient either with laryngeal polyp, or with
Reinke’s edema (both clinically confirmed).
The approach presented in this paper has been
tested using classification algorithms available in the
popular data mining and machine learning software
tools: WEKA (Witten and Frank, 2005), Rough
Set Exploration System (RSES) (Bazan and Szczuka,
2005), NGTS (Hippe, 1997). Four of them are rule-
based algorithms: exhaustive (RSES) (Bazan et al.,
2000), LEM2 (RSES) (Grzymala-Busse, 1997), Ge-
netic (RSES) (Wr´oblewski, 1998), and NGTS (Hippe,
1997). Two of them are decision-tree based algo-
rithms: J48 (WEKA) - an implementation of C4.5
(Quinlan, 1993), CART (WEKA) (Breiman et al.,
1993).
Values of features can be treated as continuous
quantitative data. Building classification rules for
such data can be difficult and/or highly inefficient.
Therefore, for RSES generation algorithms, the so-
called discretization was a necessary preprocessing
A RULE-BASED CLASSIFICATION OF LARYNGOPATHIES BASED ON SPECTRUM DISTURBANCE ANALYSIS
- An Exemplary Study
459
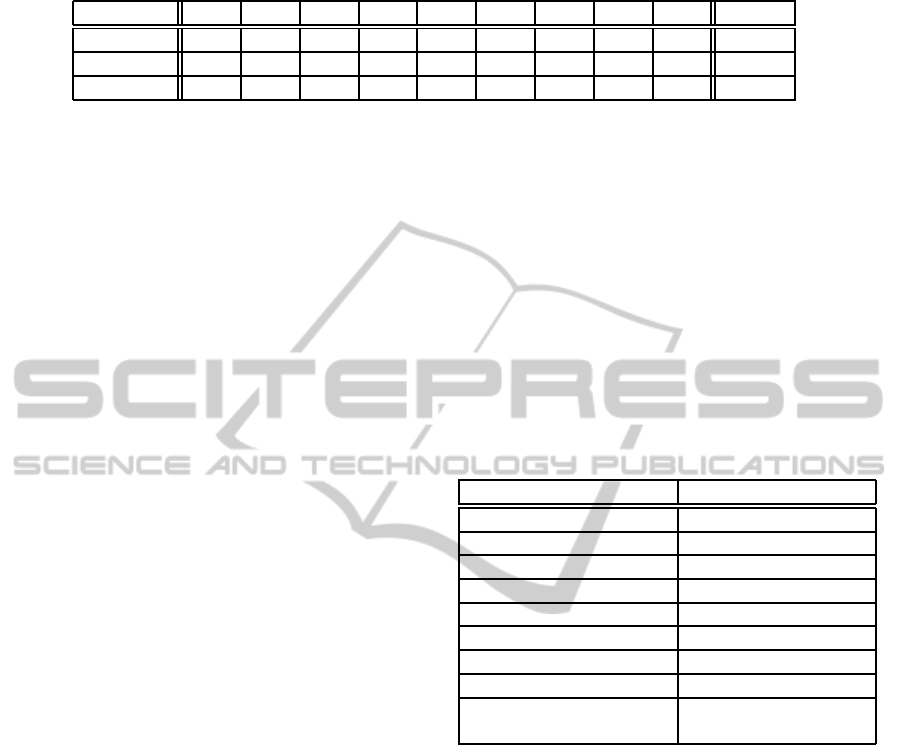
Table 1: A sample of the decision table.
Patient ID R
0
R
1
R
2
R
3
R
4
D
1
D
2
D
3
D
4
CLASS
#1 0.90 0.89 0.89 0.82 0.75 0.01 0.00 0.00 0.00 norm
#2 0.85 0.82 0.75 0.59 0.58 0.04 0.03 0.08 0.08 path
... ... ... ... ... ... ... ... ... ... ...
step (Cios et al., 2007). Its overall goal was to re-
duce the number of values by grouping them into a
number of intervals. Some discretization techniques
based on rough sets and Boolean reasoning have been
presented in (Bazan et al., 2000).
The sets of rules obtained using NGTS were im-
proved using the RuleSEEKER system (Błajdo et al.,
2004). The main optimizing process was based on
an exhaustive application of a collection of generic
operations (Paja and Hippe, 2005): finding and re-
moving redundancy, finding and removing incorpora-
tive rules, merging rules, finding and removing un-
necessary rules, finding and removing unnecessary
conditions, creating missing rules, discovering hidden
rules, rule specification, selecting final set of rules.
3 EXPERIMENTS
In the experiments, sound samples were analyzed.
The experiments were carried out on two groups
(Warchoł, 2006). The first group included persons
without disturbances of phonation - the control group
(CG). They were confirmed by a phoniatrist opin-
ion. All persons were non-smoking, so they did not
have contact with toxic substances which can have
an influence on the physiological state of vocal folds.
The second group included patients of Otolaryngol-
ogy Clinic of the Medical University of Lublin in
Poland. They had clinically confirmed dysphonia as
a result of Reinke’s edema (RE) or laryngeal polyp
(LP). Experiments were carried out by a course of
breathing exercises with instruction about the way of
articulation. The task of all examined patients was to
utter separately different Polish vowels with extended
articulation as long as possible, without intonation,
and each on separate expiration.Each sound sample
was recorded on MiniDisc MZ-R55 (Sony). Effec-
tiveness of such an analysis was confirmed by Win-
holtz and Titze in 1998 (Winholtz and Titze, 1998).
For experiments, we have tested various combina-
tions of input parameters. The best classification re-
sults have been obtained for the following parameters:
N = 8192 - the number of points (samples) taken for
DTFT, d
m
= 12 - deviation for searching maximum,
d
2
= 4, d
3
= 8 - deviations for calculating spectrum
regularity coefficients.
To determine accuracy of generated rules by clas-
sification algorithms a cross-validation method was
used. Cross-validation is frequently used as a method
for evaluating classification models. It comprises of
several training and testing runs. First, the data set is
split into several, possibly equal in size, disjoint parts.
Then, one of the parts is taken as a training set for rule
generation and the remainder (sum of all other parts)
becomes the test set for rule validation. In our exper-
iments, a standard 10 cross-validation test was used
(CV-10). Each classification algorithm was evaluated
via testing the classification accuracy of unseen cases.
Results of evaluation are collected in Table 2.
Table 2: Results of experiments: classification accuracy.
Algorithm Classification accurracy
Exhaustive (RSES) 0.8430
LEM2 (RSES) 0.8700
Genetic (RSES) 0.8430
J48 (WEKA) 0.8441
CART (WEKA) 0.7922
NGTS 0.6786
NGTS (partial matching) 0.7786
NGTS (after optimization) 0.7214
NGTS (after optimization, 0.8071
partial matching)
Almost all popular rule-based algorithms of ma-
chine learning and data mining manifest very simi-
lar classification accuracy. The obtained result can be
treated as promising. In general, the considered prob-
lem is not simple. An important role is played by the
quality of speech recording. The quality of results
is also dependent on chosen preprocessing methods
(e.g. filtration) and signal processing methods, e.g.
Discrete-Time Fourier Transform (DTFT). An espe-
cially difficult task is the extraction of the correct sig-
nal.
4 CONCLUSIONS
On the basis of experiments described in the paper,we
can notice that a family of coefficients, calculated on
the basis of the analysis of spectrum shapes and de-
viations around a basic tone and its multiples for the
BIOSIGNALS 2012 - International Conference on Bio-inspired Systems and Signal Processing
460

examined patient’s speech signal, may be helpful for
classification of a patient. In general, the speech anal-
ysis of patients with larynx diseases is a difficult task.
Therefore, the obtained results seem to be promising.
In the future, we plan to tune parameters reflect-
ing regularity and deviations in the speech spectrum,
especially by selecting proper regions of interest of
the spectrum and we are going to add some new coef-
ficients characterizing spectrum disturbances as well.
The proposed approach based on analysis of speech
signals in a frequency domain can be a part of a com-
puter tool based on multicriteria decision making pro-
cess. It should be treated as a supplementary element
for other techniques. An important challenge is to
design methods enabling distinction between differ-
ent larynx diseases (for example, laryngeal polyp and
Reinke’s edema). The approach presented in this pa-
per does not enable us to make this distinction.
ACKNOWLEDGEMENTS
This research has been supported by the grant No. N
N516 423938 from the Polish Ministry of Science and
Higher Education.
REFERENCES
Bazan, J. G., Nguyen, H. S., Nguyen, S. H., Synak, P., and
Wroblewski, J. (2000). Rough set algorithms in classi-
fication problem. In Polkowski, L., Tsumoto, S., and
Lin, T. Y., editors, Rough Set Methods and Applica-
tions, pages 49–88. Physica-Verlag, Heidelberg, Ger-
many.
Bazan, J. G. and Szczuka, M. S. (2005). The Rough Set
Exploration System. In Peters, J. and Skowron, A.,
editors, Transactions on Rough Sets III, pages 37–56.
Springer-Verlag, Berlin Heidelberg.
Błajdo, P., Grzymała-Busse, J., Hippe, Z., Knap, M.,
Marek, T., Mroczek, T., and Wrzesie´n, M. (2004). A
suite of machine learning programs for data mining:
chemical applications. In Debska, B. and Fic, G., edi-
tors, Information Systems In Chemistry 2, pages 7–14.
University of Technology Editorial Office, Rzeszow.
Breiman, L., Friedman, J., Olshen, R., and Stone, C. (1993).
Classification and Regression Trees. Chapman &
Hall, Boca Raton.
Cios, K., Pedrycz, W., Swiniarski, R., and Kurgan, L.
(2007). Data mining. A knowledge dis-covery ap-
proach. Springer, New York.
Grzymala-Busse, J. (1997). A new version of the rule induc-
tion system LERS. Fundamenta Informaticae, 31:27–
39.
Hippe, Z. (1997). Machine learning a promising strategy
for business information processing? In Abramowicz,
W., editor, Business Information Systems, pages 603–
622. Academy of Economics Editorial Office, Poznan.
MDVP (2011). Multi-dimensional voice program (MDVP).
http://www.kayelemetrics.com.
Paja, W. and Hippe, Z. (2005). Feasibility studies of
quality of knowledge mined from multiple secondary
sources. I. Implementation of generic operations. In
Klopotek, M., Wierzchon, S., and Trojanowski, K.,
editors, Intelligent Information Processing and Web
Mining, pages 461–465. Springer-Verlag, Berlin Hei-
delberg.
Pancerz, K., Szkoła, J., Warchoł, J., and Olchowik, G.
(2011). Spectrum disturbance analysis for computer-
aided diagnosis of laryngopathies: An exemplary
study. In Proc. of the International Workshop on
Biomedical Informatics and Biometric Technologies
(BT’2011), Zilina, Slovak Republic.
Quinlan, J. (1993). C4.5. Programs for machine learning.
Morgan Kaufmann Publishers.
Semmlow, J. (2009). Biosignal and Medical Image Pro-
cessing. CRC Press.
Szkoła, J., Pancerz, K., and Warchoł, J. (2010a). Computer-
based clinical decision support for laryngopathies us-
ing recurrent neural networks. In Hassanien, A.
et al., editors, Proc. of the ISDA’2010, pages 627–632,
Cairo, Egypt.
Szkoła, J., Pancerz, K., and Warchoł, J. (2010b). Com-
puter diagnosis of laryngopathies based on temporal
pattern recognition in speech signal. Bio-Algorithms
and Med-Systems, 6(12):75–80.
Szkoła, J., Pancerz, K., and Warchoł, J. (2011a). Improv-
ing learning ability of recurrent neural networks: Ex-
periments on speech signals of patients with laryn-
gopathies. In Babiloni, F. et al., editors, Proc. of the
BIOSIGNALS’2011, pages 360–364, Rome, Italy.
Szkoła, J., Pancerz, K., and Warchoł, J. (2011b). Recurrent
neural networks in computer-based clinical decision
support for laryngopathies: An experimental study.
Computational Intelligence and Neuroscience, 2011.
Article ID 289398.
Warchoł, J. (2006). Speech Examination with Correct and
Pathological Phonation Using the SVAN 912AE Anal-
yser (in Polish). PhD thesis, Medical University of
Lublin.
Warchoł, J., Szkoła, J., and Pancerz, K. (2010). Towards
computer diagnosis of laryngopathies based on speech
spectrum analysis: A preliminary approach. In Fred,
A., Filipe, J., and Gamboa, H., editors, Proc. of the
BIOSIGNALS’2010, pages 464–467, Valencia, Spain.
Winholtz, W. and Titze, I. (1998). Suitability of minidisc
(MD) recordings for voice perturbation analysis. Jour-
nal of Voice, 12(2):138–142.
Witten, I. H. and Frank, E. (2005). Data Mining: Practi-
cal Machine Learning Tools and Techniques. Morgan
Kaufmann.
Wr´oblewski, J. (1998). Genetic algorithms in decomposi-
tion and classification problem. In Polkowski, L. and
Skowron, A., editors, Rough Sets in Knowledge Dis-
covery 2, volume 2, pages 471–487. Physica-Verlag,
Heidelberg, Germany.
A RULE-BASED CLASSIFICATION OF LARYNGOPATHIES BASED ON SPECTRUM DISTURBANCE ANALYSIS
- An Exemplary Study
461
