
COMPLEX NETWORK PROPERTIES OF EYE-TRACKING
IN THE FACE RECOGNITION PROCESS
An Initial Study
Bolesław Jaskuła, Jarosław Szkoła and Krzysztof Pancerz
Institute of Biomedical Informatics, University of Information Technology and Management in Rzesz
´
ow, Rzesz
´
ow, Poland
Keywords:
Complex networks, Eye-tracking, Face recognition.
Abstract:
In the paper, we propose to investigate eye-tracking sequences obtained in the face recognition process in
terms of complex networks. A proper algorithm for transformation sequences coming from eye-tracking into
complex networks is described. The analysis of parameters of obtained complex networks can be helpful in
better understanding and classifying human mental behaviors and activities.
1 MOTIVATION
In this section we give motivations of our research on
the application of complex networks in the analysis
of eye-tracking sequences coming from experiments
with the face recognition process.
1.1 Why Complex Networks?
The application of biometrics (eye movement belongs
to this group) in interactive computer systems re-
quires a response of the computer system to be re-
alized in real time. Therefore, a dynamic analysis of
human behavior (eye movement) becomes necessary.
According to this necessity, there is a need to design
dynamic models of creating tracks of eye movement
during realization of mental processes interesting for
us (for example, free viewing, recognition, browsing).
The complex networks (Boccaletti et al., 2006) seem
to be suitable to solve such a problem.
Another reason for using complex networks is
connected with the possibility of the application of
computer systems for the analysis of eyeball move-
ment in the diagnosis process of human mental behav-
ior (for example, in medical diagnosis). Therefore,
there is a need to design methods and techniques en-
abling us to analyze structures of behavior patterns at
length and to pick deviant behaviors (eyeball move-
ment) up. We hope that the application of complex
network theory in the process of the analysis of eye-
tracking results will enable us to reach this goal. The
aim of research carried out by us is to design a net-
work model of eyeball movement and to apply all as-
pects of this process to parameters of complex net-
works analyzed in the framework of rules generally
used in testing their properties.
1.2 Why Face Recognition?
Results of the first stage of research carried out by
us are presented in this paper. The aim was to deter-
mine whether we deal with complex networks, and of
which type, in the face recognition process. Selec-
tion of this mental activity in this research stage was
not accidental. The analysis of literature showed that
structures of eyeball movement tracks sprung from
this kind of activity have a complexity degree which
is not too high. It has the important meaning at this
stage of examination of the effectiveness of the de-
signed transformation algorithm, i.e., simplifying the
process of comparison of structures obtained using
the eye-tracker and structures obtained after the trans-
formation process.
2 RUDIMENTS OF COMPLEX
NETWORKS
The last decade has witnessed the birth of a new
movement of interest and research in the study of
complex networks, i.e. networks whose structure is
irregular, complex and dynamically evolving in time,
with the main focus moving from the analysis of small
462
Jaskuła B., Szkoła J. and Pancerz K..
COMPLEX NETWORK PROPERTIES OF EYE-TRACKING IN THE FACE RECOGNITION PROCESS - An Initial Study.
DOI: 10.5220/0003875204620465
In Proceedings of the International Conference on Bio-inspired Systems and Signal Processing (BIOSIGNALS-2012), pages 462-465
ISBN: 978-989-8425-89-8
Copyright
c
2012 SCITEPRESS (Science and Technology Publications, Lda.)

networks to that of systems with thousands or mil-
lions of nodes, and with a renewed attention to the
properties of networks of dynamical units (Boccaletti
et al., 2006).
In this section, we recall basic notions concerning
complex networks and their properties. For more de-
tailed information, we refer the readers to (Boccaletti
et al., 2006).
Formally, a complex network can be presented as
a graph either undirected or directed. In our inves-
tigations, we consider complex networks represented
by undirected graphs. It means that we are not in-
terested in directions of edges. An undirected graph
G = (N , E) consists of two sets N and E such that
N 6=
/
0 and E is a set of unordered pairs of elements
of N . The elements of N = {n
1
, n
2
, . . . , n
K
} are the
nodes of G, while the elements of E = {e
1
, e
2
, . . . , e
L
}
are the edges of G. The number of elements in N and
E is denoted by K and L, respectively. The size of
the graph is the number of nodes, i.e., K. In an undi-
rected graph, each of the links is defined by a couple
of nodes n
i
and n
j
, where i, j = 1, . . . , K, and is de-
noted as (n
i
, n
j
). The link is said to be incident in
nodes n
i
and n
j
or to join the two nodes. Two nodes
joined by a link are referred to as adjacent or neigh-
boring.
For a graph G of size K, the number of edges L is
at least 0 and at most
K(K−1)
2
(when all the nodes are
pairwise adjacent). It is often useful to consider a ma-
trix representation of a graph. A graph G = (N , E)
can be completely described by giving the adjacency
matrix A = [a
i j
]
K×K
, a square matrix whose entry
a
i j
, where i, j = 1, . . . , K, is equal to 1 when the link
(n
i
, n
j
) exists, and 0 otherwise. The degree k
i
of a
given node n
i
is the number of edges incident with the
node, and is defined in terms of the adjacency matrix
A as:
k
i
=
K
∑
j
a
i j
.
The geodesic from node n
i
to node n
j
in a graph
G is the minimal number of edges connecting n
i
with
n
j
. All the shortest path lengths of a graph G can be
represented as a matrix D in which the entry d
i j
is the
length of the geodesic from node n
i
to node n
j
.
The following properties (parameters) of a com-
plex network, represented by the graph G, are inter-
esting for us (cf. (Boccaletti et al., 2006)):
• L - the average shortest path length of G:
L =
K
K − 1
∑
i, j=1,...,K,i6= j
d
i j
• D - diameter of G:
D = max
i, j=1,...,K
d
i j
.
• C - the clustering coefficient of G:
C =
K
∑
i=1
2L
i
k
i
(k
i
−1)
K
,
where L
i
is the number of all edges existing be-
tween neighboring nodes of n
i
.
•
h
k
i
- the average degree of a node in G:
h
k
i
=
2L
K
.
The most basic topological characterization of a
graph G is expressed in terms of the degree distribu-
tion P(k). The degree distribution P(k) is defined as
the probability that a node chosen uniformly at ran-
dom has degree k. In real networks, P(k) significantly
deviates from the Poisson distribution expected for a
random graph and, in many cases, exhibits a power
law (scale-free) P(k) ∼ Ak
−γ
with 2 ≤ γ ≤ 3, where A
is a factor of proportionality. The scale-free networks
have a highly inhomogeneous degree distribution, re-
sulting in the simultaneous presence of a few nodes
(the hubs) linked to many other nodes, and a large
number of poorly connected elements.
3 PROCEDURE
First of all, the aim of designing the transformation
algorithm was to restrict an impact of the structure
of stimulus on the obtained network structure dur-
ing the analysis process. Therefore, the network has
the form of an undirected graph. In our case, as dis-
tinct from the current methodology of analysis of eye-
tracking results directed to analysis of a stimulus ef-
fectiveness (for example, testing the usability of the
Web page), regions of interest have not been fixed a
priori, equally for all of the subjects, but they have
been created by the subjects during the realization of
the face recognition process as important biometric
elements. A structure of the obtained networks cov-
ers fixations, saccades, and transitions (Matos, 2010).
The fixation lengths varies from about 100 to 600 mil-
liseconds. During this stop the brain starts to process
the visual information received from the eyes. Sac-
cades are extremely fast jumps from one fixation to
the other. The human visual field is 220
◦
. The 1 − 2
◦
area of foveal vision is about the size of a thumbnail
on an arm lengths distance. Therefore, an estimate
of the area of placement of the fovea is 2.4 cm. The
last parameter affects a circle region of interest set in
our algorithm. In the algorithm, we use the following
notation, R
r
(c) is a circle region of interest (ROI) of
radius r with the center at c, card(X) denotes a cardi-
nality of the set X.
COMPLEX NETWORK PROPERTIES OF EYE-TRACKING IN THE FACE RECOGNITION PROCESS - An Initial
Study
463

Algorithm 1: Algorithm for transformation of
a sequence of eye-tracking points into an undi-
rected graph representing a complex network.
Input : T =
h
t
1
,t
2
, . . . ,t
n
i
- a sequence of
eye-tracking points, r - a radius of a
circle region of interest (ROI).
Output: G = (N , E) - an undirected graph
representing a complex network.
N ←
/
0;
E ←
/
0;
R ←
/
0;
Create R
r
(t
1
);
N ← N ∪ {t
1
};
R ← R ∪ {R
r
(t
1
)};
for i = 2, . . . , n do
N ← N ∪ {t
i
};
for j = card(R ), . . . , 1 do
if t
i
∈ R
j
r
(t
k
) then
E ← E ∪{(t
i
,t
k
)};
break;
else
Create R
r
(t
i
);
R ← R ∪ {R
r
(t
i
)};
end
end
end
Create an undirected graph G = (N , E);
Return G;
4 EXPERIMENTS
Investigations were conducted using Tobii T60 eye-
tracker in laboratory conditions. This tool is able to
measure human behavior (e.g. (Matos, 2010)) We
have considered several problems (see (Jaskuła et al.,
2011)). In the first problem five faces including both
known ones (politicians, actors) and unfamiliar ones
were shown to the subjects individually, each for a pe-
riod of five seconds. The subject had the task to sig-
nal (by mouse clicking) the moment of recognizing
a face (the moment when the subject became aware
of this fact). In case of the unfamiliar face, signal-
ing consisted in a lack of any reaction. In the second
problem five faces including both known (politicians,
actors) ones and unfamiliar ones were shown to the
subjects individually, each for a period of five sec-
onds. The faces were different from the faces used
in the first problem. The subject had the task to lie,
i.e., by signaling (by mouse clicking) the moment of
recognizing the unfamiliar face or non-signaling the
moment of recognizing the known face. The moment
of lying was chosen arbitrary by the subject. In the
third problem one unfamiliar face was shown to the
subjects for memorizing for a period of five seconds.
The face was different from the faces used in the pre-
vious problems. After 30 minutes, the subject had the
task to recognize the memorized face out of five dif-
ferent faces. In case of recognizing the face (the mo-
ment when the subject became aware of this fact), the
subject signaled the moment of recognizing by dou-
ble clicking the mouse. In case of the unfamiliar face,
the subject signaled the moment of making a decision
about classifying it to this group, i.e., unfamiliar.
Each obtained eye-tracking sequence has been
transformed into the graph representing the complex
network according to the algorithm described in Sec-
tion 3. An example of the complex network obtained
in this way is shown in Figure 1. To display this net-
work in the graphical form, a specialized tool called
Pajek has been used (see (De Nooy et al., 2011)). Pa-
jek is a program for the analysis and visualization
of large networks. Next, parameters of the complex
networks recalled in Section 2 have been calculated.
Exemplary results of parameter calculations are col-
lected in Table 1. Let us remind that L is the average
shortest path length of the obtained graph G, D is di-
ameter of G, C is the clustering coefficient of G,
h
k
i
is the average degree of a node in G, and N is the
number of nodes in G.
Table 1: Results of parameter calculations.
Experiment ID L D C
h
k
i
N
#1 3.45 6 0.10 1.94 293
#2 3.41 7 0.14 1.70 294
#3 2.93 6 0.15 1.90 296
#4 3.49 7 0.13 1.89 282
#5 2.75 5 0.08 2.02 293
The degree distribution is calculated for P(k
∗
) =
k
−γ
∗
, where k
∗
is close to
h
k
i
. The smaller the value
of γ, the more important the role of the hubs is in the
network. In general, the unusual properties of scale-
free networks are valid only for γ < 3. Exemplary
results of degree exponent calculations for networks
obtained in our experiments are collected in Table 2.
Table 2: Results of calculations of the degree exponent.
Experiment ID γ
#1 1.54
#2 1.34
#3 1.52
#4 1.52
#5 1.61
The analysis of networks created on the basis of
BIOSIGNALS 2012 - International Conference on Bio-inspired Systems and Signal Processing
464
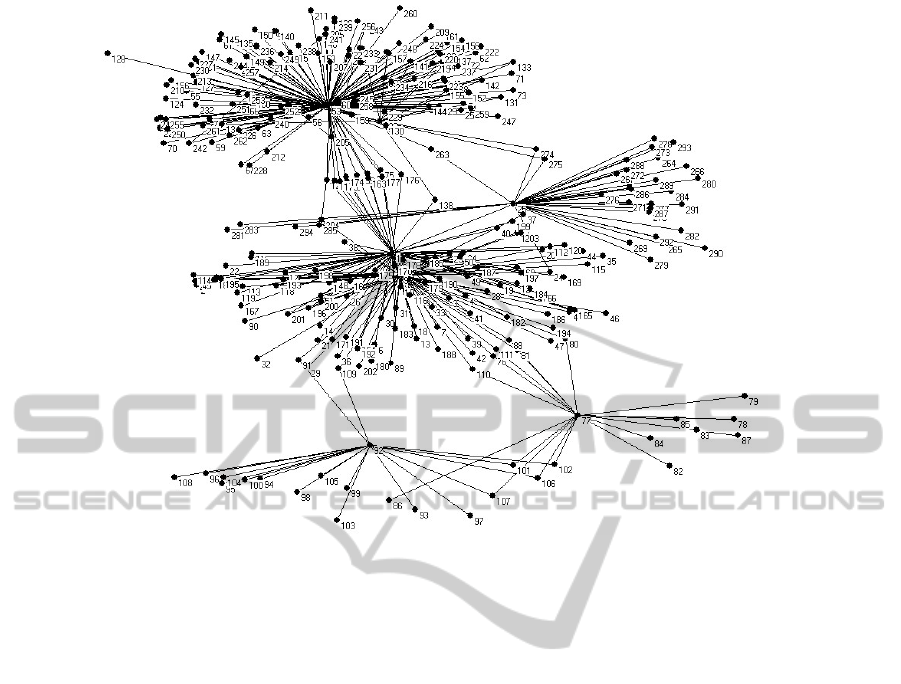
Figure 1: Example of the complex network corresponding to the face recognition process.
fixations (nodes) and cascades (edges) shows that
scanpath structures originating in the face recognition
process demonstrate properties of the scale-free net-
works. They are networks created by a large number
of poorly connected nodes as well as a relatively small
number of highly connected nodes that are known as
hubs (Barabasi and Oltvai, 2004). This fact means
(and simultaneously validates) that in the face recog-
nition process, a crucial role is played only by some
characteristic places (Van Belle et al., 2010). Proba-
bly, removing of such places complicates remarkably
a proper recognition process or it even prevents it.
Confirmation of this hypothesis is one of further re-
search aims on the application of complex networks
in the process of visual perception of human.
5 CONCLUSIONS AND FURTHER
WORK
In the paper, we have started pioneering research
on application of complex networks in the analy-
sis of eye-tracking sequences coming from experi-
ments with the face recognition process. Experiments
showed that the complex network corresponding to
the face recognition process can be treated as the
scale-free network. In the future, we plan to inves-
tigate structures of the networks obtained from other
mental activities (browsing, free viewing). We will
also investigate dependencies between other parame-
ters of the complex networks and characters of men-
tal activities performed by the human. An important
thing is to add methods and techniques of neuropsy-
chology (EEG, computer tomography).
REFERENCES
Barabasi, A.-L. and Oltvai, Z. (2004). Network biology:
Understanding the cell’s functional organization. Nat-
ural Reviews Genetics, 5:101–113.
Boccaletti, S., Latora, V., Moreno, Y., Chavez, M., and
Hwang, D.-U. (2006). Complex networks: Structure
and dynamics. Physics Reports, 424:175–308.
De Nooy, W., Mrvar, A., and Batagelj, V. (2011). Ex-
ploratory Social Network Analysis with Pajek. Cam-
bridge University Press, New York.
Jaskuła, B., Pancerz, K., Jachyra, D., and Szkoła (2011).
Pupil dilation as an indicator of the face recognition
moment: An experimental study. In Proc. of the In-
ternational Workshop on Biomedical Informatics and
Biometric Technologies (BT’2011), Zilina, Slovak Re-
public.
Matos, R. (2010). Designing eye tracking experiments to
measure human behavior. Tobii Technology.
Van Belle, G., Ramon, M., Lefevre, P., and Rossion, B.
(2010). Fixation patterns during recognition of per-
sonally familiar and unfamiliar faces. Frontiers in
Psychology, 1. Article ID 20.
COMPLEX NETWORK PROPERTIES OF EYE-TRACKING IN THE FACE RECOGNITION PROCESS - An Initial
Study
465
