
ANALYSIS OF BERG BALANCE SCALE IN HIP FRACTURE
PATIENTS USING FUZZY CLUSTERING
Aleksandar Jeremic
1
, Natasa Radosavljevic
2
, Dejan Nikolic
3
and Milica Lazovic
4
1
Department of Electrical and Computer Engineering, McMaster University, Hamilton, ON, Canada
2
Institute for Rehabilitation, Belgrade, Serbia
3
Physical Medicine and Rehabilitation, University Childrens Hospital, Belgrade, Serbia
4
Faculty of Medicine, University of Belgrade, Belgrade, Serbia
Keywords:
Fuzzy clustering, Hip fracture, Clinical decision making.
Abstract:
Hip fractures are most frequent cause of hospitalization after the fall in older population and consequently
have been subject of great interest in medicine and biomedical engineering. It has been observed that the
incidence of hip fractures is rising at the approximate rate of 1-3% per year, with subsequent mortality rates
at approximately 33% in first year after the fracture. In this paper we propose to classify patients at the time
of admission into several clusters with respect to their ability for successful recovery. To this purpose we first
evaluate the efficacy of rehabilitation program based on the balance function improvement measured by Berg
Balance Scale (BBS) in elderly (in the remainder of the paper defined as above 65 years of life) after hip
fractures, and evaluate influence of gender, age and comorbidity on balance function improvement in these
patients. Then we design clustering procedure in which the patients are clustered according to BBS improve-
ment using statistically most significant parameters. We then evaluate the proposed clustering procedure on
a data sample consisting of 203 patients that have been admitted to the Institute for Rehabilitation, Belgrade,
Serbia.
1 INTRODUCTION
Hip fractures are most frequent cause of hospitaliza-
tion after the fall in older population (Roudsari et al.,
2005) and consequently has been subject of great in-
terest in medicine and biomedical engineering. It has
been observed that the incidence of hip fractures is
rising at the approximate rate of 1-3% per year, with
subsequent mortality rates at approximately 33% in
first year after the fracture (Johnell and Kanis, 2004;
Roche et al., 2005). Consequently because of the in-
creasingly large number of elderly patients with these
fractures significant advances have been made with
respect to surgical procedures, post-surgical rehabili-
tation procedures as well as social support services. It
is often emphasized that management and allocation
of resources is of utmost importance in patient care.
In practical situations the amount of resources is lim-
ited and thus proper assignment of priorities may play
crucial role in recovery. As an example certain pa-
tients experiencing hip fracture may show significant
progress if surgeries and rehabilitation programs are
allocated in timely manner thus leading to more effi-
cient health care.
One of the most important aspects of rehabilita-
tion in these patients is habilitation for independent
walking which has been strongly correlated with the
balance establishment and/or improvement in these
individuals. Furthermore it has been reported that the
balance improvement has demonstrated strong nega-
tive correlation with probability of further falls and
hip fractures in elderly (Berry et al., 2007). One of
the commonly used techniques (measures) for bal-
ance evaluation is Berg Balance Scale (BBS) and it
has been demonstrated that it is of particular interest
in elderly population (Santos et al., 2011). In this pa-
per we propose to classify patients at the time of ad-
mission into several clusters with respect to their abil-
ity for successful recovery. To this purpose we first
evaluate the efficacy of rehabilitation program based
on the balance function improvement measured by
Berg Balance Scale (BBS) in elderly (in the remain-
der of the paper defined as above 65 years of life) af-
ter hip fractures, and evaluate influence of gender, age
and comorbidity on balance function improvement in
these patients. Then we design clustering procedure
466
Jeremic A., Radosavljevic N., Nikolic D. and Lazovic M..
ANALYSIS OF BERG BALANCE SCALE IN HIP FRACTURE PATIENTS USING FUZZY CLUSTERING.
DOI: 10.5220/0003875504660469
In Proceedings of the International Conference on Bio-inspired Systems and Signal Processing (BIOSIGNALS-2012), pages 466-469
ISBN: 978-989-8425-89-8
Copyright
c
2012 SCITEPRESS (Science and Technology Publications, Lda.)

in which the patients are clustered according to BBS
improvement using statistically most significant pa-
rameters. It is often argued that proper administration
of intrahospital as well as post-recovery procedures
can significantly improve the recovery of patients. To
this purpose it would be extremely beneficial to prop-
erly triage (cluster) patients at the admission stage in
order to ensure optimal distribution of resources. We
then evaluate the proposed clustering procedure on a
data sample consisting of 203 patients that have been
admitted to the Institute for Rehabilitation, Belgrade,
Serbia.
The paper is organized as follows. In Section II we
describe the data set and the proposed classification
models. In Section III we evaluate the applicability of
the proposed algorithm using a real data set. Finally,
in Section IV we discuss the results and future work.
2 SIGNAL PROCESSING
MODELS
2.1 Data Set
The prospective study included 203 patients with hip
fractures that were referred into the specialized re-
habilitation institution for the rehabilitation program
and admitted from january 2011 until June 2011.
Prior to the inclusion into the study, eligible partici-
pants were informed about the study protocol and re-
habilitation program with possible contraindications
that might arise over the course of treatment. The
informed consent was obtained prior to the inclu-
sion. The study was approved by the Institutional
Review Board. Implementation of rehabilitation pro-
gram was individually prescribed with respect to the
patients functional status and continuously monitored
for early identification of possible complications that
could arise during the treatment. Functional status of
every individual in the program was evaluated by the
Berg Balance Scale test on 3 occasions: at the ad-
mission (Group 1), at discharge from the rehabilita-
tion facility (Group 2) and 3 months after discharge
(Group 3). Berg Balance Scale test evaluated 14 tasks
(5 static and 9 dynamic) that are graded as 5 points
scale with the range from 0 to 4, to the maximal value
for the summarized scores of 56 (Stevenson et al.,
2010). Ability to predict falls in elderly population
suggests the validity of BBS test (9). The BBS is
used to measure functional balance that is composed
of 3 dimensions: position maintaining, postural ad-
justment to voluntary movements and reaction to ex-
ternal disturbance (Berg et al., 1995).
2.2 Preprocessing
We organize the data set in a database consisting
of 203 rows corresponding to the patients and 33
columns of different features (age, height, weight,
respiratory conditions, heart conditions, BBS at the
admission, BBS at the discharge, BBS three months
after discharge, etc.) Then we analyze cross-
correlation between all the features and extract sta-
tistically significant ones using Pearson coefficient.
In order to study dynamics of rehabilitation we use
log-values of BBS score ratios. The rationale behind
this approach is that we expect exponential change in
balance improvement and thus log (semi-log) models
may represent better fit.
2.3 Clustering Algorithm
Once statistically significant features have been se-
lected the problem reduces to clustering of m-
dimensional vectors into a set of pre-determined clus-
ters. In order to determine appropriate use of clinical
resources as a preliminary approach we proposeto de-
termine which patients have largest/smallest capacity
for recovery. We propose to determine the significant
parameters using Spearman correlation coefficient
which is commonly used technique in cases/models
where nonlinearity is expected. We then propose to
cluster all the patients into several clusters. We inves-
tigate two possible scenarios in this paper: a) two-
cluster scenario consisting with high rate recovery
and low rate recovery patients, and b) three-cluster
scenario - low, medium, and high rates of recovery.
Note that the number of clusters can be arbitrarily set
and is usually controlled by the overall error of clas-
sification. In addition, the quality of health care and
resource management can be relatively robust to the
overall error of classification and thus the overall re-
sults in treatments may not change significantly for
small variations in number of clusters.
In order to cluster the data set we propose to use
fuzzy clustering based on Gath-Geva (Gath and Geva,
1989) clustering which uses Gaussian distance and
consequently assumes that the data set arises from
mixture of Gaussian distributions. A general outline
of the algorithms is as follows: a) arbitrarily assign
each patient to a cluster i.e. arbitrarily pick if the pa-
tient is high or low rate recovery. Note also that the
preliminaryclustering can be either done arbitrarily or
using a hard clustering algorithms such as K-means,
b) update cluster centers, c) reassign objects to the
clusters to which the objects are most similar, d) re-
peat until no change by reassignment. The update of
clustering matrix is done using the following approa-
ANALYSIS OF BERG BALANCE SCALE IN HIP FRACTURE PATIENTS USING FUZZY CLUSTERING
467
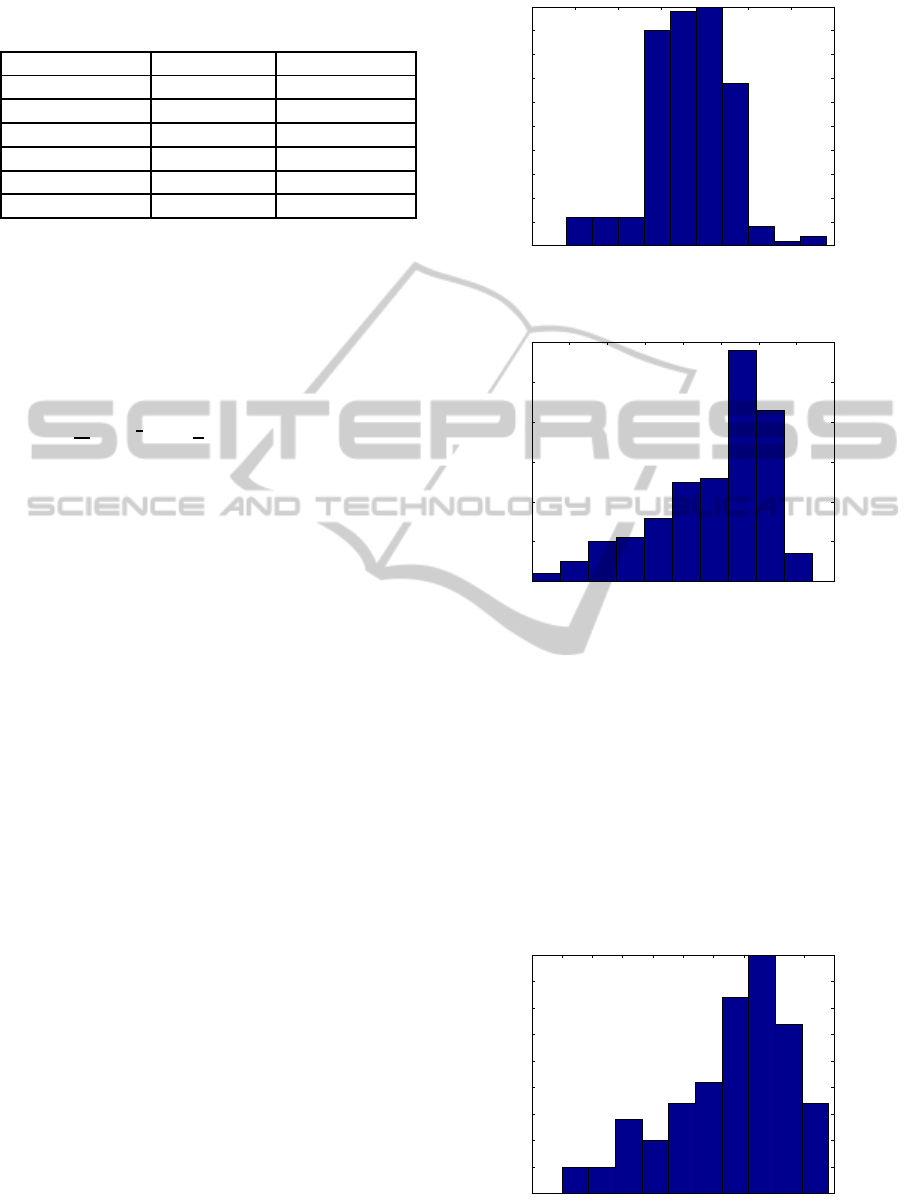
Table 1: General characteristics of patient population with
respect to the age and severity index of fracture.
Age Severity Index
Total N=203 77± 6.11 1.74± 0.49
Female N=149 78.28± 5.86 1.74± 0.43
Male N =54 76.19± 6.56 1.76± 0.64
Group1 N=65 70.48± 3.14 1.72± 0.65
Group 2 N=114 79.92 ± 2.88 1.75± 0.41
Group 3 N=25 86.56± 1.39 1.73± 0.37
ch: if there is any distance greater than zero then
membership grade is the weighted average of the dis-
tances to all the centers else the patient belongs to this
cluster and no other clusters. Note that in GG al-
gorithm the distance calculated is Gaussian distance
given by
d
ie
=
1
P
i
detA
i
1
2
exp
1
2
(x
e
− ν
i
)
T
A
−1
(x
e
− ν
i
)
where ν
i
is the cluster center, P
i
is the probability
that patient x
e
belongs to the ith cluster and A
i
is
the weighted sample covariance matrix the ith cluster
with membership values being the weighting coeffi-
cients.
3 RESULTS
In order to evaluate the performance of our techniques
we should ideally have the possibility to validate use-
fulness of classification in terms of recovery. How-
ever since in this paper we present only proof of con-
cept that classification is possible we propose to eval-
uate efficacy of classification in two ways: a) by com-
paring variance of each cluster to the quantization
error calculated using empirical histogram of recov-
ery rate distributions and b) by evaluating probabil-
ity of misclassification where we assume that an er-
ror occurs at every instance of discrepancy between
our clusters and histogram defined clusters. The to-
tal number of patients admitted was 203 with general
characteristics being described in Table 1.
In order to illustrate statistical properties of BBS
value for all the patients in Figures 1-3 we illus-
trate histograms at the admission, at the discharge and
three months after discharge. As expected we can ob-
serve shift towards higher values which is expected as
a consequence of rehabilitation. After we performed
correlation analysis using Spearman coefficients we
decided to reduce the number of features for cluster-
ing. To simplify the procedurewe decided to use three
most significant features: age, rate of BBS change
during rehabilitation and severity index.
5 10 15 20 25 30 35 40
0
5
10
15
20
25
30
35
40
45
50
Figure 1: Empirical probability density function of BBS at
the admission.
10 15 20 25 30 35 40 45 50
0
10
20
30
40
50
60
Figure 2: Empirical probability density function of BBS at
the discharge.
In Figure 4 we present the result of the cluster-
ing assuming there are only two groups. The centers
of the clusters are marked with letter x. As expected
fuzzy clustering represents an adequate choice due to
the arbitrarily shaped cluster regions. In Figure 5 we
present the same results when three clusters are used.
Observe that the separation of the clusters in the latter
case is less visible but this is in general true when the
number of clusters is increasing.
The error analysis results are summarized in Ta-
ble 2. In first column we calculate the mean square
5 10 15 20 25 30 35 40 45 50 55
0
5
10
15
20
25
30
35
40
45
Figure 3: Empirical probability density function of BBS
three months after rehabilitation.
BIOSIGNALS 2012 - International Conference on Bio-inspired Systems and Signal Processing
468

65
70
75
80
85
90
95
0
10
20
30
40
10
15
20
25
30
35
40
45
50
55
Age
Rate gradient during rehabilitation
Severity Index
Figure 4: Two group clustering.
65
70
75
80
85
90
95
0
10
20
30
40
10
15
20
25
30
35
40
45
50
55
Age
Rate gradient during rehabilitation
Severity Index
Figure 5: Three group clustering.
error of the cluster relative to the expected quantiza-
tion error for a given data set. In the second column
we calculate the probability of misclassification as ex-
plained above. As expected we observe slightly larger
error for three-clusters scenario which is expected. It
is important to reiterate that in order to truly evaluate
performance we need a clinical study in which the re-
sults of this clustering are applied in clinical decision
making in terms of treatment timelines and rehabili-
tation techniques.
4 CONCLUSIONS
In this paper we demonstrated ability to classify hip
fracture recovery patients admitted to the rehabilita-
tion program. We classified the patients with respect
to the dynamics of their recovery that was inferred
from gradients of Berg Balance Scale which is com-
Table 2: Mean square error and probability of error.
MSE / QE Probability of error
Two clusters 1.21 0.15
Three clusters 1.13 0.23
monly used technique for evaluating balance of the
patients and hence is one of the indicators of the re-
covery degree. Our ultimate goal is to develop clus-
tering algorithms for triage purposes which would al-
low clinical staff and administration to properly plan
treatment program based on the available resources.
As such this approach requires further study in which
the success of recovery between two groups (with and
without clustering based triage) would be monitored.
REFERENCES
Berg, K., Wood-Dauphinee, S., and Williams, J. I. (1995).
The balance scale: Reliability assessment for elderly
residents and patients with an acute stroke. Scand. J.
Rehab. Med., 27:27–36.
Berry, S., Samelson, E., Hannan, M., McLean, R., Lu, M.,
Cupples, L., Shaffer, M., Beiser, A., Kelly-Hayes, M.,
and Kiel, D. (2007). Second hip fracture in older
men and women: the framingham study. Arch. Intern.
Med., 167:1971–1976.
Gath, I. and Geva, B. (1989). Unsupervised optimal fuzzy
clustering. IEEE Trans. on Pattern Analysis and Ma-
chine Intelligence, 11:773–782.
Johnell, O. and Kanis, J. (2004). An estimate of the world-
wide prevalence, mortality and disability associated
with hip fracture. Osteoporosis, 15(5):897–902.
Roche, J., Wenn, R., Sahota, O., and Moran, C. (2005).
Effect of comorbidities and postoperative complica-
tions on mortality after hip fracture in elderly peo-
ple: prospective observational cohort study. BMJ,
331:1374.
Roudsari, B., Ebel, B., Corso, P., Molinari, N., and
Koepsell, T. (2005). The acute medical care costs of
fall-related injuries among u.s. older adults. Injury,
36(1):1316–132.
Santos, G., Souza, A., Virtuoso, J., Tavares, G., and GZ,
M. (2011). Predictive values at risk of falling in phys-
ically active and no active elderly with berg balance
scale. Rev. Bras Fisioter., 15:95–101.
Stevenson, T., Connelly, D., Murray, J., Huggett, D., and
T, O. (2010). Threshold berg balance scale scores for
gait-aid use in elderly subjects: a secondary analysis.
Physioter. Can., 62:133–140.
ANALYSIS OF BERG BALANCE SCALE IN HIP FRACTURE PATIENTS USING FUZZY CLUSTERING
469
