
AUTOMATIC LOCALIZATION OF INDOOR SOCCER PLAYERS
FROM MULTIPLE CAMERAS
∗
Erikson Freitas de Morais, Siome Goldenstein and Anderson Rocha
Institute of Computing, University of Campinas, Campinas, Brazil
Keywords:
Indoor Soccer, Sports Automation, Multiple Camera Observations.
Abstract:
Nowadays, there is an ever growing quest for finding sophisticated performance evaluation tools by team sports
that could give them an additional inch or a quarter of a second of advantage in a competition. Using cameras
to shoot the events of a game, for instance, the teams can analyze the performance of the athletes and even
extrapolate the data to obtain semantical information about the behavior of the teams themselves at relatively
low costs. In this context, this paper introduces a new approach for better estimating the positions of indoor
soccer players using multiple cameras at all moments of a game. The setup consists of four stationary cameras
set around the soccer court. Our solution relies on individual object detectors (one per camera) working in the
image coordinates and a robust fusion approach working in the world coordinates in a plane that represents
the soccer court. The fusion approach relies on a gradient ascent algorithm over a multimodal bidimensional
mixture of Gaussians function representing all the players in the soccer court. In the experiments, we show
that the proposed solution improves standard object detector approaches and greatly reduces the mean error
rate of soccer player detection to a few centimeters with respect to the actual positions of the players.
1 INTRODUCTION
With the popularization and low cost of camcorders,
the shooting of entire games involving team sports has
become an important aid to coaches and the technical
staff of a team. A game shooting contains all the ath-
letes’ correct and wrong moves on a given game. A
specialized staff team can evaluate and annotate the
videos to classify the most important moves of in-
terest. For instance, after annotating the events of a
game it would be possible to: plot charts depicting the
number of missed passes by team or individual player;
view correctly executed moves and also the badly ex-
ecuted ones; or even point out bad positioning during
the game. Such annotations feed the technical com-
mittee with invaluable information for improving the
team for future matches.
The use of camcorders to record team sports
games can be greatly enhanced by the use of multi-
ple cameras under different points of view. Missing
information in the point of view of a given camera
can be compensated by other views in different cam-
eras. The redundant information can also help to bet-
ter estimate the measures and achieve more reliable
∗
We thank the financial support of Microsoft Research,
FAPESP and CNPq (Grant 141054/2010-7).
conclusions regarding the games.
In this context, this paper’s objective is to estimate
the positions of indoor soccer players at every mo-
ment of a given game using multiple cameras. This
task is the first one towards more sophisticated trajec-
tory analysis for each individual player.
The problem we address in this paper consists of
a setup with four cameras around an indoor soccer
court. Figure 1 shows a frame under each point of
view while Figure 2 depicts the camera positioning
around the soccer court and the different points of
view.
To deal with this problem, all the information we
have consist of the captured videos and a map of the
soccer court containing some points of interest such
as the penalty marks, the center and the corners. The
coordinates in such interest points are important to al-
low us to find a homography matrix mapping image
coordinates to world coordinates. For each camera,
we need to find a transformation to lead the detections
in the image coordinates to the world coordinates we
are interested in.
The contribution of this paper relies on the ap-
proach we use to project the different detections from
different cameras (which are in image coordinates) to
world coordinates and fuse them in order to take ad-
205
Freitas de Morais E., Goldenstein S. and Rocha A..
AUTOMATIC LOCALIZATION OF INDOOR SOCCER PLAYERS FROM MULTIPLE CAMERAS.
DOI: 10.5220/0003877602050212
In Proceedings of the International Conference on Computer Vision Theory and Applications (VISAPP-2012), pages 205-212
ISBN: 978-989-8565-03-7
Copyright
c
2012 SCITEPRESS (Science and Technology Publications, Lda.)
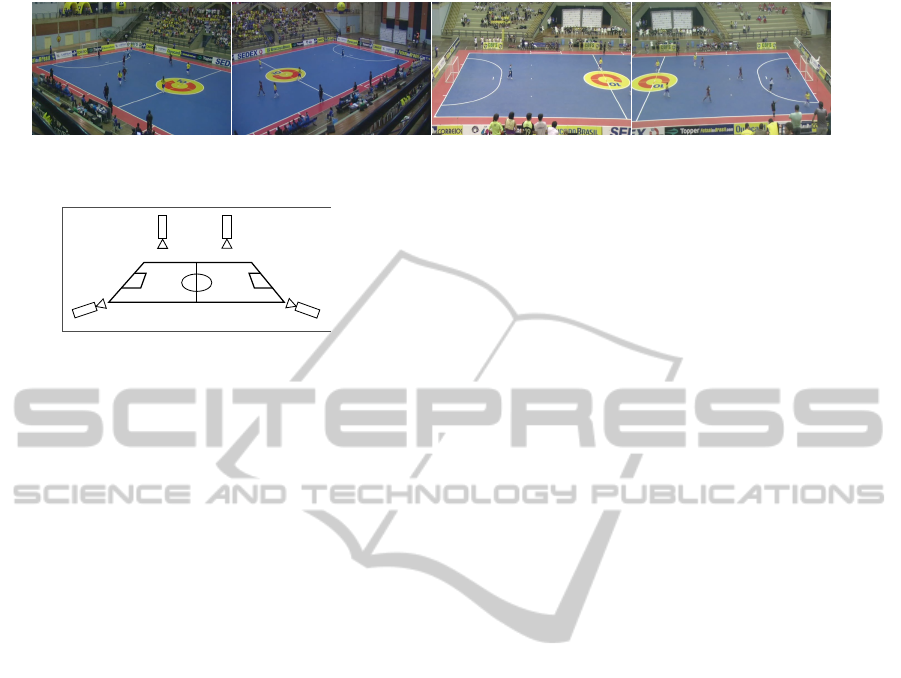
Figure 1: The four camera setup in this work and their four different points of view.
Figure 2: The camera positioning around the indoor soccer
court. Each camera’s field of view is set up to cover half
a court allowing an overlapping in the center region of the
court. In this setup, each player is covered by, at least, two
cameras.
vantage of the multiple cameras and subsequent re-
dundant information. For this, we represent the in-
door soccer court as a bidirectional and multimodal
probability function of a given player be detected in
a given position. For fusion, each projected point is
transformed in a Gaussian and the player positions in
world coordinates are found by means of a gradient
ascent algorithm.
The rest of this paper is organized as follows. Sec-
tion 2 shows the related methods for detecting objects
in images with an emphasis on the most cited works .
Section 3 presents the details of our contribution and
explains its different stages: observation, projection
and localization. Section 4 shows comparative exper-
iments and results using the proposed approach with
respect to a classical method in computer vision with
the highest number of citations in the last 10 years.
Finally, Section 5 wraps up the paper and discusses
future directions of the work.
2 RELATED METHODS
Automatic people detection in images is a problem
widely investigated by the scientific community. The
reason is the high number of possible applications
such as security and monitoring environments and
pedestrian counting. Image analysis techniques as a
tool for aiding team sports such as indoor soccer have
also increased in the last years raising the interest of
the scientific community for developing better tools
and solutions.
The literature presents some works in this line
with the same objectives.We have found detection of
objects of interest (players) by means of background
subtraction using approaches (Kang et al., 2003;
Hamid et al., 2010; Ming et al., 2009; Khan and
Shah, 2006) as the work of Stauffer and Grim-
son (Stauffer and Grimson, 1999), or by using color
histograms to eliminate the predominant colors
(Tong et al., 2011). Another approach uses a fixed
background model calculated periodically (Figueroa
et al., 2006). The work of Alahi et al. (Alahi et al.,
2009) performs detection of basketball players based
on silhouettes in omnidirectional cameras.
In some cases, the detection needs adjustments,
like shadows elimination (Hamid et al., 2010). In that
case, the authors use homograph to project image
blobs onto other cameras and eliminate pixels with
similar values. Kang et al. (Kang et al., 2003) also
use homograph, however, the objective is to construct
a global map of probability for the foreground. Some
works also use the localized positions to integrate
trajectories (Alahi et al., 2009; Khan and Shah,
2006), others use Kalman Filters (Hamid et al., 2010;
Kang et al., 2003) or Markov Chain Monte Carlo
(MCMC) to perform tracking (Tong et al., 2011).
Some works present approaches based on graphs to
determine positions and track objects (Hamid et al.,
2010; Figueroa et al., 2006).
Different from previous approaches, according to
the Computer Vision point of view, we can handle the
problem of detecting players in a game as an object
detection problem in which each player is an object to
be detected. In this sense, Viola and Jones (Viola and
Jones, 2001) proposed a real time object detection
method that represents a breakthrough in the com-
puter vision research in the last 10 years. The original
work was focused on face detection but the extension
to different objects (e.g., people) is straightforward.
Complementing the vision approach repre-
sented by Viola and Jones methods, Felzenszwalb
et al. (Felzenszwalb et al., 2010) introduced another
method for object detection based on multi-scale de-
formable parts. Similar to Viola and Jones’ method,
this approach also requires a training set with positive
and negative examples of the object of interest. The
method decomposes the objects into multiple scales
VISAPP 2012 - International Conference on Computer Vision Theory and Applications
206

and capture local appearance details of the objects
of interest while connecting the parts by means of a
deformable model.
Two questions with respect to the previous
approaches are: how to perform the object detection
without the need for background separation and
also how to take advantage of multiple camera
detections at relative low computational cost. In
this paper, rather than using color information or
background subtraction operations, we use a simple
and well known Viola and Jones (Viola and Jones,
2001) object detector method for detecting objects
of interest (e.g., the players) in each camera. This
method works based on patterns present in the objects
instead of color information and quickly finds objects
in the images. In addiction, we propose a new form
for combining observations from multiple different
cameras (in our case four cameras) taking advantage
of possible redundant information.
3 INDOOR SOCCER PLAYER
DETECTION FROM MULTIPLE
CAMERAS
In this section, we present our approach for indoor
soccer player detection from multiple cameras. The
approach is divided into three stages as Figure 3 de-
picts. We present each stage in more details in the
next sections.
1. Stage #1 independently detects the players in the
image plane of each camera. This stage can use
any object detector trained for detecting indoor
soccer players. In this paper, we use the Vi-
ola and Jones (Viola and Jones, 2001) detector.
2. Stage #2 projects the observed objects (players)
of the previous stage onto a plane representing
world coordinates. We refer to this plane as world
plane as it is a representation of the actual soccer
court.
3. Stage #3 combines the different projections using
a bidimensional multimodal probability function
representing the potential player positions in the
soccer court. It employs a gradient ascent algo-
rithm to find the most probable soccer player can-
didate positions among the different observations
in the world plane.
C1 C1 C1C1
1
∑
x x x x x x x ...
y y y y y y y ...
z z z z z z z ...
2
3
4
Figure 3: The proposed approach and its three stages. (1)
independent detection; (2) projection of the observations
from the image plane to the world plane; (3) representation
of the observation in a multimodal bidirectional probability
function and determination of the most probable positions
(numbers 3 and 4 in the figure).
3.1 Stage #1 – Independent Image Plane
Observations
To detect the indoor soccer players from multiple
cameras, we first need to independently detect the
players in the image plane of each camera and build
an observation model. For this task, we can use
several different object detectors such as (Viola and
Jones, 2001; Felzenszwalb et al., 2010). In this paper,
we use the Viola and Jones (Viola and Jones, 2001)
object detector trained with indoor soccer players.
This is a classical method with high-citation count in
the computer vision literature. In addiction, it has a
simple training (though relatively slow), it is open-
source and also with no patents attached.
3.1.1 The Viola and Jones Detector
Viola and Jones (Viola and Jones, 2001) presented an
approach based on Haar-filters and on an Adaboosting
machine learning algorithm to detect objects in im-
ages. Initially, the authors focused on face detection.
The extension of the detector to other types of objects
(e.g., people) is straightforward. For that, the require-
ment is to obtain enough training examples represent-
ing people vs. non-people images for a new training
procedure.
The Viola and Jones detector relies on simple fea-
tures known as Haar-like features. A Haar-like fea-
ture is calculated using sums and differences as Fig-
ure 4 depicts.
The method uses sliding windows of size 24 ×24
pixels to detect faces. Within each window, there
are more than 180,000 possible features with differ-
ent sizes and orientations. For fast sum and difference
calculations, the authors propose the concept of inte-
gral images. An integral image is an image with the
AUTOMATIC LOCALIZATION OF INDOOR SOCCER PLAYERS FROM MULTIPLE CAMERAS
207

Figure 4: Example of Haar-features of two, three and four
rectangles. The value of a feature is given by the difference
of the sum of pixel values in the regions with different col-
ors. In this case, the value of the feature is given by the
difference between the black and white region.
same dimensions of the original image but each point
represents the sum of every pixel above and to the left
of the current pixel position
ii(x, y) =
∑
x
0
≤x,y
0
≤y
i(x
0
, y
0
). (1)
We can calculate the integral image ii with only
one pass over each image pixel. With this integral im-
age, we can calculate the summation of a given rect-
angle feature with only three accesses to the integral
image.
The authors propose to view the Haar-like features
as weak classifiers. For that, they use the Adaboost
algorithm to select the best features among the more
than 180,000 possible ones. For each weak classi-
fier, the Adaboosting training algorithm determines
the best threshold that results the lowest classification
error for object and non-object classes. A weak clas-
sifier h
j
(x) is given by a feature f
j
, a threshold θ
j
and
a polarization (+/-) p
j
h
j
(x) =
1 if p
j
f
j
(x) < p
j
θ
j
0 otherwise.
(2)
where x is a 24 ×24-pixel image region. For each
weak classifier selection, the most appropriate feature
is selected and receives a weight associated with each
training sample evaluated.
With several weak classifiers, it is possible to
combine them to build a strong classification proce-
dure. The authors propose this combination using a
cascade setup. In a cascade classifier scheme, the out-
come of one classifier is the input the next one giving
rise to a strong classifier as Figure 5 depicts.
1 2 3 4
T T T
F F F F
Figure 5: Viola and Jones (Viola and Jones, 2001) cascade
of classifiers. Each weak classifier classifies such sub image
to detect whether or not it has the object of interest. If a sub
image passes over all the classifiers, it is tagged as having
the object of interest.
3.2 Stage #2 – Observation Projection
onto the World Plane
The result of each detector for each camera represents
object observations in the image world for each cam-
era. However, we are interested in the soccer player
localization in the world plane that represents the ac-
tual soccer court in which the players are. The world
plane is represented in 3D coordinates. As we men-
tioned before, we have some control points in the
soccer court whose location we know a priori (e.g.,
penalty marks and corner marks). With such points,
we can use a video frame in a camera to find such
correspondences manually.
The homography maps the coordinates between
the planes. In our case, the objects of interest move on
the soccer court and, therefore, are always on a plane
in the 3D world. We can use the homography of spe-
cific points of the object detections (e.g., the foot of a
player) to find their localization in the world coordi-
nates.
Each player as found by a detector is represented
by a rectangle in the image plane of a given camera.
In our work, we consider the midpoint of the basis of
such rectangle as a good representation of a player’s
feet in the image plane. As we expect, the estimation
of the player’s feet position is not perfect and conse-
quently its projection to the world coordinates does
not represent the exact point in which the player is
at. In addition the the detector error, the homography
also contains intrinsic errors.
After the projection, we can have more than one
point associated with the same player and we need a
fusion approach to better estimate the player positions
taking advantage of the multiple camera detections.
3.3 Stage #3 – Multiple Camera Fusion
After the detection of the players from multiple cam-
eras, we have a set of observations in the image plane
of each camera (each rectangle represents the detec-
tion of a player in a given camera). Assuming that
the midpoints in the base of each rectangle is a good
choice for the localization of the players’ feet, we
project such midpoints onto the world plane (repre-
senting the soccer court) using the homography ma-
trix related to the camera under consideration.
Due to detection as well errors in projections,
these points do not correspond to the exact localiza-
tion of the players. However, the projected points are
a good estimation for the player’s localization in a re-
gion.
With possibly more than one detection per player
as well as with possible projection errors, the question
VISAPP 2012 - International Conference on Computer Vision Theory and Applications
208
is how to best estimate the players’ position. This pa-
per’s contribution goes in this direction. For this, we
represent the world plane (soccer court) as a mixture
of Gaussians whose parameters vary according to the
source camera of a projection. The parameters (mean
and covariance) of a Gaussian function for each cam-
era can be calculated from one or two short video se-
quences serving as training examples.
For finding the Gaussian parameters, we can use
annotated training sequences with the players’ posi-
tions marked with the assistance of a human. These
annotations are used to measure the error related to
the projections of each point onto the world plane.
With this, we calculate the average error in x and y di-
rections and the covariance matrix for the camera pro-
jection to represent each point projection as a Gaus-
sian function.
To calculate such measures, we need to make the
linking among the annotated points and the detected
points. We assume a projected point corresponds to
the closest annotated point in the world plane. In
some cases, for instance when several players are
close together, this assumption is not good. To al-
leviate this, during training, we choose a training
sequence in which the players are reasonably sepa-
rated in the soccer court. This means that a detec-
tion has one closest point easily identifiable and its
second closest point is relatively distant. We choose
all the cases in which the closest correspondences to
the annotations are within a radius L
1
≤ 2 meters and
the second closest correspondences are farther than
L
2
≥ 3 meters.
With this representation, each projected point is
represented as a 2D Gaussian center in the position
of the projected point corrected by the average error
and the calculated covariance matrix corresponding to
the source camera in question. With all points repre-
sented the same way, we have a unique function rep-
resenting the entire soccer court which gives us the
probability of the position of each player in the court.
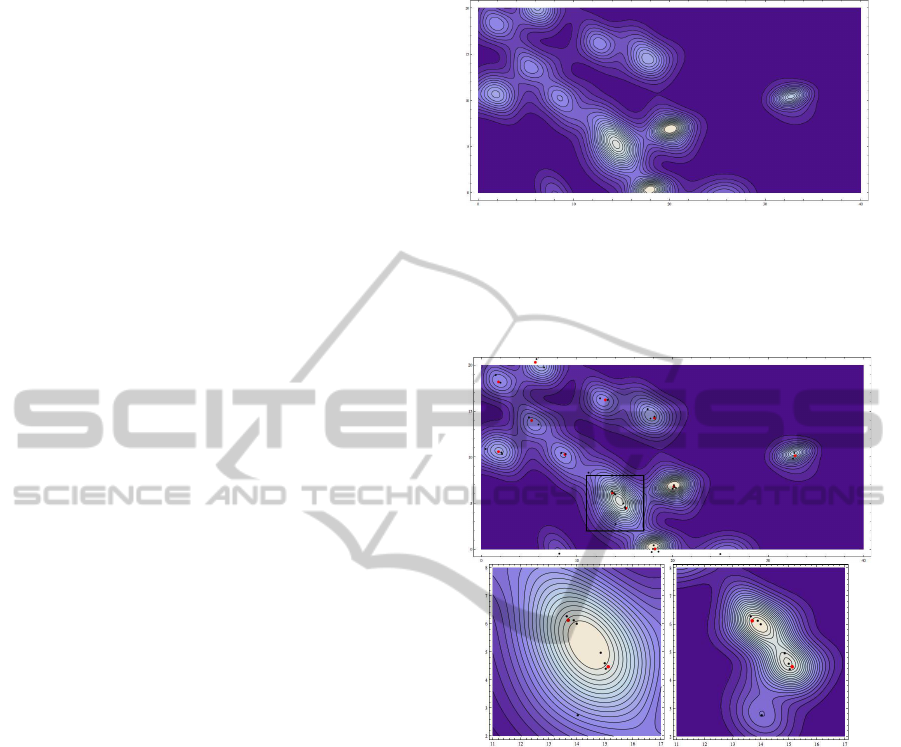
Figure 6 depicts an example of such function.
Figure 7 depicts one case with several players rel-
atively close to one another. In this case, the corre-
sponding Gaussian functions are also close together.
Consequently, close peaks are merged. The reason
is that the covariance matrices yield wide base Gaus-
sians. To diminish such effects, we can multiply the
covariance matrices for a fixed scale factor resulting
in a multimodal function with well defined peaks. In
this paper, we fix such a scale parameter in 0.2 for all
experiments.
For analysis of new sequences, a probability func-
tion is formed for each new video frame based on the
projections from multiple cameras. The most proba-
Figure 6: 2D probability function example. The multiple
camera projections are replaced by Gaussian functions with
parameters obtained during training. This function gives
the probability of having a player in a given position (repre-
sented with contours in this figure).
Figure 7: Contour around the points of interest. Red dots
represent ground truth annotations. Black dots represent
projections from the four cameras with no distinction. On
top, we have the whole function surface. On the left, we
have a zoom in the selected region with players close to-
gether. On the right, we have the same region with the co-
variance matrices multiplied by a fixed scale factor of 0.2.
ble positions correspond to the real-world positions
likely to contain players and are equivalent to the
peaks represented in Figure 6.
3.3.1 Determining the Player Positions using
Gradient Ascent
With the devised function, we need a method to find
the closest peak of a projected point. For this, we can
use a simple gradient ascent algorithm. In a mixture
of Gaussians, the gradient of the composite function
is given by the vector sum of the partial gradients. We
can calculate the gradient as in Eq. 3
AUTOMATIC LOCALIZATION OF INDOOR SOCCER PLAYERS FROM MULTIPLE CAMERAS
209

5F = 5G
1
+ 5G
2
+ . . . + 5G
n
. (3)
The partial gradients need to be calculated sepa-
rately. Let Σ be a covariance matrix, µ the average
and X the point for which we are interested in calcu-
lating the probability.
Σ =
σ
1
σ
2
σ
3
σ
4
, X =
x
y
, µ =
µ
x
µ
y
. (4)
The Gaussian function G(X) is given by
G(X) =
1
p
2π|Σ|
e
−
1
2
[X−µ]
T
Σ
−1
[X−µ]
, (5)
where we find the exponent B and the factor F accord-
ing to
B = −
1
2
[X −µ]
T
Σ
−1
[X −µ] e F =
1
√
2π|Σ|
, (6)
allowing us to re-write Eq. 5 as
G(X) = Fe
B
, (7)
and its gradient as
5G(X) =
Fe
B
dB
dx
, Fe
B
dB
dy
. (8)
The derivative
dB
dx
depends on the inverse of the
covariance matrix Σ
−1
. In our case, we have a 2 ×2
covariance and by using the adjoint matrix we obtain
the inverse
Σ
−1
=
1
|Σ|
·ad j (Σ) (9)
=
1
|Σ|
·
σ
4
−σ
2
−σ
3
σ
1
. (10)
Replacing Eq. 9 into Eq. 6, we obtain:
B = −
1
2 ·|Σ|
x
2
σ
4
+ y
2
σ
1
−xy(σ
3
+ σ2)
(11)
and hence the derivatives in x and y axis are
dB
dx
= −
1
2·|Σ|
(2xσ
4
−y(σ
3
+ σ
2
))
dB
dy
= −
1
2·|Σ|
(2yσ
1
−x(σ
3
+ σ
2
))
(12)
We can find the players’ positions by looking for
the local maxima following the gradient. Each pro-
jected point onto the world plane converges to its clos-
est peak according to this representation. As more
than one camera can detect the same player it is rea-
sonable to assume that the points representing such
detections converge to the same peak. After the anal-
ysis, each peak corresponds to the most likely players’
positions in the court.
4 EXPERIMENTS AND
METHODOLOGY
Our method consists of a training phase responsible
for calibrating the parameters representing the prob-
lem in question and a testing phase responsible for
finding the players taking advantage of multiple cam-
eras.
We use seven Full-HD games each one shot with
four cameras according to the camera setup depicted
in Figure 2. Each game has the first and second times
(common in soccer games). For simplicity, we con-
sider each time as a game. Therefore, we have 14
games in total.
The games were shot during the 2009 South
American Women Indoor Soccer Championship that
took place in Brazil. All the videos were resampled at
720 ×480 pixels.
We separate one of the 14 games (4 videos) for
training and parameter calculation as described in the
previous section. One time of a game consists of 20
minutes of shooting per camera at 30 frames per sec-
ond (36,000 frames). The remaining 13 games (4×13
videos) were used for testing.
To compare the detections and evaluate their qual-
ity, we annotate the real players’ positions on the
videos by hand for each frame. We used the method
proposed by (Figueroa et al., 2006) for aiding in the
annotation process an construct a baseline. We have
ground truth annotations for the 10 players plus the
two referees for one minute for each of the games.
The game used for training was entirely annotated (20
minutes).
The first step of the proposed method consists of
training the object detectors for finding soccer play-
ers. This training was performed using positive and
negative samples from the training video sequence.
The set of positive samples consists of rectangles
around players as seen by the four cameras. We used
approximately 16,000 positive samples. The nega-
tive samples consist of any rectangle not containing a
player. We used approximately 18,000 negative sam-
ples.
After the training of the detector, we perform the
training of the proposed approach for calibrating the
parameters related to the multimodal function rep-
resenting the soccer court as we discussed in Sec-
tion 3.3. As we mentioned, we used the first game
sequence for this intent.
We compare our method to the detection us-
ing each isolated camera using the standard Vi-
ola and Jones (Viola and Jones, 2001) with no fusion.
For each detection, we calculate the Euclidean dis-
tance to the annotation representing the real player’s
VISAPP 2012 - International Conference on Computer Vision Theory and Applications
210
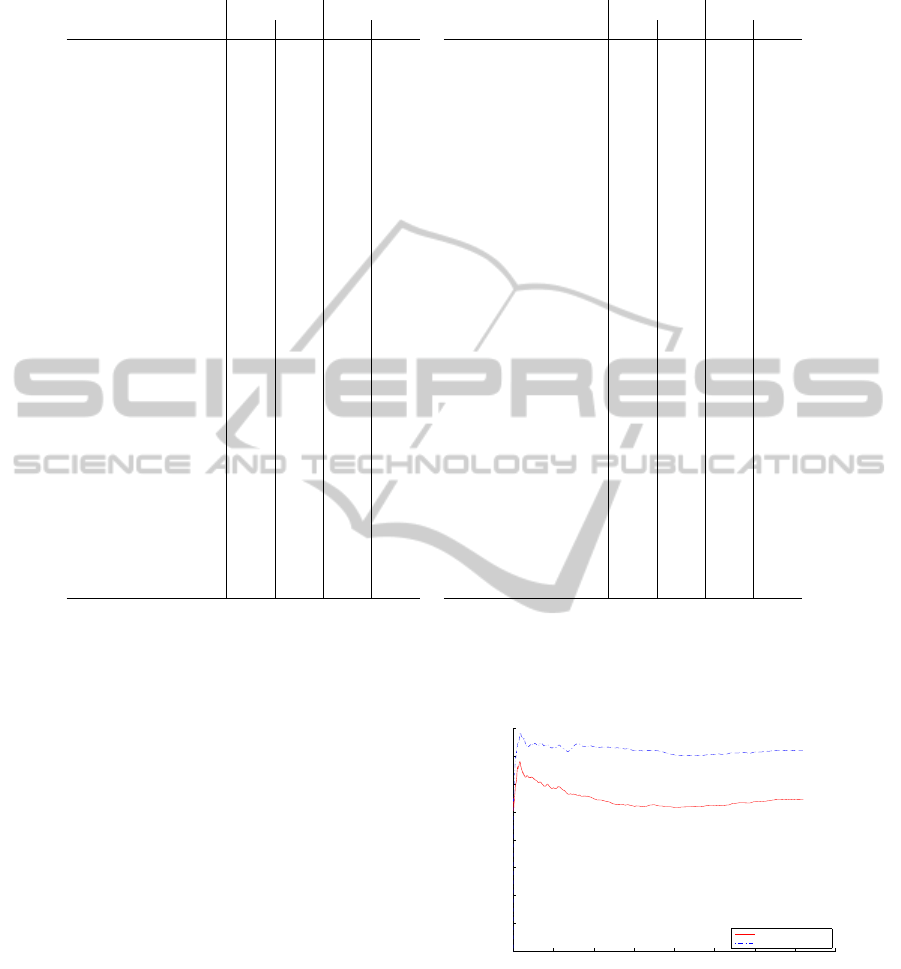
Table 1: Average error and standard deviation per camera.
Game
Fusion No Fusion
µ σ µ σ
BoliviaxColombia-c0-t1 0.58 0.13 0.73 0.16
BoliviaxColombia-c1-t1 0.68 0.19 0.78 0.20
BoliviaxColombia-c2-t1 0.75 0.24 0.88 0.21
BoliviaxColombia-c3-t1 0.53 0.14 0.65 0.15
BoliviaxColombia-c0-t2 0.65 0.21 0.77 0.21
BoliviaxColombia-c1-t2 0.76 0.18 0.91 0.19
BoliviaxColombia-c2-t2 0.54 0.13 0.72 0.13
BoliviaxColombia-c3-t2 0.76 0.20 0.91 0.20
BrasilxArgentina-c0-t1 0.71 0.21 0.83 0.20
BrasilxArgentina-c1-t1 0.74 0.27 0.79 0.27
BrasilxArgentina-c2-t1 0.72 0.24 0.81 0.24
BrasilxArgentina-c3-t1 0.55 0.16 0.63 0.15
BrasilxArgentina-c0-t2 0.84 0.27 0.91 0.25
BrasilxArgentina-c1-t2 0.63 0.19 0.68 0.19
BrasilxArgentina-c2-t2 0.82 0.24 0.90 0.23
BrasilxArgentina-c3-t2 0.79 0.25 0.89 0.23
BrasilxColombia-c0-t1 0.78 0.21 0.82 0.20
BrasilxColombia-c1-t1 0.81 0.23 0.90 0.23
BrasilxColombia-c2-t1 0.78 0.25 0.90 0.22
BrasilxColombia-c3-t1 0.80 0.21 0.84 0.21
BrasilxColombia-c0-t2 0.81 0.22 0.87 0.19
BrasilxColombia-c1-t2 0.77 0.21 0.81 0.19
BrasilxColombia-c2-t2 0.88 0.27 1.00 0.26
BrasilxColombia-c3-t2 0.67 0.19 0.79 0.19
BrasilxPeru-c0-t1 1.10 0.35 1.12 0.32
BrasilxPeru-c1-t1 0.66 0.19 0.73 0.20
BrasilxPeru-c2-t1 0.64 0.20 0.74 0.19
BrasilxPeru-c3-t1 1.06 0.36 1.10 0.30
Game
Fusion No Fusion
µ σ µ σ
BrasilxPeru-c0-t2 0.97 0.25 1.03 0.22
BrasilxPeru-c1-t2 0.89 0.23 0.93 0.22
BrasilxPeru-c2-t2 0.98 0.23 1.01 0.21
BrasilxPeru-c3-t2 0.91 0.22 0.96 0.19
BrasilxVenezuela-c0-t1 0.50 0.15 0.66 0.17
BrasilxVenezuela-c1-t1 0.58 0.25 0.82 0.24
BrasilxVenezuela-c2-t1 0.36 0.18 0.53 0.17
BrasilxVenezuela-c3-t1 0.45 0.14 0.52 0.14
BrasilxVenezuela-c0-t2 0.81 0.64 0.85 0.65
BrasilxVenezuela-c1-t2 0.95 0.59 0.89 0.61
BrasilxVenezuela-c2-t2 0.79 0.61 0.83 0.64
BrasilxVenezuela-c3-t2 0.67 0.67 0.67 0.68
ColombiaxUruguai-c0-t1 0.90 0.27 1.04 0.25
ColombiaxUruguai-c1-t1 0.77 0.24 0.93 0.23
ColombiaxUruguai-c2-t1 0.56 0.16 0.65 0.16
ColombiaxUruguai-c3-t1 0.74 0.25 0.71 0.23
ColombiaxUruguai-c0-t2 0.73 0.16 0.89 0.17
ColombiaxUruguai-c1-t2 0.78 0.19 0.86 0.21
ColombiaxUruguai-c2-t2 0.86 0.24 0.93 0.23
ColombiaxUruguai-c3-t2 0.63 0.16 0.62 0.13
PeruxBolivia-c0-t1 0.68 0.25 0.77 0.25
PeruxBolivia-c1-t1 0.79 0.25 0.81 0.25
PeruxBolivia-c2-t1 0.94 0.30 1.03 0.28
PeruxBolivia-c3-t1 0.77 0.35 0.87 0.30
PeruxBolivia-c0-t2 0.71 0.23 0.80 0.24
PeruxBolivia-c1-t2 0.84 0.26 0.80 0.24
PeruxBolivia-c2-t2 0.93 0.29 1.00 0.32
PeruxBolivia-c3-t2 0.80 0.28 0.86 0.26
position. The smaller the distance the better the de-
tection.
When we use only the detectors separately, we
project the detections in the image plane of one cam-
era onto the world coordinates and each projection is
treated independently. When we use the proposed ap-
proach, all the detections from the four different cam-
eras are projected onto the world plane and the points
are combined using the proposed multimodal function
and gradient ascent method. In both cases, each point
in the end is compared to the closest annotated point
for determining the detection error.
The distance between an actual position and a de-
tection measures the estimation error and it is mea-
sured in meters. Figures 8 and 9 show the best
and worst case when comparing both detection ap-
proaches (with and without multiple camera fusion).
In both cases, we show the average error in each test-
ing frame. We calculate the error for each camera sep-
arately given that the projection errors are different for
each camera.
Table 1 shows the final average errors and stan-
dard deviation per video per camera. In most cases
our approach improves the players’ localization com-
pared to the approach with no fusion demonstrating
the potential of fusion for helping further analysis
such as tracking of players.
0 500 1000 1500 2000 2500 3000 3500 4000
0
0.1
0.2
0.3
0.4
0.5
0.6
0.7
0.8
BoliviaxColombia
frames
average distance in meters
Gradient −− µ = 0.54
Projection −− µ = 0.72
Figure 8: Estimation average error. The curve shows the
average error across the concatenated frames of different
test video sequences considering one camera. The figure
shows one case in which our approach is significantly better
than the approach with no fusion.
AUTOMATIC LOCALIZATION OF INDOOR SOCCER PLAYERS FROM MULTIPLE CAMERAS
211

0 500 1000 1500 2000 2500 3000 3500 4000
0
0.2
0.4
0.6
0.8
1
1.2
1.4
1.6
1.8
BrasilxVenezuela
frames
average distance in meters
Gradient −− µ = 0.67
Projection −− µ = 0.67
Figure 9: Estimation average error. The curves show the
average error across the concatenated frames of different
test video sequences considering one camera. The figure
shows a case in which both detection approaches are not
statistically different.
5 CONCLUSIONS
In this paper, we presented an approach for estimating
the players’ positions in all moments of indoor soccer
games. For that, we observe stationary cameras set up
around the soccer court.
The obtained results show the potential of the pro-
posed approach as it reduces the error of the detected
position of players and represents a possible aid for
further tasks such as tracking the players.
The proposed approach uses a simple object de-
tector for each camera and projects different detec-
tions onto a world plane representing the soccer court.
The approach then fuses the observations by means of
a bidimensional multimodal function with parameters
calculated during training. The training is fairly sim-
ple and requires only one video sequence per camera.
The best players’ positions are given by a gradient as-
cent algorithm applied over the calculated Gaussian
function. The results show the detections are only
a few centimeters off their real positions with small
standard deviation and improves the detection when
compared to an approach with no fusion.
Future work includes performing the tracking of
the players. For that we intend to use the multi-
modal probability function as an observation model
for a particle filter allowing us to consistently track
the players using multiple cameras.
REFERENCES
Alahi, A., Boursier, Y., Jacques, L., and Vandergheynst,
P. (2009). Sport player detection and tracking with
a mixed network of planar and omnidirectional cam-
eras. In ICDSC.
Felzenszwalb, P., Girshick, R., McAllester, D., and Ra-
manan, D. (2010). Object detection with discrimina-
tively trained part based models. PAMI, 32(9):1627–
1645.
Figueroa, P., Leite, N., and Barros, R. (2006). Tracking soc-
cer players aiming their kinematical motion analysis.
CVIU, 101(2):122–135.
Hamid, R., Kumar, R., Grundmann, M., Kim, K., Essa, I.,
and Hodgins, J. (2010). Player localization using mul-
tiple static cameras for sports visualization. In CVPR,
pages 731–738.
Kang, J., Cohen, I., and Medioni, G. (2003). Soccer player
tracking across uncalibrated camera streams. In VS-
PETS, pages 172–179.
Khan, S. and Shah, M. (2006). A multiview approach to
tracking people in crowded scenes using a planar ho-
mography constraint. In ECCV.
Ming, Y., Guodong, C., and Lichao, Q. (2009). Player de-
tection algorithm based on gaussian mixture models
background modeling. In ICINIS.
Stauffer, C. and Grimson, W. (1999). Adaptive background
mixture models for real-time tracking. In CVPR, vol-
ume 2, pages 252–260.
Tong, X., Liu, J., Wang, T., and Zhang, Y. (2011). Au-
tomatic player labeling, tracking and field registra-
tion and trajectory mapping in broadcast soccer video.
ACM TIST, 2(2).
Viola, P. and Jones, M. (2001). Rapid object detection us-
ing a boosted cascade of simple features. In CVPR,
volume 1, pages 511–518.
VISAPP 2012 - International Conference on Computer Vision Theory and Applications
212
