
Effect of Two Doses of Dexmedetomidine on Index of
Consciousness and Permutation Entropy in Rabbits
Aura Silva
1
, Almir P. Souza
2
, Carlos Venâncio
1
, David A. Ferreira
1
and Luis Antunes
1
1
Universidade de Trás-os-Montes e Alto Douro, Quinta de Prados
5001-803, Vila Real, Portugal
2
Universidade Federal de Campina Grande, Patos, Brazil
Abstract. The Index of Consciousness (IoC) and the Permutation Entropy (PE)
are the most recent EEG-based indexes for depth of anesthesia monitoring but
their use during ketamine or dexmedetomidine anesthesia has never been re-
ported. In this study, the ability of these measures o differentiate between the
effects of two different doses of dexmedetomidine combined with a fixed dose
of ketamine in rabbits was studied.
Five adult female rabbits received one of two ketamine/dexmedetomidine com-
binations (15/0.025 and 15/0.05 mg/kg: G0.025 and G0.05, respectively). The
effect of the two doses on IoC and PE were compared.
The effect of dexmedetomidine dosage on the EEG was not significantly differ-
ent between groups for any of the studied indexes (IoC (p=0.058); PE
(p=0.392)). Only the IoC showed a significantly lower value in G0.05 than
G0.025 at T15. The analysis revealed a significant effect of time on the IoC
(p=0.001) and PE (p=0.0195).
IoC and PE did not decrease to values correspondent to the anesthetized state,
as was expected regarding previous works. This may be explained by the
known excitatory effects of ketamine on the EEG. However, the tendency of the
indexes to decrease after induction and to be lower in the animals that received
the higher dexmedetomidine dosage suggests the capacity of these parameters
to detect depressant effects of alpha-2-agonists.
1 Introduction
Ketamine is widely used in veterinary practice for anesthesia, sedation, and analgesia.
The cardiovascular and respiratory stability associated with its administration, the fact
that it is well absorbed by different administration routes and its adequacy to be used
in different animal species, make it a very safe and practical drug [3-4]. It causes a
state of dissociation, rather than unconsciousness or hypnosis, by blocking the activa-
tion of non-competitive N-methyl-D-aspartate (NMDA) receptors [5]. This state is
characterized by sensory loss, analgesia and amnesia. However, muscular tonus pers-
ists which may be a limitation during surgery. Ketamine is often associated with al-
pha-2-agonists to produce general anesthesia in animals [6]. In the past, xylazine and
medetomidine were the most used alfa-2-agonist drugs. Medetomidine is a potent,
selective, and specific alpha 2-adrenoceptor agonist that compensates for the poor
muscle relaxant and analgesic effects of ketamine, while the cardiac stimulating pro-
Silva A., P. Souza A., Venâncio C., A. Ferreira D. and Antunes L..
Effect of Two Doses of Dexmedetomidine on Index of Consciousness and Permutation Entropy in Rabbits.
DOI: 10.5220/0003879100430050
In Proceedings of the International Workshop on Veterinary Biosignals and Biodevices (VBB-2012), pages 43-50
ISBN: 978-989-8425-94-2
Copyright
c
2012 SCITEPRESS (Science and Technology Publications, Lda.)

perties of ketamine partially compensate the medetomidine-induced bradycardia [6].
More recently, dexmedetomidine was introduced in human and veterinary anesthesia.
It is an isomer of medetomidine that when administered at half the dose, induces simi-
lar effects as medetomidine [7]; [8].
EEG-derived indexes have become popular as a method to assess DoA in human
patients. These indexes are derived from the EEG by mathematical algorithms and
some are available in the form of commercial monitors [9]. The bispectral index (BIS)
is the most widely known of these monitors. Several studies in animals tried to assess
the potential of this monitor to reflect DoA in animals, however, results are generally
contradictory and the fact that the BIS calculation incorporates an extensive database
of EEG’s from anesthetized humans may limit its application in animals [10]. More
recently, methods based in the analysis of non-linear time series were introduced. The
Index of Consciousness (IoC) is a commercial index based in symbolic dynamics for
the derivation of a number from the EEG that correlates with the DoA of humans
[11]. By the other side, Permutation Entropy (PE) is an open-source parameter which
showed a high resistance to artifacts and a good capacity to reflect DoA during sevof-
lurane and propofol anesthesia in humans [11] and had better performance than other
parameters during isoflurane and propofol anesthesia in rabbits [1]; [2] and rats [12].
No reports on the use of these indexes during ketamine administration are available,
neither in humans or animals. It has been shown that ketamine produces excitation of
the EEG, and has been associated with a pronounced increase in DoA indexes, such
as the BIS and parameters derived from the power spectrum [10]. By the other hand,
alpha-2-agonists produce depression of the cortical activity causing decreases in
EEG-derived indexes [10].
In this work, the capacity of IoC and PE to detect different doses of dexmedeto-
midine combined with a fixed dose of ketamine was evaluated in rabbits.
2 Methods
Five adult female New Zealand White rabbits weighting 4.2+ 0.85 kg received one of
two ketamine/dexmedetomidine combinations (15/0.025 and 15/0.05 mg/kg: G0.025
and G0.05, respectively) given by intramuscular injection on two successive occa-
sions with a 15 day interval.
2.1 Brain Waves Recordings
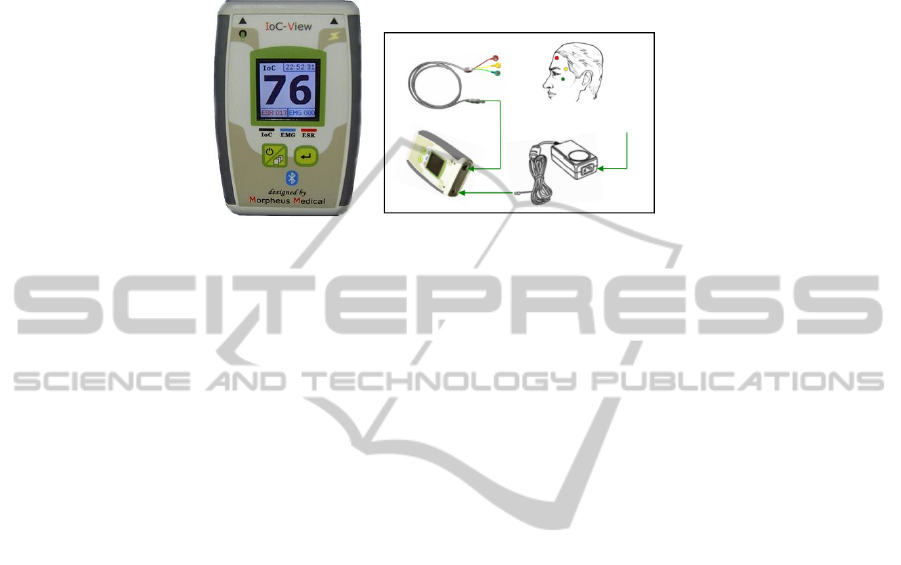
Extracranial EEG was recorded with electrodes placed non-invasively on the rabbits
head skin using the IoC-View monitor (Aircraft Medical (Barcelona), Barcelona,
Spain) (Fig. 1).
The IoC-View monitor electrodes were placed directly on the head skin after care-
ful preparation. In the fully awake animals, the heads were shaved, cleaned, and sur-
face layers removed with fine sandpaper and acetone. The electrodes used were pre-
gelled single-use silver/silverchloride electrodes with liquid gel and the surrounding
adhesive made of medical-grade acrylate. The electrode DC-offset was typ. 1 mV and
AC-impedance typ. 150 Ohm (Swaromed, Innsbruck, Austria). Three of these elec-
44
trodes were applied to record the EEG. Two electrodes were placed 1 cm caudal to
the lateral eye cantus (one for each eye); a central electrode was placed on the midline
on the frontal bone 3 cm away from each previously applied electrode (Fig. 2).
Fig. 1. IoC-View monitor (Aircraft Medical (Barcelona), Barcelona, Spain), shown on the left.
The techniques for connection of electrodes to the monitor and placement of the electrodes on
the forehead of a human patient are shown on the right [13].
This localization was based in previous works in rabbits [1]; [2] and has been con-
cluded to give the best quality EEG signal after testing different positions in pilot
studies with the IoC-View monitor.
Impedance was automatically checked by the monitor and maintained below
15000 Ohms at 1024 Hz. The electrodes were connected to the IoC-View monitor,
which was connected by Bluetooth to a personal computer with the IoC-View graph
software version 1.4 installed, a storage software provided by the manufacturer.
2.2 Anesthetic Monitoring
After EEG baseline recording in the fully awake animals during 5 minutes, the fur on
the ears was clipped and the skin cleaned with alcohol and a local analgesic cream
was applied to the ears skin (EMLA, Nycomed US Inc, New York, USA). Thirty
minutes after, two 22G catheters were placed, one in the marginal ear vein and anoth-
er into the central ear artery for arterial pressure monitoring. Both auricular catheter
systems were flushed with heparinized saline and fixed to the skin. The animals were
then oxygenated with a facial mask at 5L/min for 5 min.
During anesthesia, the rabbits were placed in ventral recumbence above a heating
blanket and rectal temperature was continuously monitored and maintained between
37 and 38ºC.
Anesthetic monitoring included cardio respiratory monitoring provided by a Datex
S/5 Anesthetic station (Datex Ohmeda, Helsinki, Finland) which included: pulse-
oxymetry and pulse rate monitored with the probe placed in the ear, invasive mean
arterial pressure (MAP), inspired and end-tidal concentrations of oxygen and carbon
dioxide.
Clinical monitoring was also performed and included: nociceptive reflexes and
respiratory rate monitoring. Respiratory rate was assessed visually, by counting the
number of respiratory movements per minute. The ear pinch reflex was the nocicep-
tive reflex evaluated.
45

Fig. 2. Gel-coated silver-silver chloride electrodes (Swaromed, Innsbruck, Austria) applied on
the rabbits head during recording of the electroencephalogram with the IoC-View monitor.
At the end of the anesthesia procedure fresh gas flow rate was increased to 5L/min
of 100% oxygen until the rabbits regained swallowing reflexes and at this point extu-
bation was performed. Animals were considered recovered from anesthesia when they
exhibited an alert stance and had regained ambulation and limbs coordination.
2.3 Signal Processing
2.3.1 Digitization and Filtering
EEG data were recorded by the IoC-View monitor as binary files and were exported
to Matlab using code provided by the manufacturer.
Before the analysis of the EEG, careful visual inspection was performed to select
only epochs that were free from visually detected artifacts.
The original sampling frequency of the EEG was 1024 Hz. It was digitized to 256
Hz before processing using the Matlab function “downsample.m”. This allowed a
faster computation of the indexes of DoA. Removal of the mean value of the signal in
order to get out any threshold was performed in all signals recorded.
A Butterworth of 8
th
order digital filter was used with cut off frequencies between
0.5 and 32 Hz before the derivation of PE.
2.3.2 Calculation of Permutation Entropy (PE)
PE was first described by Bamdt and Pompe [14] as a method for ordinal pattern
analysis of non-linear time series. It analyzes consecutive subvectors of constant
length (m) in the analyzed signal interval (length N). Then, it orders the samples in
every subvector according to their amplitude and defines permutations of order m
(m!). The parameter value is given by the resultant normalized probability distribution
of the obtained permutations, using the Shannon entropy formula. In this study, we
used m=3 and N=2048.
In more detail it is calculated in the following steps:
1- Fragments the continuous EEG signal into a sequence of motifs with a determined
length (examples shown in grey).
2- Identifies each motif as belonging to one of the six possible types according to
their shape Counts the number of motifs from the real EEG that belongs to each of the
six categories, to obtain the probability of occurrence of each motif in the signal (p
i
)
46

3- Calculates the PE of the resultant normalized probability distribution of the motifs,
using the standard Shannon uncertainty formula (1):
PE =
∑
( )
(1)
2.3.3 Index of Consciousness (IoC)
The IoC-View monitor was used for EEG recording and directly derived the IoC as
well as the electromyographic activity (EMG), the electroencephalogram suppression
ratio (ESR) and the signal quality index (SQI). The calculation of the IoC is not total-
ly understood. It is based in the symbolic dynamics method which transforms a time
series into a symbol sequence in order to reveal the non-linear characteristics of the
EEG. It also integrates the beta-ratio (frequency range between 11 and 42 Hz) during
superficial anesthesia and the ESR. These components are then combined using a
proprietary discriminatory function to produce the final index IoC. As previously
described, in humans, decreasing values of IoC correspond to gradually loss of con-
sciousness and a deepening of the level of anesthesia. In a unitless scale from 99 to 0,
an index of 99 indicates an awake patient and an index of 0 indicates a flat EEG.
The monitor includes an EMG filter that eliminates most of the potential interfer-
ing electromyographic activity before the derivation of the IoC and calculates the
EMG which is given as a percentage and shows the energy of the EMG level in the
30–45 Hz frequency band [11].
2.4 Statistical Analysis
The parameters were studied in the following times: baseline recordings in the awake
animals (T0), and at intervals of 5 minutes after administration of anesthesia (from T5
to T35). Statistical analysis consisted in two-way ANOVA with Bonferroni correction
for multiple comparisons to check for differences between the two groups in IoC, PE,
EMG, mean arterial pressure (MAP – mmHg), heart rate (HR - beats per minute -
bpm), respiratory rate (RR – respirations per minute - rpm) and body temperature (T -
ºC) and for changes throughout study periods. P-value <0.05 was considered signifi-
cant.
3 Results
Loss of ear pinch reflex happened in all animals of G0.05 and only in one rabbit in
G0.025. The typical raw EEG recordings during the first twenty minutes are sown in
Fig.3. The correspondent power spectrum analysis for each EEG fragment is shown in
Fig.4. There were no clear differences in the raw EEG from T0, T5, T10 and T15.
However, power spectral analysis revealed a decrease in frequency from T0 to T10,
and an increase from T15 to T20 minutes (Fig.4). These results are represented by the
spectral edge frequency 95%.
The behavior of the IoC, PE and EMG throughout study times is shown in Fig.5.
The effect of dexmedetomidine dosage was not significant for any of the studied in
47
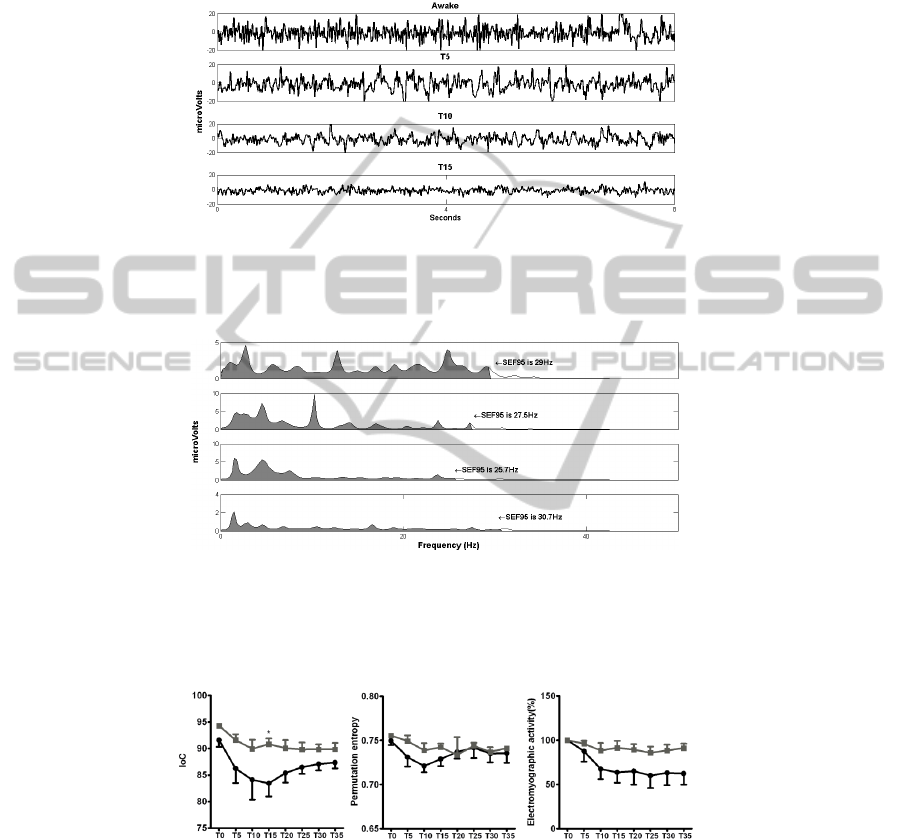
dexes (IoC (p=0.058); PE (p=0.392)) neither for the EMG (p=0.056). Only the IoC
showed a significantly lower value in G0.05 than G0.025 at T15. The analysis re-
vealed a significant effect of time on the IoC (p=0.001), PE (p=0.0195) and on EMG
(p<0.001).
Fig. 3. Raw EEG changes in the group of animals that received the higher dose of dexmedeto-
midine (0.05 mg/kg) combined with a fixed dose of ketamine. EEG fragments recorded in the
awake animals (Awake) and in the following 15 minutes after ketamine and dexmedetomidine
administration in the higher dose group. Eight seconds EEG fragments are shown.
Fig. 4. Power spectrum analysis of the EEG fragments shown in figure 3 from the group of
animals that received the higher dose of dexmedetomidine (0.05 mg/kg) combined with a fixed
dose of ketamine. The spectral edge frequency 95% (SEF95) is shown for the awake animals
(Awake) and in the following 15 minutes after ketamine and dexmedetomidine administration
in the higher dose group.
Fig. 5. Index of consciousness (IoC), electromyographic activity (%) and permutation entropy
at the study times: baseline recordings in the awake animals (T0), and at intervals of 5 minutes
after administration of anesthesia (from T5 to T35). The mean and standard deviation are pre-
sented (N=5). * existence of significant differences between the two groups (p<0.05). The
black line represents the group of animals that received the higher dose of dexmedetomidine
(0.05 mg/kg) and the grey line represents the group of animal that received the lower dose of
dexmedetomidine (0.0025 mg/kg).
48
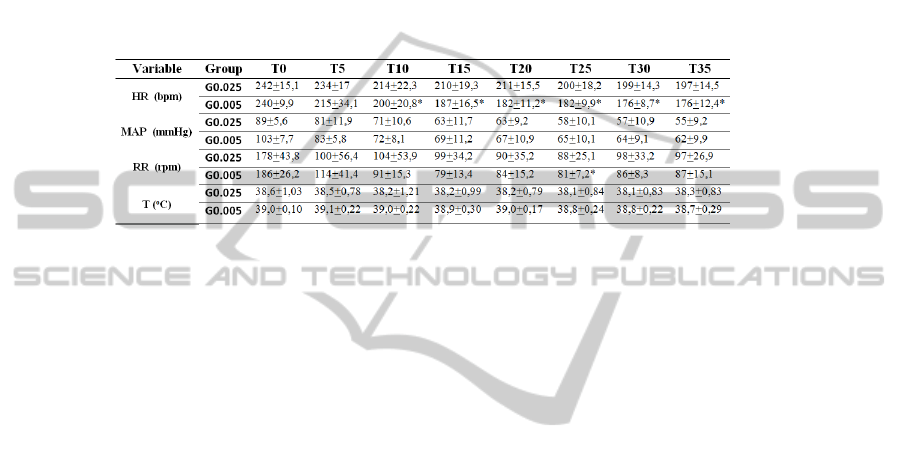
Regarding the cardiorespiratory parameters, the only differences found were in
HR which was significantly lower in G0.05 from T10 to the end of the study and also
RR that was significantly lower in the same group at T25 (Table 1).
Table 1. Clinical data: heart rate (HR –bpm), mean arterial pressure (MAP – mmHg), respirato-
ry rate (RR – rpm) and body temperature (T - ºC) recorded at the study times: baseline record-
ings in the awake animals (T0), and at intervals of 5 minutes after administration of anesthesia
(from T5 to T35). The mean and standard deviation are presented (N=5). G0.025 – group that
received the lower dose of dexmedetomidine (0.025 mg/kg); G0.05 – group that received the
higher dose of dexmedetomidine (0.05 mg/kg). * existence of significant differences between
the two groups (p<0.05).
4 Conclusions
In this study, the capacity of the Index of Consciousness (IoC) and the Permutation
Entropy (PE) to reflect the EEG effects of two doses of dexmedetomidine combined
with a fixed dose of ketamine was evaluated. No significant differences between the
two doses of dexmedetomidine were found regarding IoC and PE, although a tenden-
cy could be suggested by the p-value obtained for the IoC of 0.058.
Clinically, there were clear differences between the two groups of animals: the ear
pinch reflex was lost in all the animals that received the higher dose of dexmedetomi-
dine, heart rate was significantly lower in this group since ten minutes after induction
of anesthesia, and EMG had a tendency to be lower in the same group, reflecting
higher muscle relaxation in animals that received higher dose of dexmedetomidine.
Ketamine was administered in the same dose in both groups. This drug has been
shown to cause increases in the frequency components of the EEG and in the value of
EEG-derived indexes [9]. The presence of ketamine on the anesthetic protocol could
have limit the capacity of IoC and PE to detect different dexmedetomidine depths of
anesthesia. The present results showed that, although increases in dexmedetomidine
dose produced deeper anesthetic levels, this was not reflected in the values of EEG-
derived indexes PE and IoC. However, the IoC showed a tendency to differ between
the two groups. EEG-derived indexes in animals should thus be adapted to the proto-
col used and caution in the interpretation of these non-linear times series parameters
during ketamine administration should remain, as when using frequency domain pa-
rameters. The rabbit as used in this study seems to be a promising animal model for
the study of drug effects on the non-invasively recorded EEG, as it allows the record-
ing of a good quality signal.
49

Acknowledgements
This investigation was supported by FEDER funds trough the COMPETE Program,
and by national funds from Portuguese Foundation for Science and Technology, un-
der the project COMPETE: FCOMP-01-0124-FEDER-009525
(PTDC/CVT/101999/2008) and COMPETE: FCOMP-01-0124-FEDER-009497
(PTDC/CVT/099022/2008).
References
1. A. Silva, S. Campos, J. Monteiro, C. Venancio, B. Costa, P. Guedes de Pinho, and L. An-
tunes, “Performance of anesthetic depth indexes in rabbits under propofol anesthesia: pre-
diction probabilities and concentration-effect relations,” Anesthesiology, vol. 115, no. 2,
2011, pp. 303-314.
2. A. Silva, D.A. Ferreira, C. Venancio, A. P. Souza, and L. M. Antunes, “Performance of
electroencephalogram-derived parameters in prediction of depth of anaesthesia in a rabbit
model,” Br J Anaesth, vol. 106, no. 4, 2011, pp. 540-547.
3. M. Wright, “Pharmacologic effects of ketamine and its use in veterinary medicine,” J Am
Vet Med Assoc, vol. 180, no. 12, 1982, pp. 1462-1471.
4. G. J. Benson, and J. C. Thurmon, “Intravenous anesthesia,” Vet Clin North Am Equine
Pract, vol. 6, no. 3, 1990, pp. 513-528.
5. J. Thurmon, W. Tranquilli, G. Benson, W. Lumb, and E. Jones, Lumb and Jones' Veteri-
nary Anesthesia, 1996.
6. C. Valtolina, J. H. Robben, J. Uilenreef, J. C. Murrell, J. Aspegren, B. C. McKusick, and L.
J. Hellebrekers, “Clinical evaluation of the efficacy and safety of a constant rate infusion of
dexmedetomidine for postoperative pain management in dogs,” Vet Anaesth Analg, vol. 36,
no. 4, 2009, pp. 369-383.
7. G. Y. Lin, J. H. Robben, J. C. Murrell, J. Aspegren, B. C. McKusick, and L. J. Hellebrek-
ers, “Dexmedetomidine constant rate infusion for 24 hours during and after propofol or
isoflurane anaesthesia in dogs,” Vet Anaesth Analg, vol. 35, no. 2, 2008, pp. 141-153.
8. J. Bruhn, P. S. Myles, R. Sneyd, and M. M. Struys, “Depth of anaesthesia monitoring:
what's available, what's validated and what's next?,” Br J Anaesth, vol. 97, no. 1, 2006, pp.
85-94.
9. P. A. March, and W. W. Muir, “Bispectral analysis of the electroencephalogram: a review
of its development and use in anesthesia,” Vet Anaesth Analg, vol. 32, no. 5, 2005, pp. 241-
255.
10. M. Revuelta, P. Paniagua, J. M. Campos, J. A. Fernandez, A. Martinez, M. Jospin, and H.
Litvan, “Validation of the index of consciousness during sevoflurane and remifentanil
anaesthesia: a comparison with the bispectral index and the cerebral state index,” Br J
Anaesth, vol. 101, no. 5, 2008, pp. 653-658.
11. X. Li, S. Cui, and L. J. Voss, “Using permutation entropy to measure the electroencephalo-
graphic effects of sevoflurane,” Anesthesiology, vol. 109, no. 3, 2008, pp. 448-456.
12. A. Silva, H. Cardoso-Cruz, F. Silva, V. Galhardo, and L. Antunes, “Comparison of anes-
thetic depth indexes based on thalamocortical local field potentials in rats,” Anesthesiology,
vol. 112, no. 2, 2010, pp. 355-363.
13. Morpheus-Medical, “IoC-View version 2.1 user manual,” Morpheus Medical 2008
14. C. Bandt, and B. Pompe, “Permutation entropy: a natural complexity measure for time
series,” Phys Rev Lett, vol. 88, no. 17, 2002, pp. 174102.
50
