
Farm Animals Monitoring Tool based on Image
Processing Technique
Carlos Eduardo Bites Romanini
1
, Stefano Viazzi
1
, Federica Borgonovo
2
,
Annamaria Costa
2
, Marcella Guarino
2
, Toon Leroy
1
and Daniel Berckmans
1
1
Division of Measure, Model & Manage Bioresponses (M3-BIORES),
Katholieke Universiteit Leuven, Kasteelpark Arenberg 30, B3001 Leuven, Belgium
2
Department of Veterinary Science and Technologies for Food Safety,
Faculty of Veterinary Medicine, Università degli Studi di Milano, via Celoria 10, Milan, Italy
Abstract. This paper describes camera based systems and image processing
technique as a monitoring tool for farm animals. Image based systems were
used to automatic measure the activity and occupation indexes of piglets and
broilers chickens. Experimental results were presented in a form of two case
studies: 1) Understanding the effect of environmental enrichment in piglet’s
activities - the study was conducted in two selected pens of a fattening room.
The activity of 14 Dalland piglets was recorded continuously for a total of 5
days. On the second day environmental enrichments were introduced in the
form of two wooden logs and a chain. 2) Understanding the effect of light
intensity on broiler chicken’s activities - in a total of 62 Ross 308 broiler
chickens (equal number of female and male) kept on a 16 h photoperiod
treatments. The light intensity schedule varied according to the age of the
chickens. For chickens with 15 days old the light-dark schedule alternate every
4 hours between 5 lx and 100 lx. For chickens with around 21 and 40 days old
the light conditions alternated every 2 hours. In both study cases the activity
index recorded the total amount of movement at a group level. Piglets increased
their movements and playing behaviour when environmental enrichments
(wood logs and chain) were introduced to the pens. Broiler chickens showed
higher activity indexes during periods of 100 lx than 5 lx when light intensity
alternated.
1 Introduction
In the past, livestock management decisions were made entirely on the audio-visual
observation, judgment and experience of the farmer [7]. However, due to price
competition the number of animals and the scales of animal farms have increased.
This increasing scale of farms and the corresponding high number of animals has
intensified the administrative, technical, organizational and logistic workload of the
farmer who has, consequently, less possibility to monitor his animals by audio-visual
scoring. One of the objectives of Precision Livestock Farming (PLF) is to develop on-
line tools for fully automatic and continuous monitoring of farm animals during their
Bites Romanini C., Viazzi S., Borgonovo F., Costa A., Guarino M., Leroy T. and Berckmans D..
Farm Animals Monitoring Tool based on Image Processing Technique.
DOI: 10.5220/0003882100600068
In Proceedings of the International Workshop on Veterinary Biosignals and Biodevices (VBB-2012), pages 60-68
ISBN: 978-989-8425-94-2
Copyright
c
2012 SCITEPRESS (Science and Technology Publications, Lda.)

life [1]. PLF consists of measuring variables on the animals, modelling these data to
select information and calculate specific parameters, and then using these parameters
in real time for monitoring and the models for controlling purposes. Image analysis is
one of the tools used in PLF for monitoring. Nowadays, image processing technique
is relatively inexpensive, which is an advantage, since it requires only some cameras
and computers, and furthermore it doesn’t interfere with the animals’ environment.
The aim of these technical tools is not to replace, but to support the farmer who
always remains the crucial factor in a good animal management system. Animals can
be monitored as individuals or as a group. When single animals are observed,
automatic monitoring tool can be developed by, firstly, extracting features from the
images in order to model the animal. The models of the animals can be simple or
more complex depending on the application. A pregnant sheep, for example, can be
represented as a line for predicting the time of birth, an ellipse is enough for real time
detection of scratching behaviour in caged poultry [11], and the contour and four
points for describing altered gait in laboratory mice [10]. After the biological system
is described in a simplified form by a real time model, the next step consists in
developing a second dynamic model able to detect and predict specific behaviours.
However, the individual approach is not feasible anymore in the case of large number
of animals observed due to both complexity and the computational demand (for
instance, monitoring thousands chickens individually in a poultry house). Therefore,
another methodology has to be used. Instead of looking at each individual, the group
is now taken into consideration. The activity index, the fraction of the floor space in
the pen that contains motion in between two subsequent camera images, and the
occupation index, the fraction of the floor space occupied by the animals, are good
estimators for analysing the animals’ behaviour and their welfare. These indexes have
been implemented in a commercial product to evaluate thermal comfort of chickens in
real time [4].
The objective of this work was to describe camera based systems and image
processing techniques as a monitoring tool for farm animals. Experimental results of
occupation index and activity index for both pigs and broilers were presented in a
form of case studies. The activity of piglets was measured in response to
environmental enrichments while the activity of broilers chickens was measured in
response to light intensities.
2 Materials and Methods
Image based systems were developed to measure the activity and occupation indexes
of distinct groups of farm animal (pigs and chickens) in practical field conditions.
The initial image processing step applied was the image segmentation in order to
extract object shapes from the images and make a distinction between foreground and
background regions in the image. With an adaptive threshold method, with threshold
value τ
0
based on the image histogram using Otsu algorithm [13] the binary image
I(x,y,t) was obtained. In the binary images pixels representing the animals have
different values than the one of the background of the image (I
o
= 1 or I
o
= 0,
respectively).
61

I
o
(x, y, t) =
1 if I(x, y,t) >
τ
0
0 other wise
⎧
⎨
⎪
⎩
⎪
(1)
The occupation index calculates the fraction of the area occupied by the animals
considering the division of the image into different zones.
From the occupation image I
o
(x,y,t) the occupation index o
i
(t) for the zone Z
i
was
calculated as the fraction of pixels corresponding to a region of the image occupied by
animals with respect to the total number of pixels within the zone Z
i
:
o
i
(t) =
I
o
(x, y, t)
(x,y)∈Z
i
∑
1
( x,y)∈Z
i
∑
(2)
The idea behind the quantification of the activity index is that the change in colour or
grey value of the pixels in consecutive frames provides a good estimation of the
activity of animals. The difference of pixel values I
diff
(x,y,t) between the binary image
I(x,y,t) extracted from the video at time t and the one I(x,y,t-1) extracted one frame
before at time t-1 was calculated:
I
diff
(x, y, t)
=
I (x, y, t)
−
I (x, y, t
−
1)
(3)
In order to take into account the small changes of the pixels due to noise, e.g. small
lighting variation, a threshold τ
1
was set to 10% of the maximal intensity variation
observed in an empty region. In order to compensate drastic changes in pixels’ values,
e.g. when lights were switched on and off a second threshold τ
2
was added and set to
50% of the maximal activity.
I
a
(x, y, t) =
1 if
τ
2
> I
di ff
(x, y, t) >
τ
1
0 other wise
⎧
⎨
⎪
⎩
⎪
(4)
The activity index a
i
(t) for the zone Z
i
was calculated as the fraction of the ‘activity
image’ I
a
(x,y,t) with respect of the total number of pixel of the zone:
a
i
(t) =
I
a
(x, y, t)
( x,y)∈Z
i
∑
1
( x,y)∈Z
i
∑
(5)
2.1 Case Study: Monitoring of Piglets in Response to Environmental
Enrichment
The study was conducted in a fattening room. The barn was an open-space 4.6 m wide
x 6.81 m long, mechanically ventilated and subdivided into 6 pens 2.27 m long and
1.9 m wide each, all equipped with fully slatted floor. The selected pen was
positioned at the end of the pig’s barn and delimited by the wall 1 m high and 0.2 m
thick. A corridor of 80 cm long divided the pen monitored. The pen contained 14
62
Dalland race piglets in post-weaning period with average weight of 6.4 kg and
average age of 23 days at the beginning of the experiment.
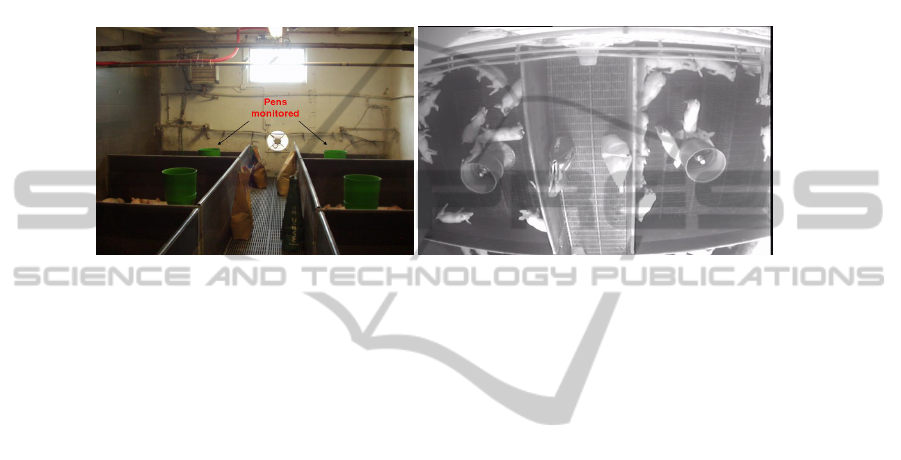
An infrared CCD camera (Sanyo Analogue CCD) was mounted 3 m above the
floor with its lens pointing downward directly above the corridor separating the two
pens to get a top view of both pens in the camera image. The camera was connected
to a PC with a built-in frame grabber (Data Translation DT 3210) using a coaxial
cable. Images were captured continuously with a resolution of 786 x 586 pixels at a
sample rate of one frame per second for a total period of 5 days. Fig. 1 illustrates the
facilities and one example of the images obtained by the cameras.
Fig. 1. Illustration of the experimental facilities (left side) and image recorded by the video
camera (right side).
Both the occupation index and activity index were then obtained for different groups
of piglets in response to the introduction of environmental enrichments in the form of
two wooden logs and a chain.
2.2 Case Study: Monitoring of Chicks in Response to Light Intensity
Four boxes (100 cm length x 80 cm width x 100 cm height) kept under the
environmental thermo-neutral zone of the chickens were used to house the chicks
during the observation periods. Automatic drinkers were placed (15 cm above the
floor) in the entrance to each box providing water ad libitum for the chicks. The birds
had ad libitum access to a commercial diet via feeders placed 9 cm above the floor
(15 cm feeder space/bird). Six 18 W fluorescent luminaries were used in each box.
Fig. 2 shows a scheme of the facilities used during the experiment.
The images of the birds were collected with a camera (InterM, CCD Digital Colour
Camera VDC413, with an Ernitec 4 mm TVlens F1.2) via a 5 cm diameter hole in the
centre of each box, ensuring a central and complete view of each pen. Four images
per second were recorded on a time-lapse VCR (Panasonic Time-Lapse S-VHS
AG6720A) during the 16 h of light on each experimental day. The video-images were
digitalised using a WinTV-PVR-usb-V1.3 image grabber (Hauppauge Computer
Works, Inc., 2001–2002). The activities measurements were observed in a total of 62
Ross 308 broiler chickens (equal number of female and male) kept on a 16 h
photoperiod treatments. The light intensity schedule varied according to the age of the
chickens. For chickens with 15 days old the light-dark schedule alternate every 4
hours between 5 lx and 100 lx Hence the activity of the chickens was recorded during
63
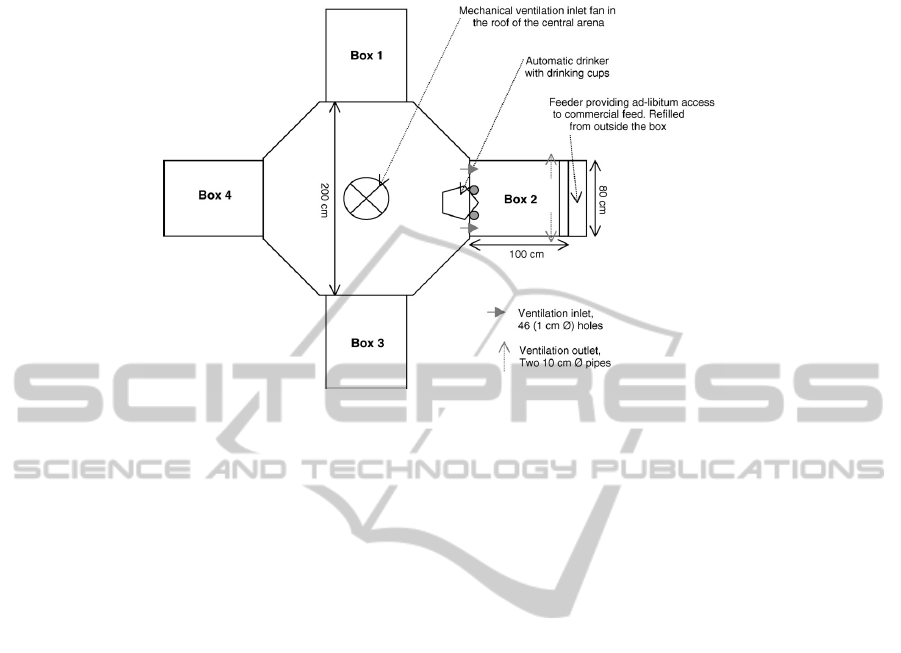
Fig. 2. Illustration of the boxes used to house the chicks [8].
two steps up (5 – 100 lx) and one step-down (100 – 5 lx) in light intensity. For
chickens with around 21 days old and 40 days old the light conditions alternated
every 2 hours. Hence the group of chickens tested in those groups experienced 4 times
steps up (5-100 lx) and 4 times steps down (100 – 5 lx). Further experimental setup
details, with complimentary goals (for instance with fixed light intensity treatments),
are available at the literature [8]. Both the occupation index and the activity index
were then obtained for the group of observed broiler chickens.
3 Results and Discussion
3.1 Effect of Environmental Enrichments on Piglets Activity
The introduction of the environment enrichment affected the dynamic daily activity
pattern of the animals. Piglets showed an increase of their activity index with the
introduction of environmental enrichments, but a reduction during the next day and
back on average after 4 days (Fig. 3). The interest of piglets to the wood logs had
decreased over time, but the duration had increased while the attention to the chain
had slightly increased as frequency and duration, based on farm observations.
The occupation index, instead, slowly decreased on the day of the enrichment, since
the pigs formed different groups around the chain and around each of the wooden
stick. Also the occupation index returned to the average after 4 days (Fig. 4).
3.2 Effect of Light Intensity on Broiler Chickens Activity
The
total amount of movement observed was corrected for the average size of the
64
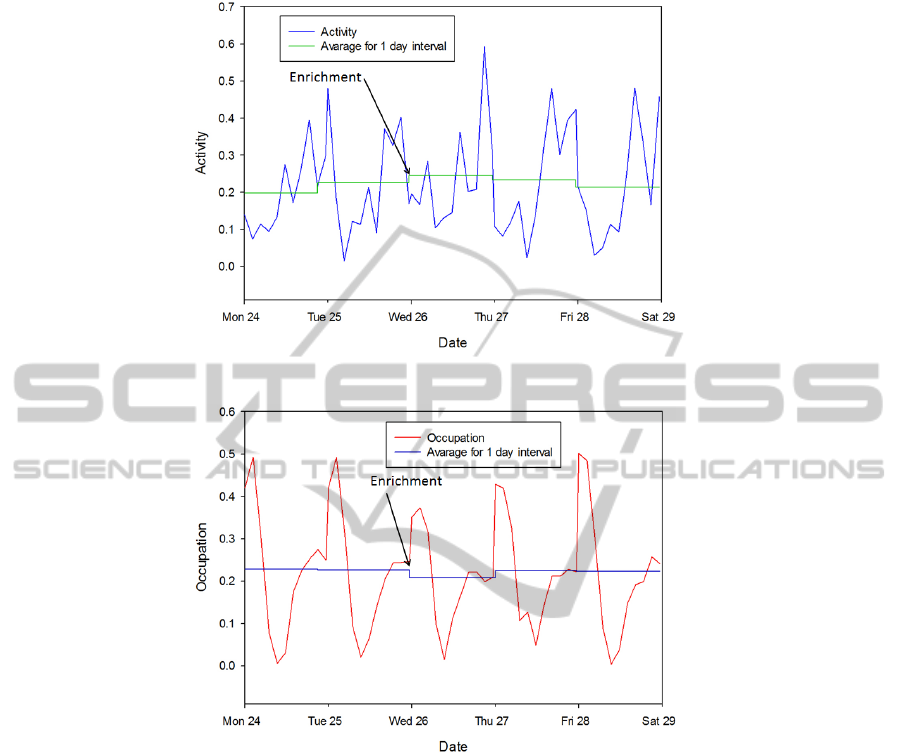
Fig. 3. Activity mean of the piglets calculated continuously during the experiment.
Fig. 4. Occupation mean of the piglets calculated continuously during the experiment.
birds in each box (from the dorsal view of the birds whilst standing) at each age and
given in units of area, cm
2
. Activity of chickens was affected by changes in light
intensity. The Fig. 5 shows on of the results of the activity index over a day at 2-h
intervals with details of the relationship between light intensity and activity, as well
as, the inherent oscillations in the activity within light environments. It also illustrates
that the activity levels during a fixed light intensity of either 5 lx or 100 lx.
Complimentary results are available at the literature [7].
The mean activity index of the chickens at group level was significantly higher in
100, lx than 5 lx (ANOVA, F(1,19) = 29.90, P < 0.0001) during the step-wise changes
but, was otherwise, very similar (Fig. 6). Previous studies on layers and broilers have
shown a positive correlation between light intensity and activity [5]; [6]; [3].
65
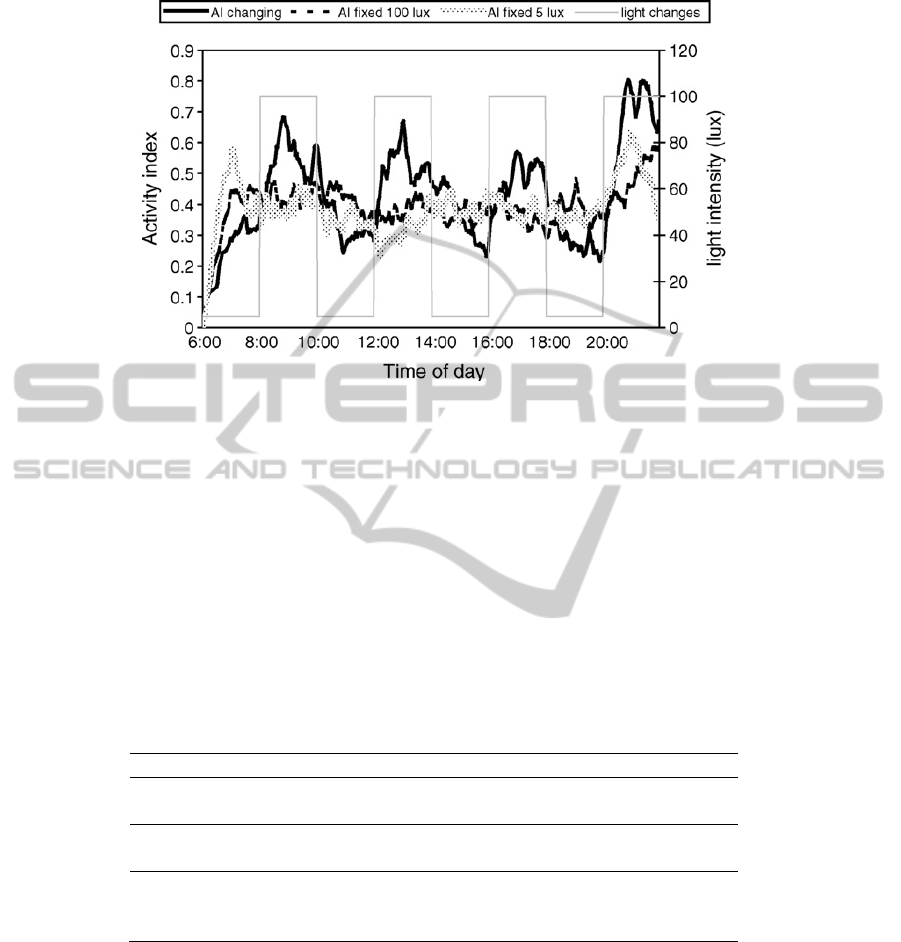
Fig. 5. Results showing the activity index over 16 h light period (06:00 – 22:00) with light
intensity alternating between 5 lx and 100 lx each 2 h period [8].
The mean activity level did not differ significantly between male and female birds
(ANOVA, F(1,19) = 3.17, P = 0.091) which is in agreement with previous studies [6].
However male chickens responded faster than females in light intensity changes at 15
and 21-22 days of age. Activity decreased significantly with age (ANOVA, F(2,19) =
41.26, P < 0.0001) as show in Table 1. The mean activity index was slightly higher
for chickens of 15 days old than 21–22 days of age. Previous work has shown a peak
in activity at between weeks 2 and 3 of life with a sharp drop in activity thereafter
[13]; [2]; [12]. The activity index was very similar in constant light of 5 lx and 100 lx
and intermediate to the extremes of the alternating intensity (ANOVA, F(1,8) = 5.39,
P = 0.0488).
Table 1. Mean activity index (with standard error) for male and female broiler chickens at
different ages in different light intensity conditions [8].
Factor Level Mean activity index (cm2)
Light 5 lx
100 lx
0.289 ± 0.0207
0.449 ± 0.0207
Sex Female
Male
0.343 ± 0.0207
0.395 ± 0.0207
Age 15 days old
21-22 days old
40 days old
0.492 ± 0.0254
0.431 ± 0.0254
0.184 ± 0.0254
5 Conclusions
The occupation index and activity index were calculated and used in two different
66

case studies: 1) understanding the effect of environmental enrichments in piglet’s
activities and 2) understanding the effect of light intensities on broiler chicken’s
activities. The activity index recorded the total amount of movement at a group level
in an automatic objective and inexpensive way, using image processing technique.
The results have shown an increase in the activity index for both of the studied cases.
Piglets increased their movements and playing behaviour when environmental
enrichments (wood logs and chain) were introduced to the pens. However their
attention to the wood logs and the chain dropped considerably over time and normal
activity level was expressed after four days. The broiler chickens showed significantly
higher activity indexes during periods of 100 lx than 5 lx when light intensity
alternated. The total amount of activity decreased with age of the chickens. Both, the
occupation index and the activity index showed to be useful for assessing general
animal behaviour in a group level of farm animals. Moreover, automatic monitoring
of broiler chickens and piglets activities, by means of image processing technique
serve as an effective tool for support the farmer on taking actions to increase animals’
welfare.
References
1. Berckmans, D. (2008). "Precision livestock farming (plf) - preface." Computers and
Electronics in Agriculture 62(1): 1-1.
2. Berk, J., 1997. Influence of light intensity on light-choice by broilers. In: Proceedings of the
Fifth European Symposium on Poultry Welfare. pp. 46–48.
3. Boshouwers, F.M.G., Nicaise, E., 1993. Artificial light sources and their influences on
physical activity and energy expenditure of laying hens. Br. Poult. Sci. 34, 11–19.
4. Cangar, O., Aerts, J. M., Buyse, J. and Berckmans, D. (2008). "Quantification of the spatial
distribution of surface temperatures of broilers." Poultry Science 87(12): 2493-2499.
5. Cherry, P., Barwick, M.W., 1962. The effect of light on broiler growth. 1. Light intensity
and colour. Br. Poult. Sci. 3, 31–39.
6. Newberry, R.C., Hunt, J.R., Gardiner, E.E., 1988. Influence of light intensity on behaviour
and performance of broiler chickens. Poult. Sci. 67, 1025.
7. Frost, A. R., Parsons, D. J., Stacey, K. F., Robertson, A. P., Welch, S. K., Filmer, D. and
Fothergill, A. (2003). "Progress towards the development of an integrated management
system for broiler chicken production." Computers and Electronics in Agriculture 39(3):
227-240.
8. Kristensen, H.H., Aerts, J.M., Leroy, T., Wathes, C.M., Berckmans, D. (2006). Modelling
the dynamic activity of broiler chickens in response to step-wise changes in light intensity.
Applied Animal Behaviour Science 101: 125-143.
9. Leroy, T., Borgonovo, F., Costa, A., Aerts, J.-M., Guarino, M. and Berckmans, D. (2008).
Real-time measurament of pig activity in practical conditions. ASABE, American Society
of Agricultural and Biological Engineers.
10. Leroy, T., Stroobants, S., Aerts, J. M., D'hooge, R. and Berckmans, D. (2009). "Automatic
analysis of altered gait in arylsulphatase a-deficient mice in the open field." Behavior
Research Methods 41(3): 787-794.
11. Leroy, T., Vranken, E., Van Brecht, A., Struelens, E., Sonck, B. and Berckmans, D. (2006).
A computer vision method for on-line behavioral quantification of individually caged
poultry, Amer soc agricultural & biological engineers.
12. Nielsen, B.L., Litherland, M., Nøddegaard, F., 2004. Effects of qualitative and quantitative
feed restriction on the activity of broiler chickens. Appl. Anim. Behav. Sci. 83, 309–323.
67

13. Otsu, N. (1979). "Threshold selection method from gray-level histograms." IEEE
Transactions on Systems Man and Cybernetics 9(1): 62-66.
14. Reiter, K., Bessei, W., 1995. In: Rutter, S.M., Rushen, J., Randle, H.D., Eddison, J.C.
(Eds.), Influence of Running on Leg Weakness of Slow and Fast Growing Broilers. UFAW,
pp. 211–213.
68
