
SPEECH EMOTIONAL FEATURES MEASURED BY POWER-LAW
DISTRIBUTION BASED ON ELECTROGLOTTOGRAPHY
Lijiang Chen
1
, Xia Mao
1
, Yuli Xue
1
and Mitsuru Ishizuka
2
1
School of Electronic and Information Engineering, Beihang University, 100191, Beijing, China
2
Department of Information and Communication Engineering, University of Tokyo, Tokyo, Japan
K
eywords:
Speech emotional features, Power-law distribution, Electroglottography.
Abstract:
This study was designed to introduce a kind of novel speech emotional features extracted from Electroglot-
tography (EGG). These features were obtained from the power-law distribution coefficient (PLDC) of funda-
mental frequency (F
0
) and duration parameters. First, the segments of silence, voiced and unvoiced (SUV)
were distinguished by combining the EGG and speech information. Second, the F
0
of voiced segment and the
first-order differential of F
0
was obtained by a cepstrum method. Third, PLDC of voiced segment as well as
the pitch rise and pitch down duration were calculated. Simulation results show that the proposed features are
closely connected with emotions. Experiments based on Support Vector Machine (SVM) are carried out. The
results show that proposed features are better than those commonly used in the case of speaker independent
emotion recognition.
1 INTRODUCTION
As an important channel of human communication,
voice contains information of the content of speech,
speaker identification and speaker emotion. This pa-
per focuses on the problems existing in the emotional
speech processing, which is to recognize the user’s
emotional state by analyzing speech patterns. There
are already a number of systems that are capable of
emotional recognition. However, both speaker depen-
dent and speaker independent speech emotion recog-
nition are far from satisfying. It has always been a
dream to give computers speech emotion recognition
ability close to or even beyond humans. Looking for
new efficient features is one of the effective direc-
tions of this study. Several researchers have studied
the acoustic correlates of emotion affect in speech
signals(Ververidis and C., 2006; Yang and Lugger,
2010). Prosody features such as pitch variables and
speech rate were analyzed through pattern recognition
(Cowie and Cornelius, 2003) (Borchert and Duster-
hoft, 2005). Zhao combined the two kinds of features
to recognize Mandarin emotions(Zhao et al., 2005).
Shami make use of the segment-level features (Shami
and Kamel, 2005). Some other researchers put em-
phasis on the integration of acoustic and linguistic in-
formation (Schuller et al., 2004). There are two basic
difficulties of emotion recognition on prosodic fea-
tures. First, it’s very difficult to extract the funda-
mental frequency because of the influence of vocal
tract and aerodynamic noise. Second, the change of
F
0
over time is more associated with emotion than the
F
0
itself. It is challenging to extract the information
of F
0
distribution over time associated with emotion.
Electroglottograph or EGG is a system which
gives an information on the vocal folds vibration by
measuring the electrical resistance between two elec-
trodes placed around the throat. It gives a very use-
ful information about speech, especially because it’s
the source of the phonation (no influence of vocal
tract and no aerodynamic noise). EGG has been used
to extract F
0
in the field of medical and rehabilita-
tion(Kania et al., 2006). In this contradiction, EGG is
firstly used for distinguishing the segments of silence,
voiced and unvoiced. Then the F
0
is obtained from
EGG with cepstrum method for emotion recognition.
A power law is a special kind of mathematical
relationship between two quantities. When the fre-
quency of an event varies as a power of some attribute
of that event (e.g. its size), the frequency is said to
follow a power law. As we know, a large number of
independentsmall events meet the normal distribution
which is the ideal situation. In reality, events are often
dependent and not ”small” enough. Therefore, events
often meet the power-law distribution rather than nor-
mal distribution. For instance, the number of cities
131
Chen L., Mao X., Xue Y. and Ishizuka M..
SPEECH EMOTIONAL FEATURES MEASURED BY POWER-LAW DISTRIBUTION BASED ON ELECTROGLOTTOGRAPHY.
DOI: 10.5220/0003886301310136
In Proceedings of the International Conference on Bio-inspired Systems and Signal Processing (BIOSIGNALS-2012), pages 131-136
ISBN: 978-989-8425-89-8
Copyright
c
2012 SCITEPRESS (Science and Technology Publications, Lda.)
having a certain population size is found to vary as a
power of the size of the population, and hence follows
a power law.
The paper is structured as follows: section 2 gives
the description of the database used, which includes
speech and EGG data; section 3 explains the process
of feature extraction, including SUV distinguishing
and PLDC calculation; section 4 introduces the ex-
periments based on SVM; and finally conclusions.
2 DATABASE DESCRIPTION
To evaluate the new features proposed, Beihang Uni-
versity Database of Emotional Speech (BHUDES)
was set up to provide speech utterances. All the ut-
terances were stereo whose left channel contains the
acoustic data and right channel contains the EGG
data.
SUBJECTS
Fifteen healthy volunteers were invited to establish
the database, including seven male and eight female.
The emotions used resemble the far spread MPEG-4
set, namely joy, anger, disgust, fear, sadness, surprise
and added neutrality. The database contains twenty
texts with no emotional tendencies. Each sentence
was repeated three times for each emotion, thus 6,300
utterances were obtained. All these utterances have a
sample-frequency as 11025Hz and mean duration as
1.2s.
INSTRUMENTATION
Acoustic data was obtained by a BE-8800 elec-
tret condenser microphone. TIGEX-EGG3 (Tiger
DRS,Inc., America) measured the EGG signals. The
output of the EGG device was processed by an elec-
tronic preamplifier and then by a 16-bit analog-to-
digital (A/D) converter that was included in a OP-
TIPLEX 330 personal computer. Both the EGG and
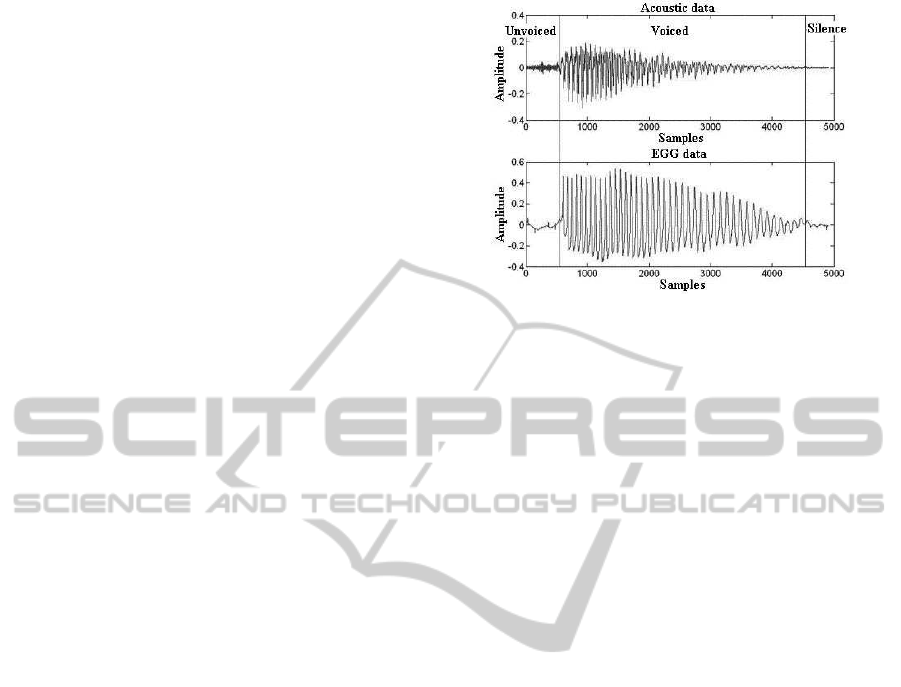
acoustic data were analyzed by MATLAB. A raw data
of acoustic and EGG are shown in Fig. 1. The seg-
ments of silence, voiced and unvoiced are signed with
vertical lines.
EVALUATION
Besides, an emotional speech evaluation system is es-
tablished to ensure the reliability of the utterances.
Emotional speech which is accurately recognized by
at least p% of strange listeners is collected into a sub-
set, where p ∈ { 50, 60, 70, 80, 90, 100}.
The subset S70 is selected for further experiments
because of the appropriatequality and quantity. There
are in total 3456 mandarin utterances covering all the
emotion categories in the S70 subset.
Figure 1: A raw data of acoustic and EGG.
3 FEATURE EXTRACTION
There are two steps of feature extraction. First, the
segment of voiced speech, unvoiced speech and si-
lence were separated using information from both
acoustic data and EGG data. Second, we focus on the
characteristics distribution of time-domain. The du-
ration distribution of voiced segment, pitch rise seg-
ment and pitch down segment were analyzed by the
power-law distribution coefficient (PLDC).
SUV DISTINGUISHING
In speech analysis, the SUV decision which is used
to divide whether a given segment of a speech sig-
nal should be classified as voiced speech, unvoiced
speech, or silence, based on measurements made on
the signal. The measured parameters include the
zero-crossing rate, the speech energy, the correlation
between adjacent speech samples, etc.(Atal and Ra-
biner, 1976). It is usually performed in conjunction
with pitch analysis. However, without the information
of EGG, the linking of SUV decision to pitch analysis
results in unnecessary complexity. Fig. 2 shows the
log energy histograms of acoustic and EGG data.
In Fig. 2, both the log energy histograms of acous-
tic and log energy histograms of EGG have two peaks.
The left one represents the unvoiced or silent seg-
ments, while the right one represents the voiced seg-
ments. We use the maximum a posteriori method to
fit the two classes data near the two peaks for both
acoustic and EGG. The recognition rates obtained are
95.98% and 99.96% respectively. This indicates that
the EGG has shown excellent in the recognition of
voice segment.
Based on the above analysis, we designed three
threshold which are determined by the result of statis-
tics as shown in Fig. 2. A SUV division algorithm was
designed as shown in Fig. 3.
BIOSIGNALS 2012 - International Conference on Bio-inspired Systems and Signal Processing
132
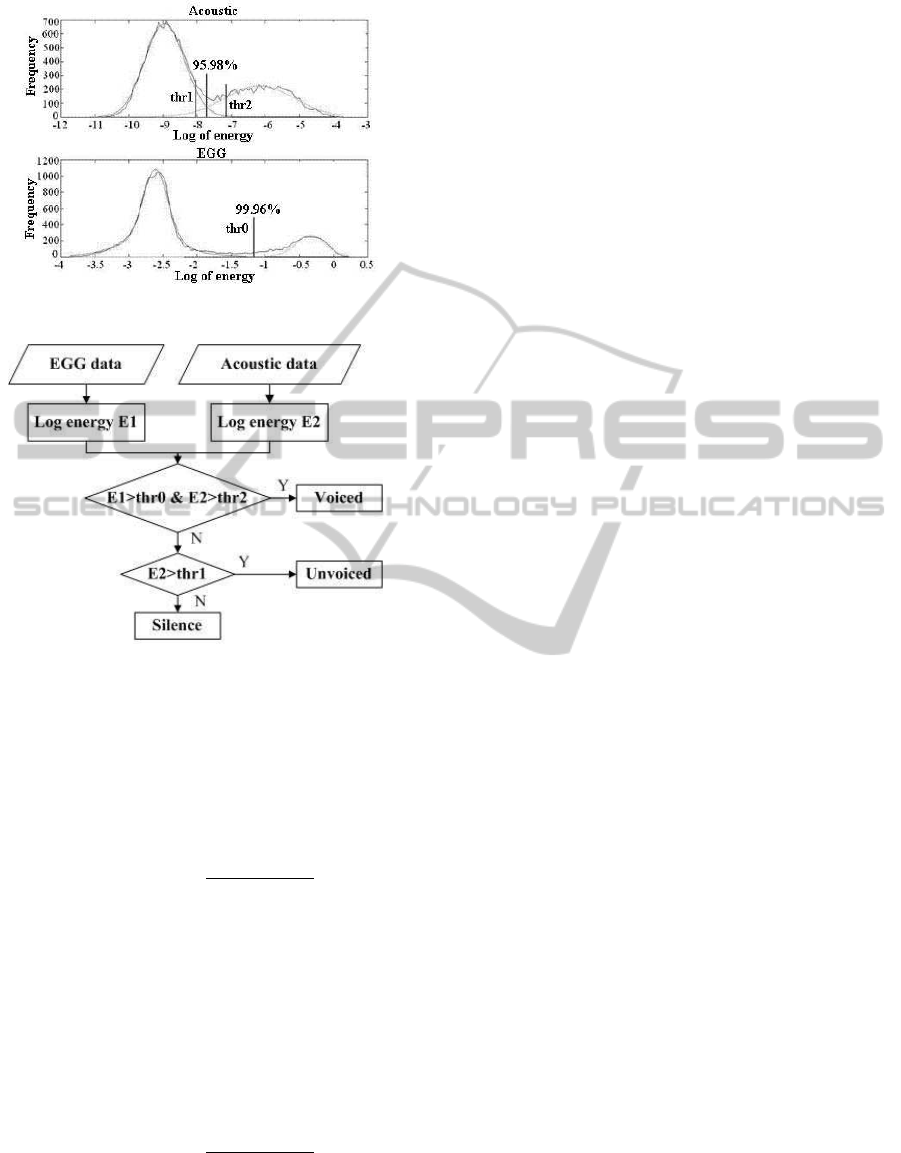
Figure 2: Log energy histograms of acoustic and EGG.
Figure 3: SUV division algorithm.
The algorithm to divide SUV is given in detail as
follows:
• Use 50Hz high-pass filters to filter the low-
frequency noise generated by muscle movement.
• Calculate the energy of each frame of filtered
EGG data as equation (1):
E
1
= log(
v
u
u
t
n
∑
i=1
x
1
(i)
2
,
L) (1)
where x
1
(i) is the ith frame of filtered EGG data.
• Use digital filter as equation (2) to enhance the
high-frequency components of acoustic signal.
H(z) = 1 − 0.95× z
−1
(2)
• Calculate the energy of each frame of filtered
acoustic data as equation (3):
E
2
= log(
v
u
u
t
n
∑
i=1
x
2
(i)
2
,
L) (3)
where x
2
(i) is the ith frame of acoustic data.
• If the current frame meet equation (4):
E
1
> thr
0
&E
2
> thr
2
(4)
this frame belongs to voiced segment.
• Else if the current frame meet equation (5):
E
2
> thr
1
(5)
this frame belongs to unvoiced segment.
• Else this frame belongs to silence segment.
TIME-DOMAIN DISTRIBUTION
In this section, we focus on the characteristics dis-
tribution of time-domain. First, the duration distribu-
tion of voiced segment was processed as follows:
• Assume the length of each voiced segment is:
V(n), n = 1, 2, ···N (6)
where N means the number of voiced segments.
• The histogram of V(n) is obtained as (7):
[F, xout] = hist(V(n)) (7)
where F means the frequency rate and xout means
the bin locations
• F and xout probably follow a power law distribu-
tion as (8):
F ≈ A· xout
B
(8)
where A and B are constants.
• Taking the logarithm on both sides
ln(F) ≈ ln(A) + Bln(xout) (9)
• The power-law distribution coefficient (PLDC) is
calculated as equation (10).
[P
1
, P
2
] = polyfit(ln(F), ln(xout), 1) (10)
where function polyfit is used to find the coeffi-
cients of a polynomial p(x) = P
1
·x+ P
2
of degree
1 that fits the data, ln(F) to ln(xout), in a least
squares sense.
Fig. 4 shows the relation of ln(F) and ln(xout).
The left column is six basic emotions and neutrality
data for male. The right column is the same emotions
data but for female. The data followed each title of
the subfigure means the PLDC [P
1
, P
2
].
From Fig. 4 we can indicate that, for both male
and female data, PLDC of the voiced segment dura-
tion are closely related with emotions. Especially in
the anger situation, the [P
1
] is significantly higher than
neutrality and sadness situation. Other emotions with
SPEECH EMOTIONAL FEATURES MEASURED BY POWER-LAW DISTRIBUTION BASED ON
ELECTROGLOTTOGRAPHY
133
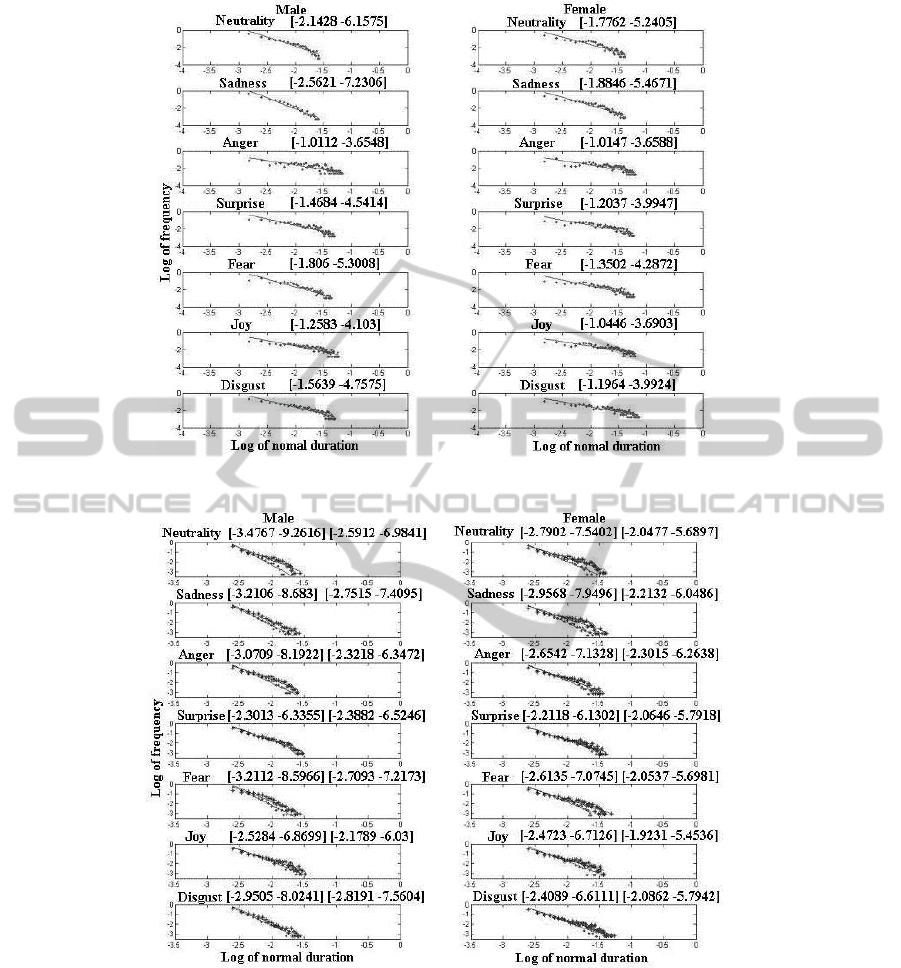
Figure 4: PLDC of voiced duration.
Figure 5: PLDC of pitch rise and pitch down duration.
high arousal have the similar trends, such as surprise
and joy.
The duration distribution of pitch rise segment
and pitch down segment were analyzed by the PLDC
method as the same process above. F
0
of each frame
are obtained by a cepstrum method (Noll, 1967).
Fig. 5 shows the power law distribution of the pitch
rise duration and pitch down duration. The left col-
umn is six basic emotions and neutrality data for
male. The right column is the same emotions data but
for female. The data followed each title of the subfig-
ure means the PLDC of pitch rise duration and pitch
down duration.
From Fig. 5 we can indicate that, for both male
and female data, PLDC of pitch rise duration are
closely related with emotions. For example, both in
male and female surprise subfigure, [P
1
] of pitch rise
duration are higher than other emotions. The relations
between PLDC of pitch down duration and emotion is
not obvious.
BIOSIGNALS 2012 - International Conference on Bio-inspired Systems and Signal Processing
134

4 EXPERIMENTS
In order to evaluate the efficiency of PLDC emotional
features, comparative experiments are designed. All
these experiments are based on the s70 corpus de-
scribed in section 2.
4.1 Sort of Speech Features
We apply a comparative test of the proposed PLDC
features and traditional features based Sequential For-
ward Floating Search (SFS) and Sequential Back-
ward Floating Search (SBS). SFS and SBS are known
for their high performance as shown in (Pudil et al.,
1994). In addition to fundamental frequency (F
0
),
the first three formant (F
1
,F
2
,F
3
), the energy (E)
and zero crossing rate (Z) are extracted. We calcu-
lated the statistic of the frame-level feature, including
maximum, minimum, mean and standard deviation.
These statistic features are compared with the pro-
posed PLDC features include PLDC of voiced seg-
ment duration (PLDC − V
s1
and PLDC −V
s2
), PLDC
of pitch rise duration (PLDC − P
r1
and PLDC − P
r2
)
and PLDC of pitch down duration (PLDC − P
d1
and
PLDC − P
d2
).
Table 1: The first 10 Features in SFS and SBS.
Order SFS SBS
1th PLDC −V
s1
PLDC−V
s1
2th mean−F
0
max−F
0
3th max−E PLDC− P
r1
4th max−F
1
PLDC− P
r2
5th max−F
2
mean−F
0
6th max−F
0
PLDC−V
s2
7th PLDC − P
r1
max−E
8th max−Z PLDC− P
d1
9th mean−E PLDC− P
d2
10th mean−Z max−F
1
From table 1, we can see that, under the same con-
ditions, the proposed PLDC features is sorted in the
head of other features both in SFS and SBS. That
means the PLDC features are closely linked to emo-
tion expression.
4.2 Comparative Emotion Recognition
SVM is a novel type of learning machine, which bases
on statistical learning theory (SLT)(Cortes and Vap-
nik, 1995). Some studies suggest that SVM classifier
is more effective than others in speech emotion recog-
nition(Lin and Wei, 2005; Schuller et al., 2005). For
these reasons, we use SVM as classifiers for compar-
ative emotion recognition. The Sigmoid function is
selected for kernel function. Half of the samples in
S70 are selected randomly for five times to train clas-
sifiers, while the utterances left are objects to be rec-
ognized. The average recognition results using tradi-
tional features and using the proposed PLDC features
are shown in table 2 and table 3.
Table 2: Results using traditional features.
Emo. Sad. Ang. Sur. Fea. Hap. Dis.
Sad. 0.539 0 0 0.289 0 0.172
Ang.
0 0.717 0.111 0.033 0.128 0.011
Sur.
0.022 0.072 0.444 0.083 0.211 0.167
Fea.
0.267 0 0.033 0.367 0.044 0.289
Hap.
0.011 0.039 0.311 0.017 0.522 0.101
Dis.
0.117 0.017 0.067 0.156 0.217 0.428
Table 3: Results using the proposed PLDC features.
Emo. Sad. Ang. Sur. Fea. Hap. Dis.
Sad. 0.717 0 0 0.117 0 0.167
Ang.
0 0.822 0.056 0.033 0.083 0.006
Sur.
0.011 0.022 0.678 0.133 0.094 0.061
Fea.
0.226 0 0.028 0.4 0.044 0.272
Hap.
0.006 0.039 0.167 0.022 0.672 0.094
Dis.
0.106 0.028 0.067 0.156 0.172 0.472
Data from table 2 and table 3 shows that the av-
erage emotion recognition rate are increased by using
the proposed PLDC features. The recognition rate for
the emotions of surprise, anger, happiness and sad-
ness are increased most significantly.
5 CONCLUSIONS
In this paper, we propose a kind of novel speech emo-
tion features, PLDC, to recognize emotional states
contained in spoken language. This kind of features
are obtained based on EGG signal which avoid the
influence of vocal tract and aerodynamic noise. Com-
parative experiments based on SVM proved that the
proposed features have high relativity with the speech
emotion.
ACKNOWLEDGEMENTS
This research is supported by the International Sci-
ence and Technology Cooperation Program of China
(No.2010DFA11990) and the National Nature Sci-
ence Foundation of China (No. 61103097).
REFERENCES
Atal, B. and Rabiner, L. (1976). A pattern recogni-
tion approach to voiced-unvoiced-silence classifica-
SPEECH EMOTIONAL FEATURES MEASURED BY POWER-LAW DISTRIBUTION BASED ON
ELECTROGLOTTOGRAPHY
135

tion with applications to speech recognition. Acous-
tics, Speech and Signal Processing, IEEE Transac-
tions on, 24(3):201–212.
Borchert, M. and Dusterhoft, A. (2005). Emotions in
speech-experiments with prosody and quality features
in speech for use in categorical and dimensional emo-
tion recognition environments. In Natural Language
Processing and Knowledge Engineering, 2005. IEEE
NLP-KE’05. Proceedings of 2005 IEEE International
Conference on, pages 147–151. IEEE.
Cortes, C. and Vapnik, V. (1995). Support-vector networks.
Machine learning, 20(3):273–297.
Cowie, R. and Cornelius, R. (2003). Describing the emo-
tional states that are expressed in speech. Speech
Communication, 40(1-2):5–32.
Kania, R., Hartl, D., Hans, S., Maeda, S., Vaissiere,
J., and Brasnu, D. (2006). Fundamental frequency
histograms measured by electroglottography during
speech: a pilot study for standardization. Journal of
Voice, 20(1):18–24.
Lin, Y. and Wei, G. (2005). Speech emotion recognition
based on HMM and SVM. In Machine Learning and
Cybernetics, 2005. Proceedings of 2005 International
Conference on, volume 8, pages 4898–4901. IEEE.
Noll, A. (1967). Cepstrum pitch determination. The journal
of the acoustical society of America, 41:293.
Pudil, P., Novovicov´a, J., and Kittler, J. (1994). Floating
search methods in feature selection. Pattern recogni-
tion letters, 15(11):1119–1125.
Schuller, B., Reiter, S., Muller, R., Al-Hames, M., Lang,
M., and Rigoll, G. (2005). Speaker independent
speech emotion recognition by ensemble classifica-
tion. In Multimedia and Expo, 2005. ICME 2005.
IEEE International Conference on, pages 864–867.
IEEE.
Schuller, B., Rigoll, G., and Lang, M. (2004). Speech
emotion recognition combining acoustic features and
linguistic information in a hybrid support vector
machine-belief network architecture. In Acous-
tics, Speech, and Signal Processing, 2004. Proceed-
ings.(ICASSP’04). IEEE International Conference on,
volume 1, pages I577–I580. IEEE.
Shami, M. and Kamel, M. (2005). Segment-based ap-
proach to the recognition of emotions in speech. In
2005 IEEE International Conference on Multimedia
and Expo, pages 1–4. IEEE.
Ververidis, D. and C., K. (2006). Emotional speech
recognition-resources features and methods. Speech
Communication, 48:1162–1181.
Yang, B. and Lugger, M. (2010). Emotion recognition from
speech signals using new harmony features. Signal
Processing, 90(5):1415–1423.
Zhao, L., Cao, Y., Wang, Z., and Zou, C. (2005). Speech
emotional recognition using global and time sequence
structure features with mmd. Affective Computing and
Intelligent Interaction, pages 311–318.
BIOSIGNALS 2012 - International Conference on Bio-inspired Systems and Signal Processing
136
