
NOISE ROBUST SPEAKER VERIFICATION BASED ON THE MFCC
AND pH FEATURES FUSION AND MULTICONDITION TRAINING
L. Z˜ao
1
and R. Coelho
2
1
Graduate Program in Defense Engineering, Military Institute of Engineering (IME), Rio de Janeiro, Brazil
2
Electrical Engineering Department, Military Institute of Engineering (IME), Rio de Janeiro, Brazil
Keywords:
Colored noise, Multicondition training, Speaker verification, α-GMM.
Abstract:
This paper investigates the fusion of Mel-frequency cepstral coefficients (MFCC) and pH features, combined
with the multicondition training (MT) technique based on artificial colored spectra noises, for noise robust
speaker verification. The α-integrated Gaussian mixture models (α-GMM), an extension of the conventional
GMM, are used in the speaker verification experiments. Five real acoustic noises are used to corrupt the
speech signals in different signal-to-noise ratios (SNR) for tests. The experiments results show that the use of
MFCC + pH feature vectors improves the accuracy of speaker verification systems based on single MFCC. It
is also shown that the speaker verification system with the MFCC + pH fusion and the α-GMM with the MT
technique achieves the best performance for the speaker verification task in noisy environments.
1 INTRODUCTION
Over the last decades, automatic speaker verifica-
tion or authentication has been demonstrated to be
an interesting solution for applications with security
concerns, such as access control, data security and
forensic investigations (Naik, 1990) (Campbell et al.,
2009). The main goal of a speaker verification task is
to accept or reject a claimed identity.
Speaker verification systems are composed of a
training and a testing phase. The training phase has
three steps: speech acquisition/pre-processing, fea-
tures extraction and speaker modeling. In the test-
ing phase, the pre-processing and features extraction
steps are also present. Then, the extracted features are
compared to the speakers models and the appropriate
decision is taken.
The MFCC (Davis and Mermelstein, 1980)
and GMM-UBM (universal background model)
(Reynolds and Rose, 1995) based system achieves
high recognition accuracies for clean speech
(Reynolds, 1995). However, its performance can
be severely degraded when the speech signals are
corrupted by acoustic noise (Ming et al., 2007).
This paper proposes the fusion of the MFCC and
pH (Sant’Ana et al., 2006) features combined
with a colored-noise-based multicondition training
(Colored-MT) technique (Z˜ao and Coelho, 2011) to
improve the noise robustness of speaker verification
tasks. The proposed solution is evaluated without any
speech enhancement (Boll, 1979), orthogonalization
(Fukunaga, 1990), missing-feature (Cooke et al.,
2001) or score-normalization (Bimbot et al., 2004)
techniques. The results are presented for the GMM
and α-GMM (Wu et al., 2009) classifiers.
For the verification experiments the speech utter-
ances are collected from the TIMIT database (Fisher
et al., 1986). The speech signals are corrupted by the
acoustic noises (Babble, Destroyer, Factory, Leop-
ard and Volvo) obtained from the NOISEX-92 (Varga
and Steeneken, 1993) database, considering SNR val-
ues of 5, 10, 15 and 20 dB. The experiments results
show that the proposed solution is very promising for
speaker verification in noisy environments.
The remainder of this work is organized as fol-
lows. Section 2 provides the basic concepts of a
speaker verification system, including the speech fea-
tures and classifiers adopted in this work. This Sec-
tion also presents the colored-noise-based multicon-
dition training technique for the α-GMM classifier.
Section 3 describes the speaker verification experi-
ments conductedin different noisy environments. The
results are presented and discussed in the same Sec-
tion. Finally, Section 4 concludes this work.
137
Zão L. and Coelho R..
NOISE ROBUST SPEAKER VERIFICATION BASED ON THE MFCC AND pH FEATURES FUSION AND MULTICONDITION TRAINING.
DOI: 10.5220/0003890501370143
In Proceedings of the International Conference on Bio-inspired Systems and Signal Processing (BIOSIGNALS-2012), pages 137-143
ISBN: 978-989-8425-89-8
Copyright
c
2012 SCITEPRESS (Science and Technology Publications, Lda.)
2 SPEAKER VERIFICATION
Given a claimed identity of a speaker S and an ob-
served speech segment (Y), the verification task can
be stated as a hypothesis test. In fact, the system ac-
cepts one of the following statements as true:
H
0
: Y belongs to speaker S.
H
1
: Y does not belong to speaker S.
To decide whether the observed speech segment
belongs or not to the claimed speaker, the following
log-likelihood ratio test is generally applied:
log p(Y|λ
S
) − log p(Y|λ
UBM
)
≥ θ, accept H
0
< θ, accept H
1
(1)
In (1), p(Y|λ
S
) is the probability density function
(pdf) of Y given it was spoken by the claimed speaker
S, modeled by λ
S
. In the same way, p(Y|λ
UBM
) is
the pdf of Y given that it is not from the claimed
speaker, i. e., the speech segment belongs to an in-
truder. λ
UBM
is generally modeled by GMM-UBM.
The choice of the decision threshold θ is a tradeoff
between the false rejection (FR) and false acceptance
(FA) errors. These probabilities are usually evaluated
by detection error tradeoff (DET) curves. The equal
error rate (EER) corresponds to the point where the
FR and FA probabilities are equal.
2.1 Speech Features
Speech features are generally computed or extracted
using Hamming windows with length of 20 to 30 ms
and 50% of frame period overlapping. From each
frame, a set of coefficients is obtained to form a
speech feature vector.
2.1.1 MFCC
Usually, MFCC is applied as speech feature in
speaker recognition systems since it is considered a
good representation of the human auditory system.
They are extracted using Mel scale band filters. The
Mel-frequency scale is related to the linear-frequency
scale as:
f
MEL
= 1127· log
1+
f
Hz
700
(2)
The MFCC coefficients are then calculated by the
discrete cosine transform (DCT):
c
d
=
F
∑
k=1
S
k
· cos
d
k−
1
2
π
F
, d = 1, 2,...,D,
(3)
where F is the number of filters in the Mel-frequency
filterbank, S
k
is the log-energy output of the k
th
filter,
and D is the number of cepstrum coefficients. The
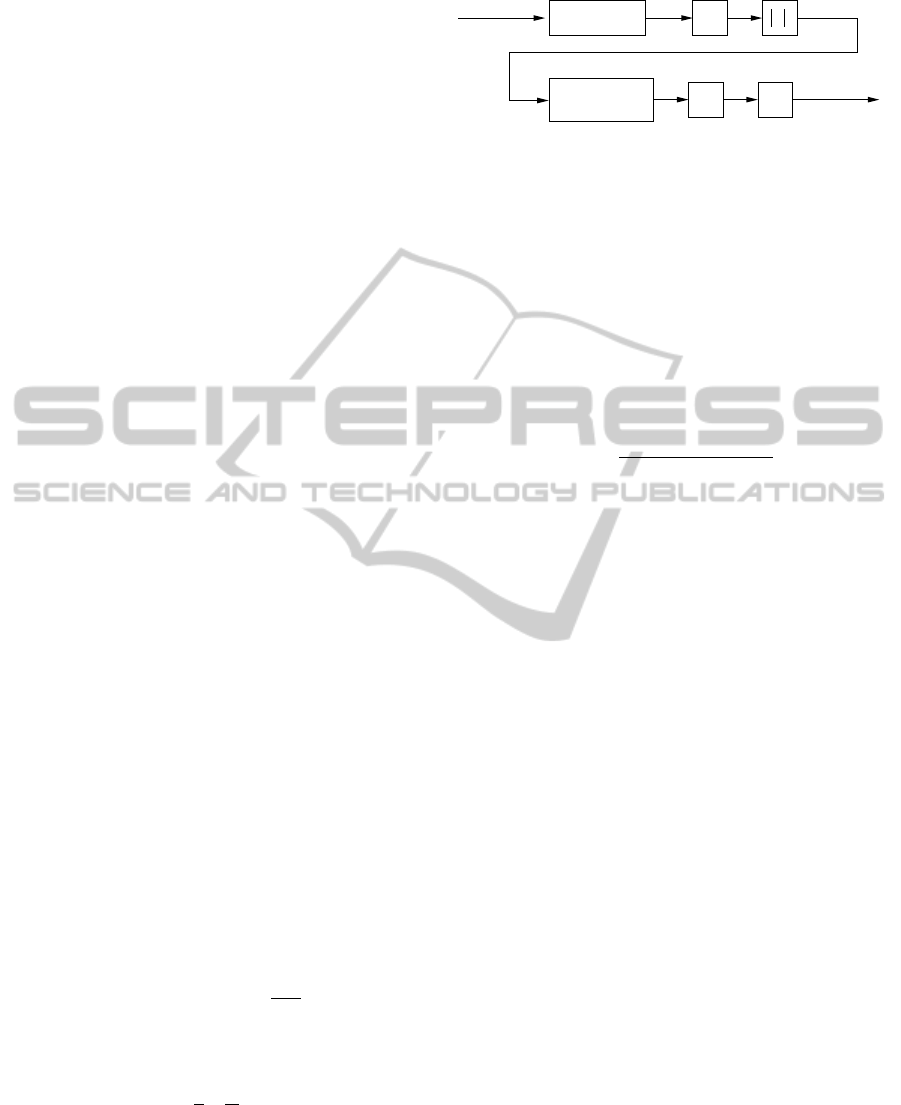
MFCC extraction schematic is depicted in Fig. 1.
DCT
Mel−Frequency
Filterbank
log
Coefficients
MFCC
Speech
Signal
FFT
2
Pre−emphasis
Figure 1: Representation of the MFCC extraction (FFT: fast
Fourier transform).
2.1.2 pH
The pH feature was proposed in (Sant’Ana et al.,
2006) and consists of a vector of Hurst (H) param-
eters. The Hurst parameter (0 ≤ H ≤ 1) expresses the
time-dependence or scaling degree of the speech sig-
nal.
Let the speech signal be represented by a stochas-
tic process X(t), with the normalized autocorrelation
coefficient function defined by
ρ(k) =
Cov[X(t),X(t + k)]
Var[X(t)]
. (4)
The Hurst parameter is defined by the decaying rate
of ρ(k), whose asymptotic behavior is given by
ρ(k) ∼ H(2H − 1)k
2(H−2)
, k → ∞. (5)
The Wavelet-based Multi-dimensional Estimator
(M-dim-wavelets) (Sant’Ana et al., 2006) was pro-
posed as a pH feature extractor and is based on the es-
timator described in (Veitch and Abry, 1999). It uses
the discrete wavelet transform (DWT) to successively
decompose a sequence of speech samples into the ap-
proximation (a( j,k)) and detail (d( j, k)) coefficients,
where j is the decomposition scale and k is the coeffi-
cient index of each scale. From each detail sequence,
d( j, k), generated by the filter bank in a given scale j,
a Hurst parameter H
j
is estimated. The set of H
j
val-
ues and the value obtained for the entire speech signal
(H
0
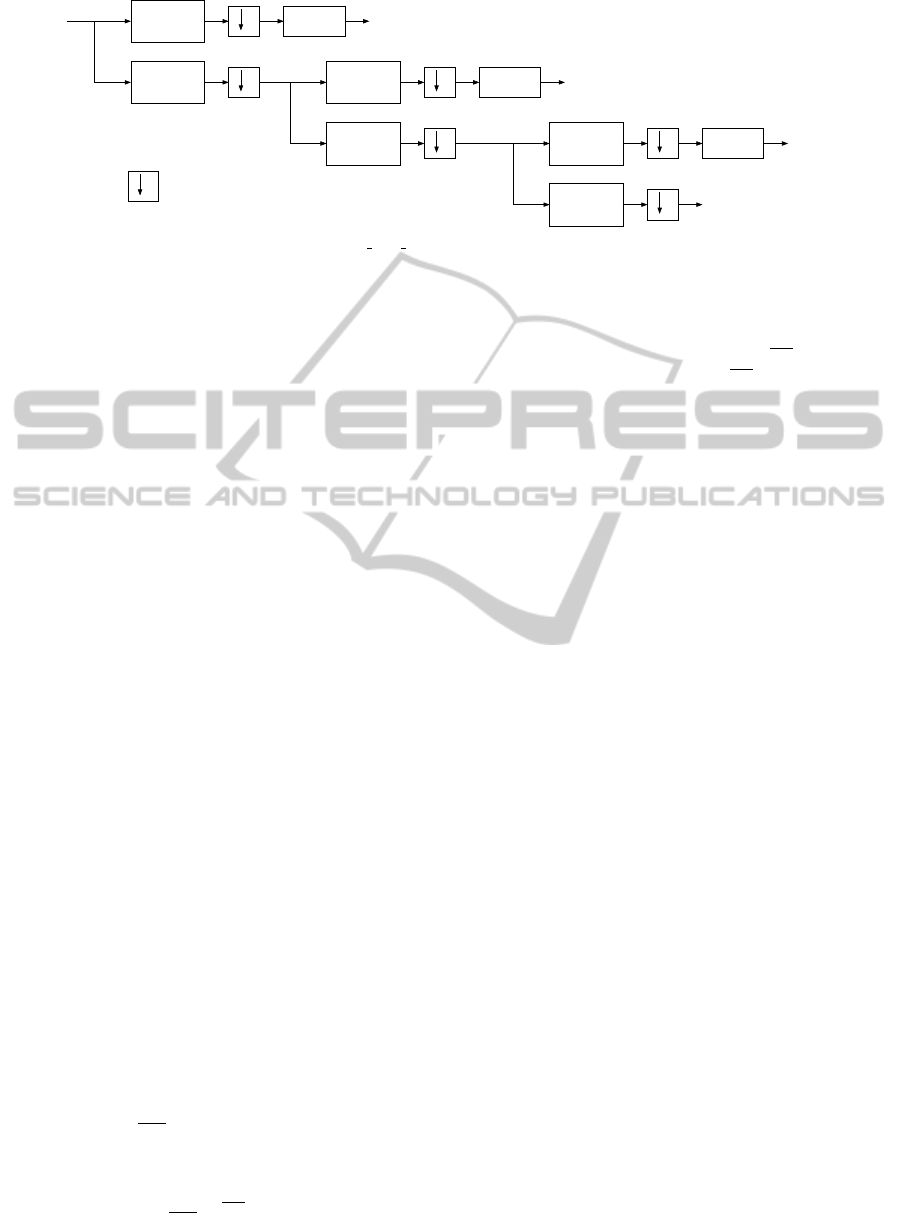
) compose the pH feature. Fig. 2 shows an ex-
ample of the M-dim-wavelets estimator considering 3
decomposition stages. The M-dim-wavelets estima-
tor can be described in the following steps (Sant’Ana
et al., 2006):
1. Wavelet decomposition: the DWT is applied
to the speech samples generating the detail se-
quences d( j,k).
2. Variance estimation of the detail coefficients: for
each scale j, the variance σ
2
j
= (1/n
j
)
∑
k
d( j, k)
2
is evaluated, where n
j
is the number of available
coefficients for each scale j. It can be shown
(Veitch and Abry, 1999) that E[σ
2
j
] = c
γ
j
2H−1
,
where c
γ
is a constant.
3. pH estimation: plot y
j
= log
2
(σ
2
j
) versus j. Using
a weighted linear regression, one get the slope a
BIOSIGNALS 2012 - International Conference on Bio-inspired Systems and Signal Processing
138
2
2
d (2, )k
2
2
d (3, )k
2
2
d (1, )k
2
= Decimator
Band−Pass
Filter
Low−Pass
Filter
Hurst
Estimator
H
2
Band−Pass
Filter
Low−Pass
Filter
Hurst
Estimator
H
3
Band−Pass
Filter
Low−Pass
Filter
Hurst
Estimator
H
1
Figure 2: An example of the pH M dim wavelets estimator with 3 decomposition stages.
of the plot and the Hurst parameter is estimated as
H = (1+ a)/2. Apply the Hurst estimator to the
entire speech signal (H
0
) and then to each of the J
detail sequences obtained in the first step (see Fig
2). The resulting (J + 1) H values compose the
pH feature.
The Daubechies wavelets filters (Daubechies, 1992)
are used in the estimation of the pH vectors. The
multi-resolution analysis (Vetterli and Kovacevic,
1995) adopted in the DWT of the Hurst estimator is
a powerful theory that enables the detail and approx-
imation coefficients to be easily computed by a sim-
ple discrete time convolution. It is important to note
that the linear computational complexity of the pyra-
midal algorithm to obtain the DWT is O(n) where
n is the signal samples length, while the FFT (fast
Fourier transform), used to obtain the Mel-cepstral
coefficients, is O(nlog(n)).
2.2 α-GMM
The α-integrated GMM was proposed in (Wu et al.,
2009) as an extension of the conventional GMM for
speaker classification. The authors were motivated by
the fact that human brains must use complex ways of
informationintegration, such as the α-integration, and
not only the linear combination.
Given a set of Gaussian densities b
i
(~x) and corre-
sponding weights w
i
, i = 1,. ..,M, the α-GMM is de-
fined as the α-integration of the densities (Wu et al.,
2009):
p(~x|λ
S
) = c f
−1
α
(
M
∑
i=1
w
i
f
α
[b
i
(~x)]
)
, (6)
where
f
α
[b
i
(~x)] =
(
2
1−α
b
i
(~x)
(1−α)/2
, α 6= 1
log[b
i
(~x)] , α = 1
, (7)
f
−1
α
(y) =
(
1−α
2
y
2
1−α
, α 6= 1
exp(y), α = 1
, (8)
and c is a normalization constant.
Note that (6) can be rewritten as
p(~x|λ
S
) = c
"
M
∑
i=1
w
i
b
i
(~x)
1−α
2
#
2
1−α
. (9)
As in the regular GMM, the α-GMM of each
speaker S is completely parametrized by the mean
vectors (~µ
i
), covariance matrices (K
i
) and the weights
of the Gaussian densities:
λ
S
= {w
i
,~µ
i
,K
i
|i = 1,. . .,M} . (10)
Let Φ
S
denote the training speech segment of
speaker S, and X the extracted feature matrix com-
posed of feature vectors~x
t
, t = 1,. . .,Q. The parame-
ters of λ
S
are estimated using the adapted expectation-
maximization (EM) algorithm (Wu, 2009) as to max-
imize the likelihood function
p(X|λ
S
) =
Q
∏
t=1
p(~x
t
|λ
S
). (11)
It can be noticed from (9) that the GMM is a
particular case of the α-GMM, which corresponds to
α = −1. By choosing values of α smaller than -1, the
α-GMM classifier emphasizes the larger probability
values, and de-emphasizes the smaller ones. The idea
of this work is to use this property to compensate the
training and testing mismatch caused by environmen-
tal acoustic noises.
2.3 Multicondition Training based on
Colored Noises
This Section presents the colored-noise-based multi-
condition training technique adopted in this work for
the speaker verification task. As introduced in (Z˜ao
and Coelho, 2011), artificial noises are generated with
Gaussian distribution and power spectral densities
(PSD) characterized by the shape S( f) ∝ 1/ f
β
, with
β ∈ [0,2]. The PSD shapes are obtained by filtering
a Gaussian white noise sequence using the Al-Alaoui
(Al-Alaoui, 1993) transfer function.
NOISE ROBUST SPEAKER VERIFICATION BASED ON THE MFCC AND pH FEATURES FUSION AND
MULTICONDITION TRAINING
139
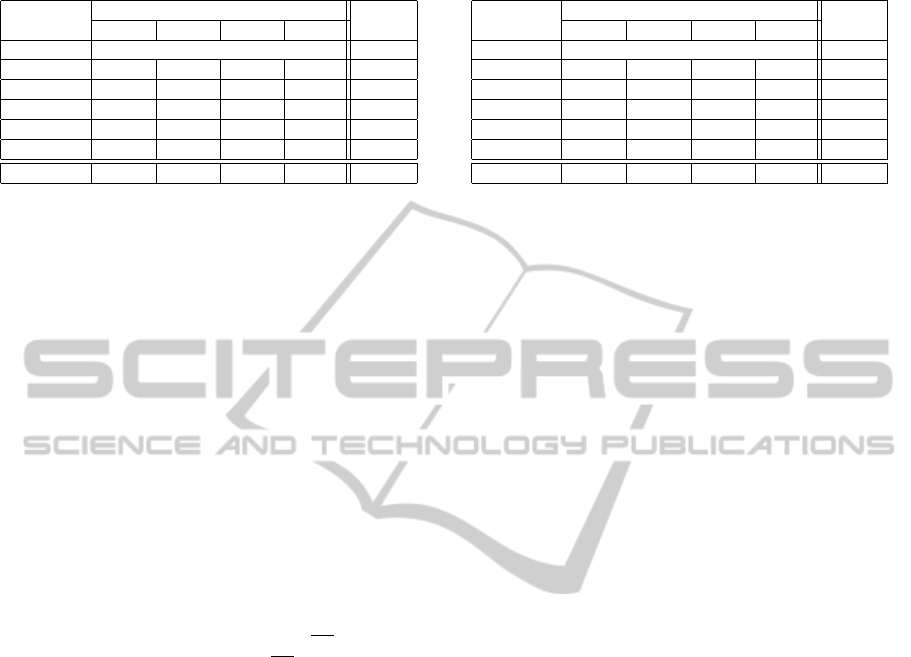
Table 1: EER (%) obtained from speaker verification tests
with MFCC feature vectors and the GMM classifier.
Noise
SNR
Average
20 dB 15 dB 10 dB 5 dB
Clean 1.48
Babble 2.85 5.06 11.20 25.00 11.03
Destroyer 4.84 12.14 23.70 37.16 19.46
Factory 5.04 10.13 19.94 30.98 16.52
Leopard 4.43 8.35 14.92 23.92 12.91
Volvo 4.60 7.40 13.26 20.51 11.44
Average 4.35 8.62 16.60 27.51 14.27
For each speaker S, multiple copies of the clean
training utterance Φ
S
are corrupted by the artificial
colored noises, resulting in multicondition data sets
Φ
l
S
(l = 1, ..., m). Following the procedure addressed
in Section 2.2, m α-GMM (λ
l
S
) for speaker S are ob-
tained from the corrupted data sets Φ
l
S
. In analogy to
(10), each of these models are parametrized by
λ
l
S
= {w
l
i
,~µ
l
i
,K
l
i
|i = 1,... ,M} , l = 1,... ,m.
(12)
The colored multicondition training model (Λ
S
) of
speaker S is given by the collection of all the parame-
ters estimated in (12), i. e.,
Λ
S
= {w
l
i
,~µ
l
i
,K
l
i
|l = 1, ...,m; i = 1,... ,M}. (13)
In order to adapt the Colored-MT to the α-GMM
classifier, the probability p(~x|λ
S
) is adjusted to follow
the α-integration of all m× M Gaussian densities:
p(~x|Λ
S
) = c
′
"
m
∑
l=1
M
∑
i=1
w
l
i
b
l
i
(~x)
1−α
2
#
2
1−α
, (14)
where c
′
is a new normalization constant.
3 EXPERIMENTS AND RESULTS
The speaker verification experiments are conducted
with a subset composed of 168 speakers (106 males
and 62 females) of the TIMIT database (Fisher et al.,
1986). The speech database is composed of ten utter-
ances per speaker, with sampling rate of 16 kHz and
average duration of 3 seconds. The speech segments
of ten speakers (5 males and 5 females) are concate-
nated to obtain the UBM. From each of the 158 re-
maining speakers, eight utterances are separated to
train the models, and the other two are used for tests.
Five environmental acoustic noises (Babble, De-
stroyer, Factory, Leopard and Volvo), collected from
NOISEX-92 database (Varga and Steeneken, 1993),
are used to corrupt the test speech utterances. The
values of SNR adopted for the tests are 5, 10, 15 and
20 dB, and also the clean speech.
Table 2: EER (%) obtained from speaker verification tests
with MFCC + pH feature vectors and the GMM classifier.
Noise
SNR
Average
20 dB 15 dB 10 dB 5 dB
Clean 1.31
Babble 2.85 4.97 11.53 23.55 10.72
Destroyer 4.75 11.17 22.73 35.76 18.60
Factory 3.91 7.38 13.92 25.63 12.71
Leopard 4.11 7.09 14.44 22.45 12.02
Volvo 3.16 5.78 9.49 16.14 8.65
Average 3.76 7.28 14.42 24.71 12.54
Two sets of experiments are presented in this
work. In the first one, the speaker verification task
is evaluated with the α-GMM classifiers considering
the MFCC and the fusion of MFCC and pH as speech
feature vectors. All the α-GMM are obtained with
32 Gaussian densities. The conventional GMM is a
particular case of the α-GMM classifier (α = −1).
The second set of experiments are conducted with
the MFCC + pH features fusion combined with the
Colored-MT technique and the α-GMM classifier.
3.1 MFCC and pH Fusion
The MFCC feature matrix is composed by 12-
dimensional vectors, obtained from frames of 20 ms
and 50% of frame overlapping. It is adopted a Mel-
scale filterbank composed by 26 filters and a pre-
emphasis factor of 0.97. The pH are estimated from
three consecutive speech frames using Daubechies
wavelets filters (Daubechies, 1992) with 12 coeffi-
cients, using scale range from 2 to 8. A total of J = 8
decomposition scales are considered to obtain the H
j
values. Including the estimated values of H
0
from
the original speech signal, 9-dimensional pH vectors
are extracted to compose the feature matrices. Thus,
in the experiments with the MFCC + pH fusion, the
speech feature vectors have 21 components.
3.1.1 GMM
Tabs. 1 and 2 show the EER results obtained from
the speaker verification experiments considering the
GMM with single MFCC and MFCC + pH feature
vectors, respectively. Note that, compared to single
MFCC, the MFCC + pH fusion achieves better accu-
racy, i. e., lower EER values, for all the five noise
sources and also for clean speech. The contribution
of the pH feature achieves 6.02% of absolute EER re-
duction for test utterances corrupted by the Factory
noise with SNR of 10 dB. The average EER results
considering all five noises is reduced from 14.27%
to 12.54%, which represents 1.73% of absolute im-
provement. Fig. 3 illustrates the DET curves obtained
BIOSIGNALS 2012 - International Conference on Bio-inspired Systems and Signal Processing
140
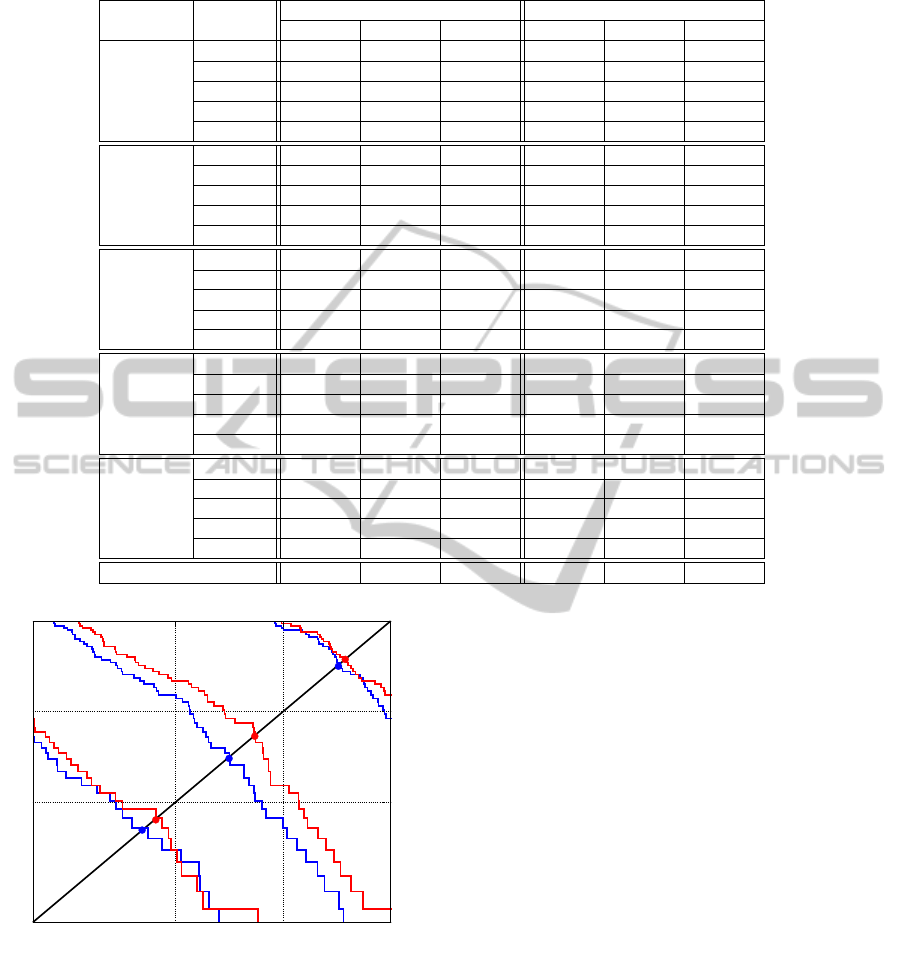
Table 3: EER (%) obtained of speaker verification tests with the α-GMM classifier for different values of α.
Noise SNR
MFCC MFCC + pH
α = −4 α = −6 α = −8 α = −4 α = −6 α = −8
Babble
20 dB 2.97 3.52 2.54 3.05 3.00 3.48
15 dB 4.94 5.06 4.55 5.06 5.06 5.35
10 dB 12.03 12.12 11.08 11.08 11.39 12.44
5 dB 26.58 25.00 24.37 22.47 24.03 24.07
Average 11.63 11.43 10.63 10.41 10.87 11.34
Destroyer
20 dB 5.29 5.38 4.65 5.25 4.72 5.45
15 dB 12.08 11.70 11.71 12.34 10.30 12.34
10 dB 23.42 22.54 22.15 22.47 23.56 23.32
5 dB 34.81 34.49 34.72 35.76 38.03 37.44
Average 18.90 18.53 18.31 18.96 19.15 19.64
Factory
20 dB 5.06 5.18 5.06 4.18 4.04 4.98
15 dB 10.50 10.13 10.35 8.22 7.79 8.49
10 dB 20.57 19.30 19.94 15.05 15.19 15.82
5 dB 30.66 30.35 29.11 25.26 26.27 25.85
Average 16.70 16.24 16.12 13.18 13.32 13.79
Leopard
20 dB 4.71 4.75 4.36 4.11 4.75 4.84
15 dB 9.81 8.93 8.82 7.41 7.59 8.23
10 dB 17.24 17.12 16.46 14.45 14.24 14.56
5 dB 25.85 24.68 25.58 21.20 22.15 23.10
Average 14.40 13.87 13.80 11.79 12.18 12.68
Volvo
20 dB 4.75 4.75 4.53 3.80 3.16 3.85
15 dB 8.21 8.10 9.28 5.70 6.09 6.75
10 dB 13.93 13.24 15.11 10.24 10.38 10.79
5 dB 20.25 20.57 21.20 16.77 16.38 16.77
Average 11.79 11.91 12.53 9.13 9.01 9.54
Average 14.68 14.40 14.28 12.69 12.91 13.40
2010
5
2
False Acceptance Rate (%)
20
10
5
2
False Rejection Rate (%)
2010
5
2
20
10
5
2
SNR = 20 dB
SNR = 15 dB
SNR = 10 dB
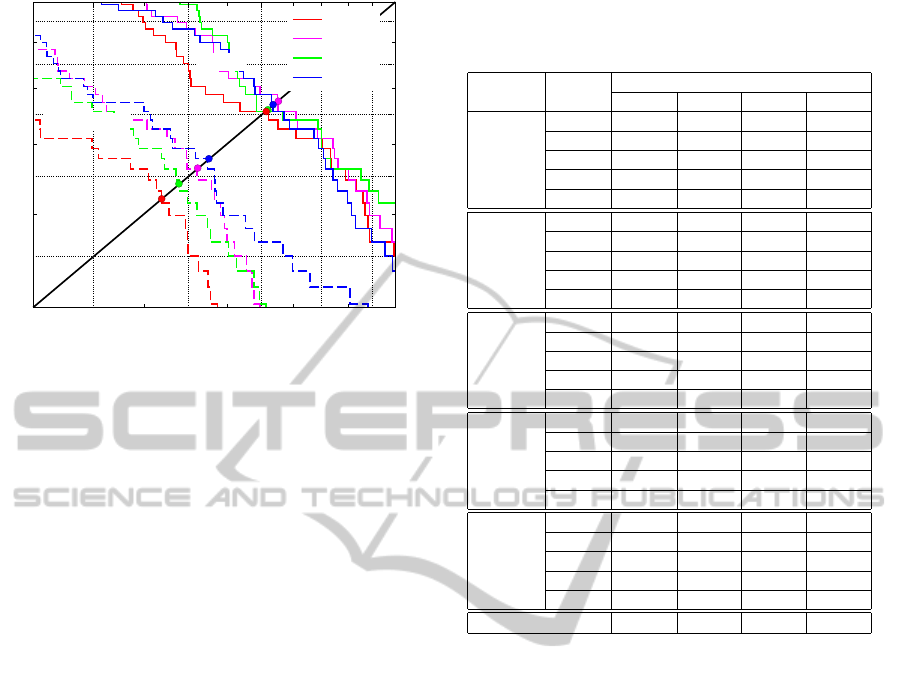
Figure 3: The DET curves obtained with 12 MFCC (red
lines) and 12 MFCC + 9 pH (blue lines) with the GMM
classifier for test speech signals corrupted by the Leopard
noise with SNR of 20, 15 and 10 dB.
with the MFCC + pH fusion (blue lines), and with the
single MFCC (red lines) for the Leopard noise and
SNR values of 20, 15 and 10 dB.
3.1.2 α-GMM
This Section presents the results obtained with the
single MFCC and MFCC + pH feature vectors con-
sidering the α-GMM with values of α: -4, -6 and -8.
Tab. 3 shows the EER values obtained with the
testing speech utterances corrupted by the five acous-
tic noises. It can be seen that the best average accu-
racy was achieved with α = −4 and for the MFCC
+ pH fusion. This performance was achieved for all
acoustic noises except for the Destroyer. The best av-
erage EER improvement of 3.52% was achieved for
the Factory noise. It is important to notice that the
α-GMM-based system does not outperform the con-
ventional GMM (α = −1) approach (refer to Tabs. 1
and 2).
Fig. 4 illustrates the DET curves for the Fac-
tory noise with SNR of 15 dB obtained for the GMM
(α = −1) and α-GMM classifiers. The dashed (bot-
tom) lines indicate the operating points obtained with
the fusion of MFCC + pH features, while the continu-
ous (top) lines are related to the single MFCC feature.
Note that, considering each set of speech features, the
GMM-based systems (red curves) achieve better per-
formance than those based on the α-GMM classifier.
NOISE ROBUST SPEAKER VERIFICATION BASED ON THE MFCC AND pH FEATURES FUSION AND
MULTICONDITION TRAINING
141
6
8 10 12 14
False Acceptance Rate (%)
6
8
10
12
14
False Rejection Rate (%)
10
5
10
5
α = −1
α = −4
α = −6
α = −8
MFCC + pH
MFCC
Figure 4: The DET curves obtained with 12 MFCC (con-
tinuous lines) and 12 MFCC + 9 pH (dashed lines) with the
α-GMM classifier for test speech corrupted with Factory
noise and SNR of 15 dB.
3.2 Colored-MT Technique
Following the procedure defined in (Z˜ao and Coelho,
2011), three artificial noises are generated for the
Colored-MT technique, with colored spectra defined
by the PSD decaying rate: β = 0 (white), β = 1 (pink)
and β = 2 (brown). These noises are used to corrupt
all the speech segments available for training with
SNR of 15 dB, including the UBM. The MFCC + pH
feature matrices, extracted from each of the corrupted
training utterances, are used to obtain the α-GMM.
Thus, a total of 3 × 32 = 96 Gaussian densities are
stored for each speaker. Tab. 4 presents the EER re-
sults obtained in the experiments with the Colored-
MT technique with α-GMM classifier. The results are
presented considering the values of α: -1, -4, -6 and
-8.
The use of GMM with the Colored-MT leads to
an average EER of 6.96% (Tab. 4). This means an
absolute improvement of 5.58% in the EER when
compared to the accuracy results with the MFCC
+ pH vectors and the GMM without the multicon-
dition training. It can also be observed that with
the Colored-MT the α-GMM classifier with α = −6
achieves the best verification accuracy, for all the five
noise sources.
4 CONCLUSIONS
This paper examined the use of the fusion of the
MFCC and pH speech features and the colored-noise-
based multicondition training technique for noise ro-
bust speaker verification. The GMM and α-GMM
Table 4: EER (%) of speaker verification experiments with
MFCC + pH features with the Colored-MT technique and
the α-GMM classifier.
Noise SNR
α-GMM classifier
α = −1 α = −4 α = −6 α = −8
Babble
20 dB 3.80 2.85 3.48 3.03
15 dB 4.11 3.82 3.98 3.48
10 dB 6.52 6.33 5.92 6.27
5 dB 12.34 12.34 12.28 12.97
Average 6.69 6.33 6.41 6.44
Destroyer
20 dB 6.95 6.65 6.01 6.26
15 dB 11.25 11.08 10.37 10.44
10 dB 19.43 18.35 18.04 17.72
5 dB 30.38 30.91 29.69 28.39
Average 17.00 16.75 16.03 15.70
Factory
20 dB 1.58 1.58 1.90 1.75
15 dB 1.58 2.17 1.74 1.77
10 dB 3.16 3.34 2.95 3.41
5 dB 7.02 6.96 6.96 6.88
Average 3.34 3.51 3.39 3.45
Leopard
20 dB 2.41 2.45 2.25 2.85
15 dB 2.90 3.28 2.99 3.14
10 dB 5.56 6.52 5.44 6.01
5 dB 12.26 13.61 11.70 13.29
Average 5.78 6.46 5.59 6.32
Volvo
20 dB 1.82 1.56 1.58 1.90
15 dB 1.36 1.26 1.54 2.14
10 dB 1.58 1.77 1.58 1.90
5 dB 3.16 2.85 2.85 3.16
Average 1.98 1.86 1.89 2.28
Average 6.96 6.98 6.66 6.84
were considered for the speaker and intruder mod-
eling. The experiments were conducted with a sub-
set of the TIMIT database corrupted with five acous-
tic noises from NOISEX-92, with different values of
SNR. The results showed that the MFCC + pH vec-
tors and the α-GMM under multicondition training
achieved the best improvement for the speaker veri-
fication task in noisy environments.
ACKNOWLEDGEMENTS
This work was partially supported by the Univer-
sal/CNPq (472461/2009-5) research grant.
REFERENCES
Al-Alaoui, M. (1993). Novel digital integrator and differ-
entiator. Electronics Letters, 29(4):376–378.
Bimbot, F., Bonastre, J. F., Fredouille, C., Gravier, G.,
Chagnolleau, M. I., Meignier, S., Merlin, T., Garcia,
O. J., Delacretaz, P., and Reynolds (2004). A Tutorial
on Text-Independent Speaker Verification. EURASIP
Journal on Applied Signal Processing, 4:430–451.
BIOSIGNALS 2012 - International Conference on Bio-inspired Systems and Signal Processing
142

Boll, S. (1979). Suppression of Acoustic Noise in Speech
Using Spectral Subtraction. IEEE Transactions on
Acoustics, Speech and Signal Processing, 27:113–
120.
Campbell, J., Shen, W., Campbell, W., Schwartz, R., Bonas-
tre, J.-F., and Matrouf, D. (2009). Forensic Speaker
Recognition. IEEE Signal Processing Magazine,
26:95–103.
Cooke, M., Green, P., Josifovski, L., and Vizinho, A.
(2001). Robust Automatic Speech Recognition with
Missing and Unreliable Acoustic Data. Speech Com-
munication, 34:267–285.
Daubechies, I. (1992). Ten lectures on wavelets. Society
for Industrial and Applied Mathematics, Philadelphia,
USA.
Davis, S. and Mermelstein, P. (1980). Comparison of para-
metric representations for monosyllabic word recog-
nition in continuously spoken sentences. IEEE Trans-
actions on Acoustics, Speech and Signal Processing,
28(4):357–366.
Fisher, W. M., Doddington, G. R., and Goudie-Marshall,
K. M. (1986). The DARPA Speech Recognition Re-
search Database: Specifications and Status. Pro-
ceedings of DARPA Workshop on Speech Recognition,
pages 93–99.
Fukunaga, K. (1990). Introduction to Statistical Pattern
Recognition (2nd ed.). Academic Press Professional,
Inc., San Diego, CA, USA.
Ming, J., Hazen, T., Glass, J., and Reynolds, D. (2007). Ro-
bust speaker recognition in noisy conditions. IEEE
Transactions on Audio, Speech, and Language Pro-
cessing, 15(5):1711–1723.
Naik, J. (1990). Speaker Verification: A Tutorial. IEEE
Communications Magazine, pages 42–48.
Reynolds, D. and Rose, R. (1995). Robust text independent
speaker identification using gaussian mixture speaker
models. IEEE Trans. on Speech and Audio Process-
ing, 3:72–82.
Reynolds, D. A. (1995). Speaker identification and verifica-
tion using gaussian mixture speaker models. Speech
Communication, 17:91–108.
Sant’Ana, R., Coelho, R., and Alcaim, A. (2006). Text-
Independent Speaker Recognition Based on the Hurst
Parameter and the Multidimensional Fractional Brow-
nian Motion Model. IEEE Transactions on Audio,
Speech and Language Processing, 14(3):931–940.
Varga, A. and Steeneken, H. (1993). Assessment for au-
tomatic speech recognition ii: Noisex-92: a database
and an experiment to study the effect of additive noise
on speech recognition systems. Speech Communica-
tions, 12(3):247–251.
Veitch, D. and Abry, P. (1999). A wavelet-based joint es-
timator of the parameters of long-range dependence.
IEEE Transactions on Information Theory, 45(3):878
–897.
Vetterli, M. and Kovacevic, J. (1995). Wavelets and sub-
band coding. Englewood Cliffs: Prentice-Hall.
Wu, D. (2009). Parameter Estimation for α-GMM Based on
Maximum Likelihood Criterion. Neural Computation,
21(6):1776–1795.
Wu, D., Li, J., and Wu, H. (2009). α-Gaussian Mixture
Modelling for Speaker Recognition. Pattern Recogni-
tion Letters, 30(6):589–594.
Z˜ao, L. and Coelho, R. (2011). Colored noise based multi-
condition training technique for robust speaker identi-
fication. IEEE Signal Processing Letters, 18(11):675–
678.
NOISE ROBUST SPEAKER VERIFICATION BASED ON THE MFCC AND pH FEATURES FUSION AND
MULTICONDITION TRAINING
143
