
AUTOMATIC DETECTION OF HARD EXUDATES AND OPTIC DISC
IN DIGITAL FUNDUS IMAGES
Elizabeth Chavez-Hernandez
1
and M. Elena Martinez-Perez
2
1
Postgraduate Program in Computer Science and Engineering, Insituto de Investigaciones en Matem
´
aticas Aplicadas y en
Sistemas, Universidad Nacional Aut
´
onoma de M
´
exico, 04510 M
´
exico City, M
´
exico
2
Department of Computer Science, Instituto de Investigaciones en Matem
´
aticas Aplicadas y en Sistemas
Universidad Nacional Aut
´
onoma de M
´
exico, Apartado Postal 20-726, 04510 M
´
exico City, M
´
exico
Keywords:
Hard exudates, Optic disc, Segmentation, Retinal images.
Abstract:
Automatic detection of characteristic patterns of diabetic retinopathy such as hard exudates may help to an
early diagnosis. Methods for automatic detection of hard exudates and optic disc are presented. Exudates
detection involves a preprocessing stage, threshold selection and region growing. For optic disc detection
a Bayes classifier is applied followed by mathematical morphology techniques in order to improve the final
result. The methods here presented were evaluated using the IMAGERET database, which contains fundus
images evaluated by qualified experts. In average, the area of exudates automatically detected overlaped
with 60.75% and 63.91% areas defined by each of the two experts. For optic disc detection, sensitivity and
specificity were 72.12% and 95.56% respectively.
1 INTRODUCTION
Diabetes Mellitus (DM) has became a public health
problem worldwide. Diabetic retino- pathy (DR) is
an illness that affects blood vessels in the retina,
and it is directly correlated with evolution time of
DM and if it is not early detected may cause par-
tial or even total blindness (Pereira Delgado, 2005).
One of the observed patterns in fundus images of
RD patients are the hard exudates, shinny and yel-
lowish intraretinal protein deposits of irregular shape.
The optic disc (OD) is observed with similar inten-
sities as the exudates but its shape is more regular
and it does not represent a pathological sign. De-
tection of OD is an important step in developing sys-
tems for automatic diagnosis of various serious oph-
thalmic pathologies. There are previous works re-
lated with the detection of exudates such as those
based on a combination of local and global threshold-
ing (Phillips et al., 1993); color normalization, local
contrast enhancement followed by a fuzzy C-means
clustering and neural networks (Osareh et al., 2001);
finally those based on recursive region growing thech-
nique (Sinthanayothin et al., 1999). For OD detec-
tion methods can be grouped into three types: i) re-
lated with location, generally representative of its cen-
ter (Foracchia et al., 2004); ii) templated-based meth-
ods to obtein OD boundary approximation (Wong
et al., 2008); and iii) based on deformable models or
snakes (Xu et al., 2007). In this work, we present
an alternative methodology for hard exudates and op-
tic disc detection. Segmentation preliminary results
are evaluated using the public database IMAGERET-
DIARETDB1 V2.1 (Kauppi et al., 2009).
2 HARD EXUDATES
RECOGNITION
In order to reduce the shade effect of the non uni-
form lightening, a process of contrast correction is
needed (Fleming et al., 2006). First, a 3 × 3 pixels
median filter is applied to the green component of the
RGB image, followed by a gaussian filter with σ = 2,
the resulting image is called I. Second, a 35 × 35 pix-
els median filter is applied to the green component of
the original RGB image, calling G
0
to this image. Im-
age S
0
is calculated by S
0
= I/G
0
− 1, and finally, con-
trast corrected image is obtained after normalizing S
0
by its standard deviation, S = S
0
/std(S
0
) (Figure 1b).
2.1 Threshold Selection and Region
Growing
The objective of the first stage of our method is to
543
Chavez-Hernandez E. and Elena Martinez-Perez M..
AUTOMATIC DETECTION OF HARD EXUDATES AND OPTIC DISC IN DIGITAL FUNDUS IMAGES.
DOI: 10.5220/0003890905430547
In Proceedings of the International Conference on Bio-inspired Systems and Signal Processing (MIAD-2012), pages 543-547
ISBN: 978-989-8425-89-8
Copyright
c
2012 SCITEPRESS (Science and Technology Publications, Lda.)
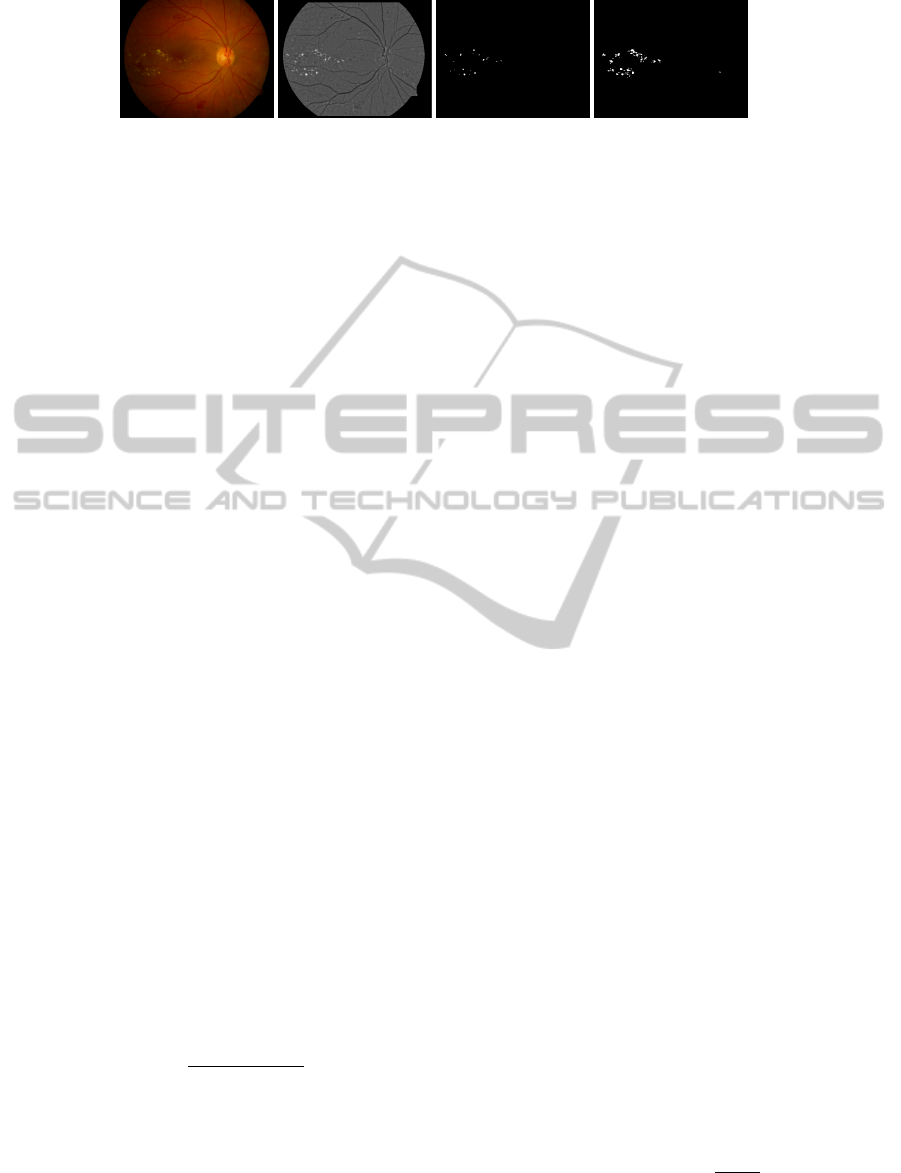
(a) (b) (c) (d)
Figure 1: (a) Original images (S). (b) Contrast correction of image. (c) Binary image resulted by the threshold method (BW1).
(d) Final recognition of hard exudates.
find an optimal threshold t that discriminates between
two classes of pixels, the background, and exudates.
For this purpose the Otsu method (Otsu, 1979) is ap-
plied to identify a threshold t
0
. In order to minimize
false positives this step is repeated a second time over
the region with intensities higher than t
0
, resulting in
a threshold value t. The binary image with thresh-
old t is called BW 1 (Figure 1c). To improve exudates
detection and correct for the underselection, BW 1 im-
age is considered as seed regions for exudates, BW1
is then dilated by 15 pixels, and the followed criterion
is applied for every pixel p(i, j) in the dilated region,
p
(i, j)
=
exudate if p ≥ (t − 2s)
background if p < (t − 2s)
(1)
where t is threshold found in the first stage and s,
the standard deviation of seed pixels defined by BW1.
By this, candidate pixels with intensities greater than
t −2s are classified as exudates and, pixels with inten-
sities below this, are classified as background (Figure
1d).
3 OPTIC DISC DETECTION
3.1 Bayes Classifier
A Bayes classifier is applied in order to obtain a bi-
nary image with only two classes of pixels, the so
called disc and background. Probabilities are calcu-
lated using training images on which the class for
each pixel is known, as defined by experts. The prob-
ability of a pattern to belong to the class C
k
is obtained
as:
p(C
k
| x) =
p(x | C
k
)p(C
k
)
p(x)
(2)
Assigning a pattern x to the class with the highest a
posteriori probability minimises the error probability,
then, we assign a pattern x to a class if:
p(C
k
| x) > p(C
j
| x) ∀ j 6= k (3)
The first step was then to choose a set of im-
ages to train the classifier, for this purpose 10 im-
ages were randomly chosen from the database IM-
AGERET (Kauppi et al., 2009). The characteristics
considered for the training step were the following:
1. Red band of the original RGB image,called R.
2. Green band of the original RGB image, called G.
3. Variance image of G, this is calculated as
in (Sinthanayothin et al., 1999), a subimage
W (i, j) is defined centered in the pixel (i, j) of di-
mensions M × M. Let
h
f
i
W (i, j)
be the mean inten-
sity in W (i, j). The variance image is given by:
V (i, j) =
f
2
W
− (
h
f
i
W
)
2
(4)
where f represents pixel intensity on image G.
4. Value of y axis of pixels on the optic disc, since
optic disc is showed in the central section of im-
ages.
Once the training step has finished, the classifier
should get an image as input and return a binary im-
age, called BW 2 (Figure 2b). However, other tech-
niques are required to accurately define the OD.
3.2 Mathematical Morphology
The second stage on optic disc recognition involves
mathematical morphology in order to discriminate the
OD among the other regions showed as the result of
previous stage. First, a morphological aperture is ap-
plied, this operation removes those clusters with few
pixels. Next, a closure is applied using a disc as struc-
tural element in order to eliminate hypointense re-
gions within the larger clusters in the image. Finally
holes are filled in the clusters on the image. This dark
branches in the OD are due to the blood vessels that
appear as dark areas in the image.
After these operations, the image contains clus-
ters of different sizes, for each of these objects the
area and its roundness is calculated. Roundness is ob-
tained through,
roundness(k
i
) =
4πA
k
i
P
2
k
i
(5)
where A
k
i
is the area of object i and P
k
i
is the perime-
ter of the same object. The optic disc will be that
BIOSIGNALS 2012 - International Conference on Bio-inspired Systems and Signal Processing
544
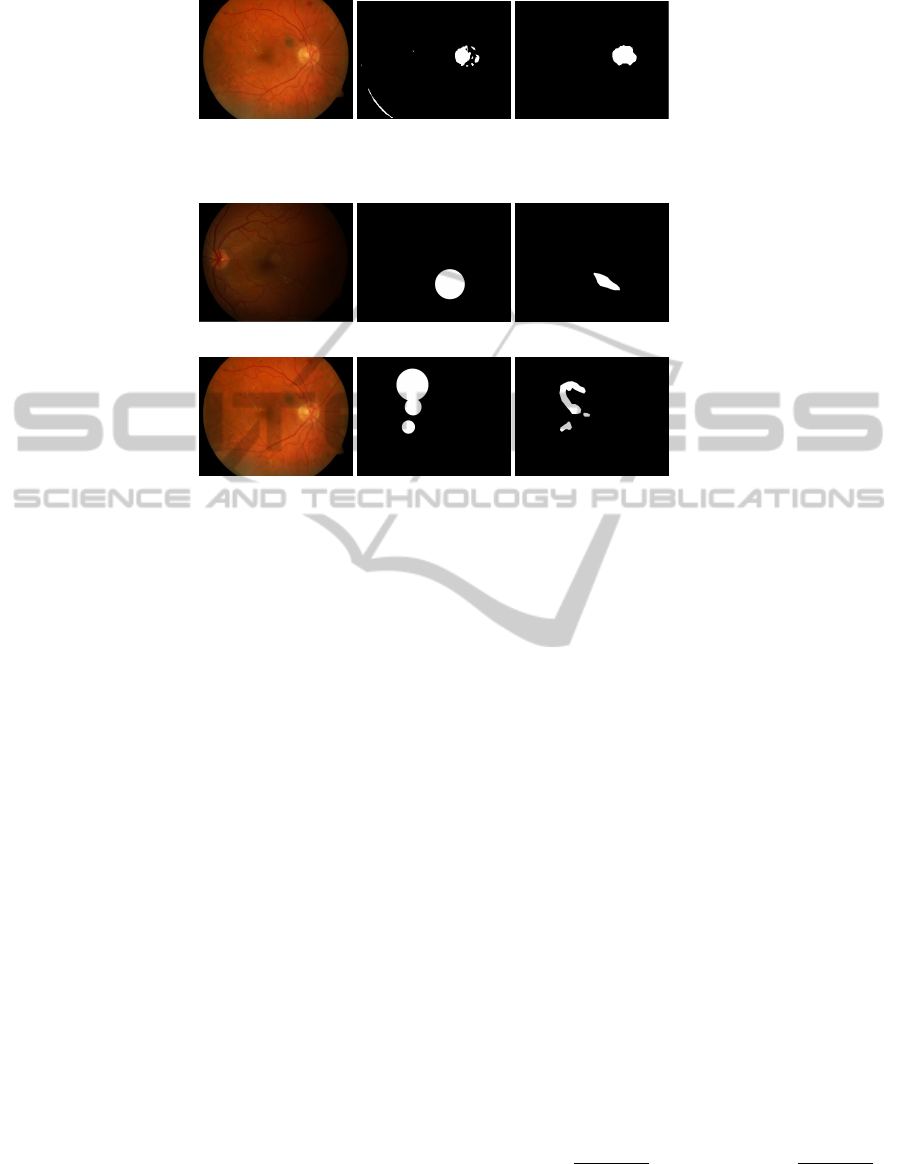
(a) (b) (c)
Figure 2: (a) Original image. (b) Result of Bayes classifier (BW2). (c) Final recognition of optic disc.
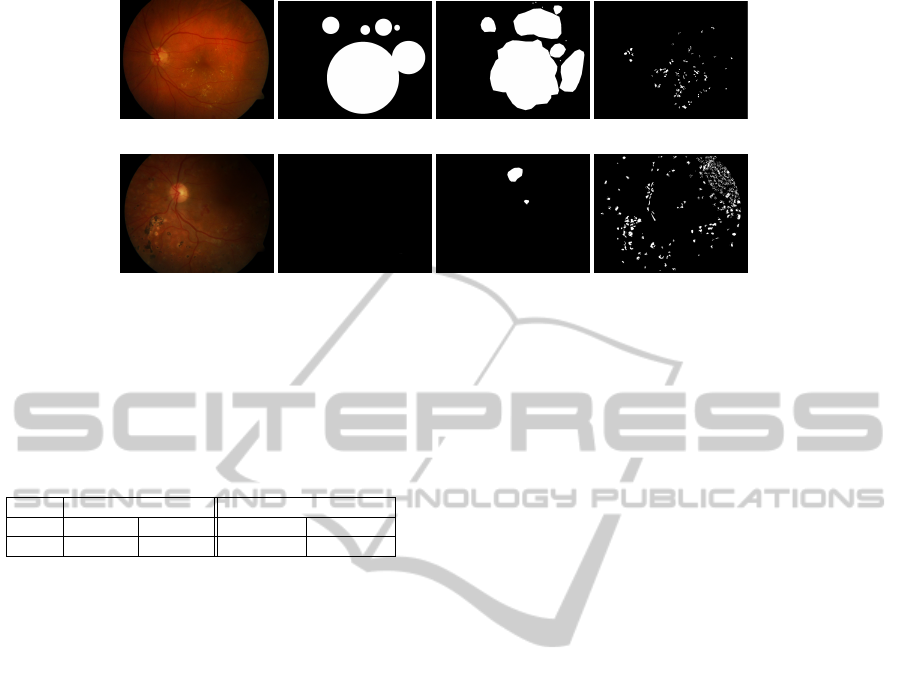
(a) (b) (c)
(d) (e) (f)
Figure 3: (a) and (d) Original images. (b) and (e) Hard exudates found by Expert 1. (c) and (f) Hard exudates found by Expert
2.
object whose roundness is greater than 0.8 and area
greater than 1.5% of the image (Figure 2c). All pa-
rameter values, constants and windows sizes given
along the description of the methodology refer to im-
ages of 1150 × 1500 size in pixels. For different im-
age resolutions, all of these values have to be scaled.
4 EVALUATION
For evaluation of exudates and OD recognition, the
image database IMAGERET (Kauppi et al., 2009)
was used, this database is open access and available
on the web. We used 25 fundus images from this
database where images have been evaluated by ex-
perts, each of them highlighting gross areas where
the experts recognize one of the following patterns:
hard exudates, soft exudates, haemorrhages and red
small dots. The database comes with a Matlab toolkit
that allows to explore annotations by experts. Figure
3 shows examples of two images with hard exudates
from the database and its annotations by experts.
Experts were asked to highlight the areas where
the pattern of interest is found using a circle, ellipse
or a polygon region. From Figure 3, it can be seen that
there are differences between the exudates selected by
different experts, in fact, in some cases there is no
coincidence in the areas detected as containing exu-
dates. As definition, methods of the experts are based
in gross detection and their results are not compara-
ble to the methods presented here, which define the
structures more precisely. Because of that, evaluation
was based on the percentage of the area of exudates
detected contained in the areas defined by experts.
There are cases in which automatic detection of exu-
dates is evaluated as very good, for example in image
13 showed in Figure 4a, since exudates detected are
fully contained within the area defined by the experts.
However, in image 27, showed in Figure 4e, one ex-
pert doesn’t reports exudates while the other reports
an area that only overlap with 1.63% of exudates re-
ported by our results.
This incongruences doesn’t necessarily means
that automatic recognition has been poor, in the case
of image 27, it contains some patterns with intensities
very similar to those of exudates which are probably
due to a treatment that causes scars in the retina. In
average, for the 25 images evaluated, the area of ex-
udates detected by the methods here presented that
is within the area defined by expert 1 is 60.75%, and
63.91% for expert 2, as shown on Table 1. For OD
evaluation, contingency tables were used, and so, sen-
sitivity and specificity were evaluated according to,
Sensitivity =
V P
V P + FN
Speci f icity =
V N
V N + FP
(6)
where V P represents the true positives, V N the true
negatives, FP the false positives and FN the false
AUTOMATIC DETECTION OF HARD EXUDATES AND OPTIC DISC IN DIGITAL FUNDUS IMAGES
545
(a) (b) (c) (d)
(e) (f) (g) (h)
Figure 4: (a) and (e) Original images. (b) and (f) Hard exudates found by Expert 1. (c) and (g) Hard exudates found by Expert
2. (d) and (h) Hard exudates found by our method.
Table 1: Results for evaluation of automatic detection of
exudates and optic disc. The average area of exudates over-
lapped with the areas highlighted by the experts is pre-
sented. Sensitivity and specificity is shown for optic disc
detection.
Hard exudates Optic Disc
Expert 1 Expert 2 Sensitivity Specificity
Mean 60.75% 63.91% 72.12% 95.56%
negatives number of pixels respectively . In Table 1
results for sensitivity and specificity are shown for
25 images from IMAGERET (Kauppi et al., 2009)
database. In average, our methods detect the OD with
sensitivity of 72.12% and specificity of 95.56%.
Ideally, the evaluation of exudates should be done
similar to that of the optic disc, however the database
we used does not allow us to make that assessment.
It is not possible to compare our preliminary results
with other studies since most of these works used their
own databases which are not public. It is necessary
therefore the generation of a public database of pat-
terns marked by experts accurately for a reliable eval-
uation and comparison.
5 CONCLUSIONS
Methods for automatic detection of hard exudates
and optic disc in fundus images were presented.
These methods preserved computational simplicity,
still achieving good results even for images with a
wide range of lightening conditions. Differences in
the selection of exudates by the experts and meth-
ods here presented complicated the definition of good
evaluation techniques. Selection of the optic disc
by the experts was more specific, allowing a better
evaluation of concordance. From our preliminary re-
sults we concluded that a more pattern specific public
database make by experts is needed in order to have a
more reliable evaluation. Work is being done in this
issue.
REFERENCES
Fleming, A., Philip, S., Goatman, K., Olson, J., and Sharp,
P. (2006). Automated microaneurysm detection us-
ing local contrast normalization and local vessel de-
tection. IEEE Transactions on Medical Imaging,
25(9):1223–1232.
Foracchia, M., Grisan, E., and Ruggeri, A. (2004). Detec-
tion of optic disc in retinal images by means of a ge-
ometrical model of vessel. IEEE Trans. Med. Imag.,
23(10):1189–1195.
Kauppi, T., Kalesnykiene, V., Kamarainen, J., Lensu, L.,
and et. al. (2009). Imageret-database. www2.it.lut.fi/
project/imageret/.
Osareh, A., Mirmehdi, M., Thomas, B., and Markham, R.
(2001). Automatic recognition of exudative macu-
lopathy using fuzzy c-means clustering and neural net-
works. In Proc Medical Image Understanding and
Analysis, pages 49–52.
Otsu, N. (1979). A threshold selection method from gray-
level histograms. IEEE Trans. Syst., Man, Cybern.,
9:62–66.
Pereira Delgado, E. (2005). Nuevas perspectivas en oftal-
molog
´
ıa: Retinopat
´
ıa diab
´
etica. Glosa, Laboratorios
Esteve.
Phillips, R., Forrester, J., and Sharp, P. (1993). Auto-
mated detection and quantification of retinal exudates.
Graefe’s Archive for Clinical and Experimental Oph-
thalmology, 231(2):90–94.
Sinthanayothin, C., Boyce, J., Cook, H., and Williamson,
T. (1999). Automated localization of the optic disc,
fovea, and retinal blood vessels from digital colour
fundus images. British Journal of Ophthalmology,
83(8):902–910.
Wong, D. W. K., Liu, J., Lim, J. H., Jia, X., Yin, F., Li, H.,
and Wong, T. Y. (2008). Level-set based automatic
BIOSIGNALS 2012 - International Conference on Bio-inspired Systems and Signal Processing
546

cup-to-disc ratio determination using retinal fundus
images in ARGALI. In Proc. 30th Annu. Int. IEEE
EMBS Conf., pages 2266–2269.
Xu, J., Chutatape, O., Sung, E., Zheng, C., and Kuan, P.
C. T. (2007). Optic disk feature extraction via modi-
fied deformable model technique for glaucoma analy-
sis. Pattern Recognition, 40(7):2063–2076.
AUTOMATIC DETECTION OF HARD EXUDATES AND OPTIC DISC IN DIGITAL FUNDUS IMAGES
547
