
THE VIRTUAL MARGIN OF ERROR
On the Limits of Virtual Machines in Scientific Research
Ulrich Lampe, Andr
´
e Miede, Nils Richerzhagen, Dieter Schuller and Ralf Steinmetz
Multimedia Communications Lab (KOM), TU Darmstadt, Rundeturmstr. 10, 64283 Darmstadt, Germany
Keywords:
Cloud Computing, Cloud Infrastructure, Virtual Machines, Experiments, Time Measurements.
Abstract:
Using Virtual Machines from public cloud providers, researchers gain access to a large pool of experimental
infrastructure at comparatively low cost. However, as it is shown in this position paper based on dedicated
experiments using real-life systems, Virtual Machines often do not provide accurate time measurements. These
limitations are problematic for a variety of use cases, such as the runtime comparison of algorithms in the
computer science domain.
1 INTRODUCTION
Recently, public cloud computing offers, such as Ama-
zon Web Services
1
or Microsoft Windows Azure
2
,
have become a viable option for researchers to conduct
scientific experiments, e. g., (Kohlwey et al., 2011;
Subramanian et al., 2011). These offers permit to ac-
cess a large pool of IT infrastructure in a utility-like
manner (Armbrust et al., 2010; Buyya et al., 2009),
thus potentially reducing or even eliminating the effort
associated with operating large and expensive in-house
IT systems.
In this context, “Infrastructure as a Service” (IaaS)
in the form of Virtual Machines (VMs) is of special
interest, because these VMs allow the execution of
practically any existing software without prior adap-
tation (Briscoe and Marinos, 2009). Thus, VMs can
be regarded as the closest relative of traditional, ded-
icated physical servers – with the obvious difference
that VMs may be rapidly commissioned and decom-
missioned through a few mouse clicks.
However, when we employed a set of VMs at our
own institute in order to conduct runtime measure-
ments of various optimization approaches (Lampe,
2011), we found an unexpectedly high standard de-
viation in the resulting samples. Investigating these
findings further, our suspicion that VMs may have
deficits when it comes to accurate time measurements
was quickly confirmed by a white paper by one of
the leading manufacturers of virtualization software
1
http://aws.amazon.com/
2
http://www.microsoft.com/windowsazure/
(VMware, Inc., 2011).
While these limitations may appear negligible in
most industrial application scenarios, they may have a
substantial impact on the validity of scientific results:
For instance, in computer science, the efficiency of
novel algorithms or heuristics is often shown experi-
mentally through runtime measurements. In fact, more
generally, the differences between two or more systems
are frequently demonstrated using time measurements.
However, in the work at hand, we will stick with the
illustrative example of runtime measurements for algo-
rithms. In such cases, if the collected measurements
are inaccurate in the first place, they can hardly serve
as the basis of valid scientific findings.
Motivated by the statements in aforementioned
white paper and our own preliminary findings, we
have conducted a set of experiments using both virtual
and physical machines. Our aim was to further analyze
and quantify the potential problems with inaccurate
time measurements within VMs. This paper reports
our procedure in this process, the main findings, and
practical implications for researchers.
The remainder of this work is structured as follows:
In Section 2, we briefly describe our experimental
setup. In the following Section 3, the obtained results
are presented and discussed in detail. Practical implica-
tions for researchers are outlined in Section 4. A brief
overview of related work is given in Section 5. The
paper closes with a summary and outlook in Section 6.
64
Lampe U., Miede A., Richerzhagen N., Schuller D. and Steinmetz R..
THE VIRTUAL MARGIN OF ERROR - On the Limits of Virtual Machines in Scientific Research.
DOI: 10.5220/0003895500640069
In Proceedings of the 2nd International Conference on Cloud Computing and Services Science (CLOSER-2012), pages 64-69
ISBN: 978-989-8565-05-1
Copyright
c
2012 SCITEPRESS (Science and Technology Publications, Lda.)

2 EXPERIMENTAL SETUP
In the following, we provide a compact overview of
the setting in which the experiments were conducted,
i. e., the underlying design of our custom-made tool
for experiment automation, the virtual and physical
infrastructure, and the measurement approach.
2.1 Measurement Tool
In order to collect empirical data on the potential mea-
surement inaccuracies within VMs, we have designed
a generic measurement program and implemented it
in Java. The essential idea behind the tool is to call a
certain deterministic method and measure its required
computation time repeatedly. In this context, deter-
ministic means that for a given argument, the method
provides the same result and requires a static amount
of computation time.
For this purpose, we have implemented a simple
function that computes the factorial of a given argu-
ment, i. e., a given integer number. The corresponding
Java code to implement this function is provided in
Listing 1. The tool can be configured to conduct a
series of batches. Each batch comprises a number of
calls of the aforementioned factorial function based on
a given set of arguments. More formally,
b
batches are
subsequently executed, with each batch comprising
c
method calls using the individual arguments
a
from
the set
A = {1, 2,...,2
a
max
}
, respectively. Thus, for
each individual argument,
b ∗c
method calls are con-
ducted, resulting in a total sample of
(a
max
+ 1) ∗b ∗c
observations, each representing a individual runtime
measurement.
As can be seen in the code (cf. Listing 1), the tool
automatically adapts the given argument through mul-
tiplication by a so-called machine speed index. This
index is initially determined by the program and en-
sures that for a given argument
a
, the computation time
is approximately
a ∗10 ms
, regardless of the underly-
ing processor. This ensures that the obtained runtime
measurement observations feature roughly the same
absolute values for identical arguments.
It is important to note that the use of the factorial
function in our experiments is not a necessity. In fact,
any method that has a static runtime for a given argu-
ment (e. g., a simple counter) would serve the purpose.
In the ideal case of perfect measurement accuracy
3
,
such method would exhibit the identical runtime for
a specific argument. Thus, all fluctuations in the ob-
served runtime could be attributed to measurement
inaccuracies.
2.2 Employed Infrastructure
In our experiments, we employed five different ma-
chine configurations. A detailed overview is provided
in Table 1. As can be seen, the configurations allow
two major comparisons:
1.
Between virtual and physical infrastructures based
on the same operating system.
2.
Between different operating systems, namely Mi-
crosoft Windows 7 and Ubuntu Linux 11.10, based
on the identical infrastructure.
Thus, we not only account for potential differences be-
tween virtual and physical infrastructures, but also for
the operation system-specific handling of timekeeping,
cf. (VMware, Inc., 2011).
Four out of the five employed physical and vir-
tual machines were supplied by our institute (KOM),
whereas one machine was leased from the cloud, i. e.,
Amazon Web Services Elastic Compute Cloud (AWS
EC2). Unfortunately, AWS does not offer Microsoft
Windows 7 as operating system presently. Thus, we
had to restrict our experiment to one AWS VM running
Ubuntu Linux.
The VMs from our institute were configured to use
a static amount of both CPU and RAM. Through this
configuration, we aim to minimize potential measure-
3
Please note that in this work, the term “accuracy” is used
in a colloquial, rather than formal manner. Specifically, our
use of the term does not necessarily reflect the common in-
terpretation in the domain of information retrieval (Manning
et al., 2008).
Listing 1: Factorial function used for computation time measurement.
1 public long getFactorialCompTime (long arg , double machineSpeedIndex ) {
2 long adapted A r g = (long) ((double) arg * m a c h i n e S p e e dIndex );
3 BigDecim a l fact = new Bi g D e c i mal (1) ;
4 long startT i m e = S y stem . nanoT i m e ();
5 for (long i = 1; i < a d a ptedArg ; i ++ ) { fa ct . m ultiply (new B i gDecimal ( i ));
}
6 long endT i m e = S ystem . n anoTime ( );
7 return endT i m e - s t a rtTime ;
8 }
THEVIRTUALMARGINOFERROR-OntheLimitsofVirtualMachinesinScientificResearch
65

Table 1: Overview of machine configurations employed in the experiments. Abbreviations: Amazon Web Services Elastic
Compute Cloud (AWS EC2); The authors’ institute (KOM); Elastic Compute Unit (ECU).
ID Machine Supplier Equipment Virtualization Operating
Type CPU RAM Software System
AWS-Lnx Virtual (t1-small) AWS EC2 1 ECU 1.7 GB Xen Ubuntu 11.10
VM-Lnx Virtual KOM 1 GHz 1 GB VMware ESXi Ubuntu 11.10
VM-Win Virtual KOM 1 GHz 1 GB VMware ESXi Windows 7 SP 1
PM-Lnx Physical KOM 2.66 GHz 4 GB – Ubuntu 11.10
PM-Win Physical KOM 2.66 GHz 4 GB – Windows 7 SP 1
ment inaccuracies from automatic up- or downscaling
of the VMs throughout the experimental process.
2.3 Measurement Procedure
In order to minimize potential measurement inaccura-
cies due to background services (such as file indexing,
virus scanning, etc.), we booted the operating systems
on our measurement infrastructure into the shell-based
recovery modes. Subsequently, we started our mea-
surement tool from the command line.
On each configuration, we conducted
25
batches
with
100
method calls each (i. e.,
b = 25
,
c = 100
).
The set of applicable arguments was specified as
A =
{1,...,2
7
}
, i. e.,
a
max
= 7
. Thus, we obtained a total
sample of
20,000
runtime measurement observations
per machine configuration with subsamples of
2,500
observations per argument and machine configuration.
Following the measurement process, the subsam-
ples were normalized, i. e., each individual observation
was divided by the mean value of the subsample. Thus,
following normalization, the mean value
µ
of each sub-
sample corresponded to
1
. Through this procedure, we
account for the fact that – despite the machine speed
adaptation in the factorial method – the absolute mean
values of the subsamples slightly differ, which would
render them ill-comparable.
3 RESULTS AND DISCUSSION
Table 2 and Figure 1 depict the results of our experi-
ments with respect to the common metric of standard
deviation. Due to the use of a deterministic method
with static runtime in our measurement tool, identical
computation times would (ideally) be expected for the
same argument, corresponding to a standard deviation
of
0
. Accordingly, higher standard deviation values
indicate measurement inaccuracies.
4
4
More detailed measurement results are available via
our website at http://www.kom.tu-darmstadt.de/
∼
lampeu/
closer-2012/.
Table 3 additionally provides the result of a pair-
wise Friedman test (Marques de S
´
a, 2007) between
all five machine configurations. The Friedman test is
a non-parametric, rank-based test, which essentially
checks whether one sample consistently features obser-
vations with higher (or lower) value than one or more
other samples. In our case, the eight observed standard
deviation values for each machine configuration, as
provided in Table 2, serve as samples. That is, for each
pair of machine configurations, we test whether one of
the configurations consistently achieves a lower stan-
dard deviation across all arguments than the other, i. e.,
whether it achieves a higher measurement accuracy.
As is evident from the results, specifically the met-
ric of standard deviation, the VMs exhibit a substan-
tially higher fluctuation in the measured computation
time. On the VMs and for the smallest argument (i. e.,
1
, which results in an absolute computation time of
roughly
10
ms), the standard deviation of the subsam-
ples is in the same magnitude order as the normalized
mean, i. e.,
1
or 100%. For the physical machines, the
value is substantially lower and lies in the magnitude
order of 0.01, or 1% of the normalized mean.
With increasing argument value, and thus, abso-
lute computation time, the effect diminishes. However,
even for the largest argument in our experiments (i. e.,
128
, corresponding to an absolute computation time
above 1 s), there is a clear difference observable be-
tween the virtual and physical machines (cf. Table 2
and Figure 1).
In general, the observed standard deviation, which
is a relative measure due to the normalization step,
decreases with increasing absolute computation time.
This indicates that the absolute standard deviation is
comparatively stable and a perfect measurement accu-
racy cannot be achieved, for instance, due to general
deficiencies in the operating system’s or Java’s time-
keeping.
It is interesting to note that the VM from Ama-
zon’s EC2 exhibits the highest inaccuracy, trailed by
the VMs operated at our institute. Thus, it can be
reasoned that the measurement accuracy of a virtual
infrastructure can be improved through appropriate
configuration steps, as it has been explained in Sec-
CLOSER2012-2ndInternationalConferenceonCloudComputingandServicesScience
66
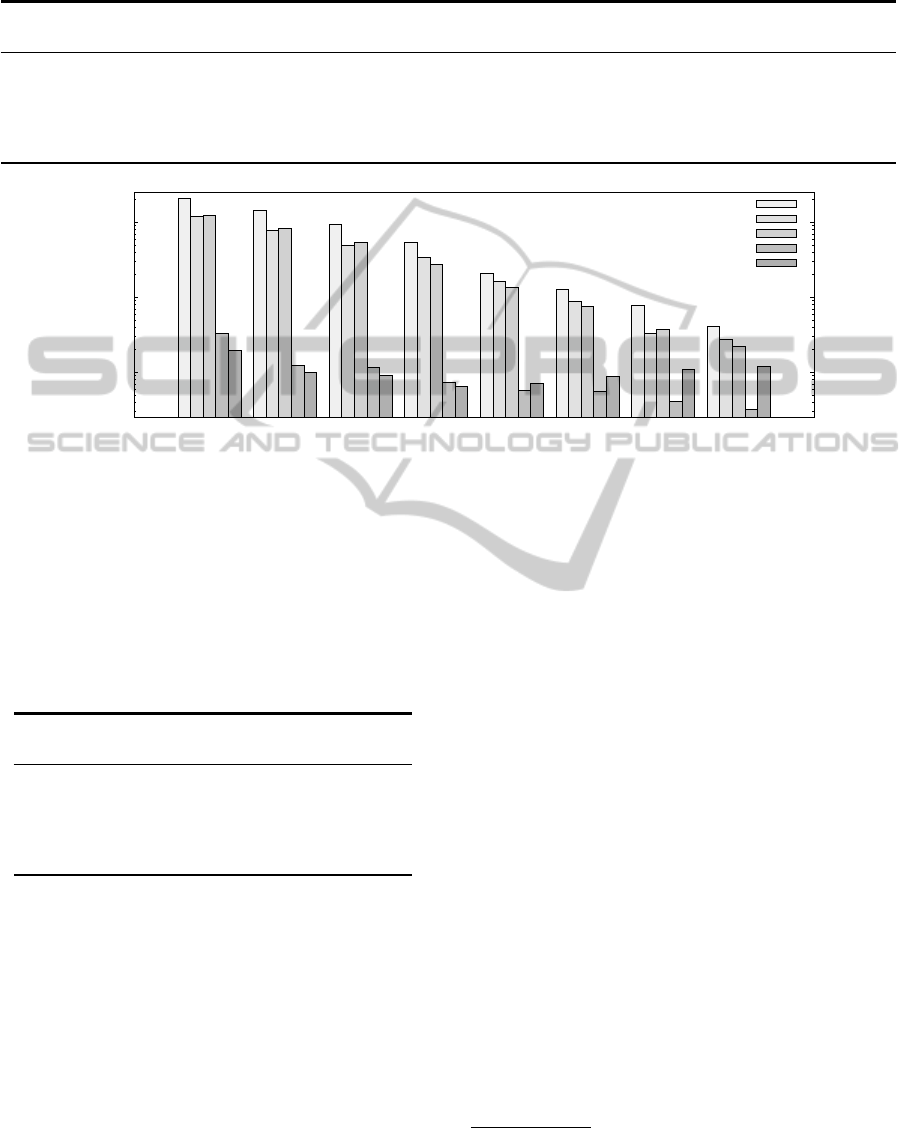
Table 2: Observed standard deviation of the measured computation times (per machine configuration and argument, based on a
normalized mean of µ = 1 per subsample).
Machine Config.
/ Argument
1 2 4 8 16 32 64 128
AWS-Lnx 2.0680 1.4397 0.9286 0.5319 0.2070 0.1287 0.0774 0.0410
VM-Lnx 1.1850 0.7851 0.4863 0.3359 0.1650 0.0887 0.0334 0.0274
VM-Win 1.2360 0.8276 0.5355 0.2707 0.1372 0.0761 0.0374 0.0220
PM-Lnx 0.0332 0.0124 0.0115 0.0074 0.0058 0.0056 0.0041 0.0032
PM-Win 0.0197 0.0098 0.0090 0.0064 0.0071 0.0087 0.0108 0.0119
0.01
0.1
1
1 (10) 2 (20) 4 (40) 8 (80) 16 (160) 32 (320) 64 (640) 128 (1280)
Standard deviation
Argument (avg. absolute computation time in ms)
AWS-Lnx
VM-Lnx
VM-Win
PM-Lnx
PM-Win
Figure 1: Observed standard deviation of the measured computation times (per machine configuration and argument, based on
a normalized mean of µ = 1 per subsample). Please note the logarithmic scaling of the ordinate.
Table 3: Results of pairwise Friedman tests (Marques de S
´
a,
2007) between the machine configurations. The given values
correspond to the significance probability of the respective
Friedman test statistic. Values below a specified level
α
(commonly
0.05
or
0.10
) indicate that the hypotheses of
equal measurement accuracy may be rejected.
Machine
Config.
AWS-
Lnx
VM-
Lnx
VM-
Win
PM-
Lnx
PM-
Win
AWS-Lnx
1.000 0.000 0.000 0.000 0.000
VM-Lnx
0.000 1.000 0.726 0.000 0.000
VM-Win
0.000 0.726 1.000 0.000 0.000
PM-Lnx
0.000 0.000 0.000 1.000 0.726
PM-Win
0.000 0.000 0.000 0.726 1.000
tion 2.2. However, in the case of a public cloud offer,
these options are commonly not available to the end
user.
With respect to the two different operating sys-
tems in our experiment, the results of the Friedman
test (cf. Table 3) indicate that neither Windows nor
Linux is able to consistently achieve a lower standard
deviation and thus, higher measurement accuracy (as-
suming a common confidence level of 90% or greater,
i. e.,
α ≤ 0.10
). In accordance, it can be observed in
Figure 1 that the standard deviation values on the same
infrastructure are largely similar for both operating
systems.
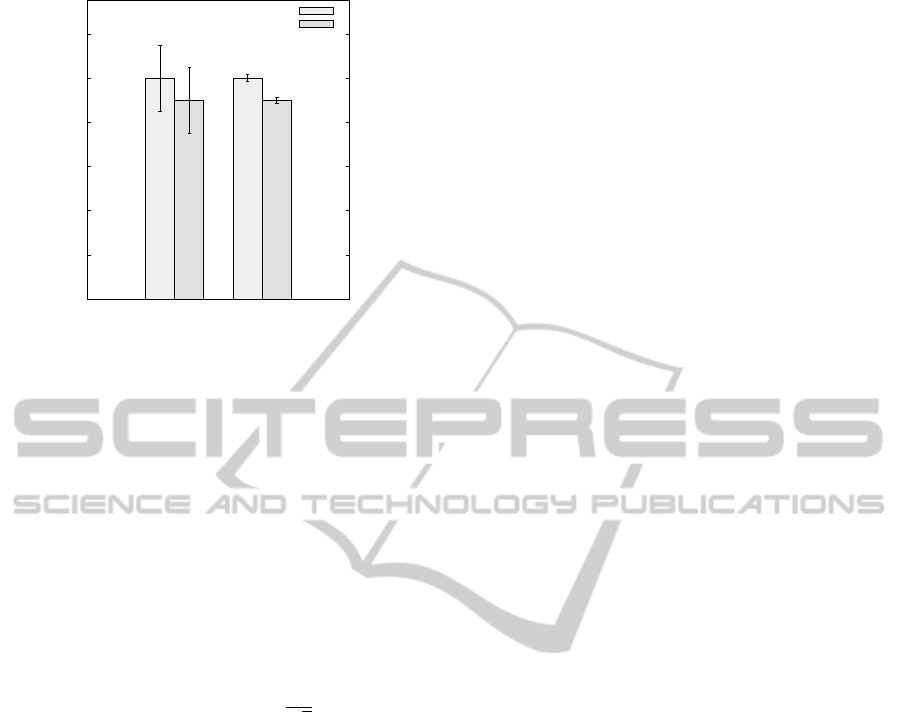
4 PRACTICAL IMPLICATIONS
Now, what are the practical implications of our find-
ings? Consider, for instance, Figure 2, which depicts a
plot that is commonly found in computer science re-
search papers. Two algorithms, namely A and B, have
been experimentally evaluated with respect to their
computation time, based on a number of test cases.
5
A common (null) hypothesis would state that “al-
gorithm A and B do not differ with respect to their
computation time”. Such hypothesis can, for instance,
be validated through a visual test. In this test, a re-
searcher checks whether the confidence intervals of
the observed mean runtimes for the two algorithms
overlap. In many cases, such a relatively simple test is
sufficient to examine a statistically significant relation-
ship between two samples (Jain, 1991).
On the left side of the figure, the measurements
have been taken with comparatively low accuracy. Ac-
cordingly, the error bars, which indicate the confidence
interval of the mean runtime, become very wide. Thus,
based on aforementioned visual test, a researcher could
not establish a significant difference between the two
5
In accordance with our statement in Section 1, the fol-
lowing arguments also apply to the more general case of two
or more systems.
THEVIRTUALMARGINOFERROR-OntheLimitsofVirtualMachinesinScientificResearch
67
0
0.2
0.4
0.6
0.8
1
1.2
“Low accuracy” “High accuracy”
Measured computation time (e. g., ms)
Algorithm A
Algorithm B
Figure 2: Example of a common plot in computer science
research for the comparison of two algorithms, based on a
visual test (Jain, 1991).
algorithms. In contrast, on the right side, the mea-
surements have been taken with comparatively high
accuracy. Thus, the error bars are substantially smaller.
Accordingly, the statistically significant difference in
computation time is immediately evident.
The effect occurs because the width of the confi-
dence intervals is linearly related to the standard devi-
ation. Specifically, if α indicates the confidence level,
σ
the standard deviation,
n
the sample size, and
z
1−α/2
the
(1 −α/2)
-quantile of a unit normal variate, the
confidence interval is deduced as follows (Jain, 1991):
CI
100(1−α)%
= ¯x ±z
1−α/2
σ
√
n
(1)
Above formula does not only underline the prac-
tical significance of the metric of standard deviation.
It also points to a practical countermeasure to address
insufficient measurement accuracy, namely, increas-
ing the number of samples. Unfortunately, this coun-
termeasure may not always be an option: First, the
number of available test cases and thus, obtainable
observations, may be restricted in a specific scenario.
Second, each additional experiment and resulting ob-
servation may incur increased cost. This is especially
true when VMs from a public cloud provider are em-
ployed.
Lastly, it is important to stress again that the prob-
lem of low measurement accuracy does not only con-
cern the visual test, which has been provided as an
illustrative example here. In fact, it concerns all tests
are that based on the metric of standard deviation, such
as the common
t
-test (Jain, 1991). Yet, the simple ex-
ample illustrates that the measurement inaccuracies
may, in fact, make it much harder – or, in some cases,
even impossible – for researchers to draw useful and
valid conclusions from their experiments.
5 RELATED WORK
To the best of our knowledge, we are the first to em-
pirically examine and compare the accuracy of time
measurements across various virtual and physical ma-
chine configurations. However, the potential deficits
of virtualization with respect to timekeeping have been
discussed in the literature before.
Specifically, the theoretical underpinning for this
work has been provided by a white paper of VMware, a
major supplier of virtualization technologies (VMware,
Inc., 2011). In this guide, the company initially ex-
plains how timekeeping functionalities are commonly
implemented in physical hardware today. In addition,
the timekeeping methodologies in different operating
systems – including Microsoft Windows and Linux
– are described. Based on this fundamental informa-
tion, the white paper outlines the specific problems of
timekeeping in VMs and explains potential counter-
measures. However, these countermeasures appear to
be targeted for clock synchronization in general, rather
than the specific problem of time measurements in the
sub-second range, which is of particular interest for the
evaluation of scientific results and has been examined
in our work.
An empirical study of clock skew behavior on dif-
ferent devices, including VMs, has been presented by
Sharma et al. (Sharma et al., 2011). The authors ex-
ploit the timestamps in ICMP and TCP data packets
to quantify the relative clock deviation over different
time periods, lasting from minutes to days. Interest-
ingly, Sharma et al. do not find significant differences
in clock skew behavior between the examined VMs
and the underlying physical machines that host them.
However, their work is not explicitly targeted at the
accuracy of runtime measurements, specifically not in
the sub-second range, but rather at the issue of correct
timekeeping in terms of clock synchronization.
The effects of virtualization on timekeeping within
the Linux operating systems are extensively discussed
by Chen et al. (Chen et al., 2010). The authors propose
a methodology to improve CPU-based time accounting
within the Xen virtualization platform, called XenHV-
MAct. The benefits of their solution are documented
using empirical evaluations. In contrast to our work,
Chen et al. do not provide an exact quantification of
measurement accuracies depending on absolute com-
putation times.
Lastly, our work should not be confused with the
performance evaluation of VMs. Domingues et al.,
for instance, have conducted comparative studies of
different virtualization technologies (Domingues et al.,
2009). In their studies, a focus lies on the overhead
that is introduced through virtualization, compared to
CLOSER2012-2ndInternationalConferenceonCloudComputingandServicesScience
68

a physical system. Interestingly, the authors explicitly
point out the time measurement deficiencies on VMs
and reportedly counteract them through the use of an
external reference. However, Domingues et al. do not
provide a quantification of these effects.
In summary, the issue of timekeeping in VMs
has already received notable attention by the scien-
tific community. However, no work has specifically
aimed to quantify measurement inaccuracies in the sub-
second range and outline the practical implications of
these deficiencies, e. g., the VM-based evaluation of
algorithms or heuristics.
6 SUMMARY AND OUTLOOK
In the work at hand, we argued that literature and prac-
tical experience points to deficiencies of VMs with
respect to accurate time measurements. To experimen-
tally evaluate these potential drawbacks, we imple-
mented a Java-based measurement tool, which permits
to repeatedly measure the computation time of a deter-
ministic, parameterizable method, namely the factorial
function.
Using this tool, we conducted a series of experi-
ments on both physical and virtual infrastructures, in-
cluding a VM leased from the cloud. Our experiments
indicate that VMs feature much higher measurement
inaccuracies, specifically in the case of sub-second
absolute computation times, compared to physical ma-
chines.
Based on these findings, we conclude that physical
machines should be preferred for exact time measure-
ments, specifically, if absolute computation times in
the sub-second range are expected and valid scientific
results are to be drawn from those measurements.
In our future work, we plan to include additional
machine configurations in our experiments, specifi-
cally, a wider range of public cloud computing offers
and operating systems. We will further examine how
the undesired side-effects of measurement inaccura-
cies on virtual infrastructure can be pragmatically ad-
dressed by researchers.
ACKNOWLEDGEMENTS
This work has been sponsored in part by the E-
Finance Lab e.V., Frankfurt am Main, Germany
(www.efinancelab.de). We would like to thank Sil-
via R
¨
odelsperger and Johannes Schmitt for their help
with the preparation of the experiments.
REFERENCES
Armbrust, M., Fox, A., Griffith, R., Joseph, A., Katz, R.,
Konwinski, A., Lee, G., Patterson, D., Rabkin, A.,
Stoica, I., et al. (2010). A View of Cloud Computing.
Communications of the ACM, 53(4):50–58.
Briscoe, G. and Marinos, A. (2009). Digital Ecosystems in
the Clouds: Towards Community Cloud Computing. In
3rd Int. Conf. on Digital Ecosystems and Technologies,
pages 103–108.
Buyya, R., Yeo, C., Venugopal, S., Broberg, J., and Brandic,
I. (2009). Cloud Computing and Emerging IT Plat-
forms: Vision, Hype, and Reality for Delivering Com-
puting as the 5th Utility. Future Generation Computer
Systems, 25(6):599–616.
Chen, H., Jin, H., and Hu, K. (2010). XenHVMAcct: Ac-
curate CPU Time Accounting for Hardware-Assisted
Virtual Machine. In 11th Int. Conf. on Parallel and
Distributed Computing, Applications and Technologies,
pages 191–198.
Domingues, P., Araujo, F., and Silva, L. (2009). Evaluating
the Performance and Intrusiveness of Virtual Machines
for Desktop Grid Computing. In 8th IEEE Int. Symp.
on Parallel & Distributed Processing, pages 1–8.
Jain, R. K. (1991). The Art of Computer Systems Perfor-
mance Analysis: Techniques for Experimental Design,
Measurement, Simulation, and Modeling. Wiley.
Kohlwey, E., Sussman, A., Trost, J., and Maurer, A. (2011).
Leveraging the Cloud for Big Data Biometrics: Meet-
ing the Performance Requirements of the Next Genera-
tion Biometric Systems. In 7th IEEE World Congress
on Services, pages 597–601.
Lampe, U. (2011). Optimizing the Distribution of Software
Services in Infrastructure Clouds. In 7th IEEE World
Congress on Services, Ph.D. Symposium, pages 69–72.
Manning, C. D., Raghavan, P., and Sch
¨
utze, H. (2008). In-
troduction to Information Retrieval. Cambridge Uni-
versity Press.
Marques de S
´
a, J. (2007). Applied Statistics Using SPSS,
STATISTICA, MATLAB and R. Springer.
Sharma, S., Saran, H., and Bansal, S. (2011). An Empirical
Study of Clock Skew Behavior in Modern Mobile and
Hand-Held Devices. In 3rd Int. Conf. on Communica-
tion Systems and Networks, pages 1–4.
Subramanian, V., Ma, H., Wang, L., Lee, E., and Chen, P.
(2011). Rapid 3D Seismic Source Inversion Using
Windows Azure and Amazon EC2. In 7th IEEE World
Congress on Services, pages 602–606.
VMware, Inc. (2011). Timekeeping in VMware Virtual
Machines. Available online at www.vmware.com/files/
pdf/Timekeeping-In-VirtualMachines.pdf, last access
on March 22, 2012.
THEVIRTUALMARGINOFERROR-OntheLimitsofVirtualMachinesinScientificResearch
69
