
A WCS-BASED APPROACH TO INTEGRATE SATELLITE
IMAGERY DATA IN WILDFIRE SIMULATION
António Esteves and António Pina
Departamento de Informática, Universidade do Minho, Braga, Portugal
Keywords:
OGC Standards, WCS, Satellite Datasets, MODIS Sensor, Wildfire Simulation.
Abstract:
This paper describes the integration of multi-dimensional data from satellite sensors in a Civil Protection
application that simulates fire spread. The approach uses standard Web Coverage Services from OGC to fetch
and process land cover and recently burned areas, available in the form of satellite imagery data previously
captured by the MODIS sensor, to automatically generate renovated fuel maps. The proposed architecture
is based on rasdaman, a domain-independent database management system (DBMS) that offers a suite of
WCS services on top of the DBMS. In the current work we extended rasdaman with facilities to: (i) insert
and retrieve multi-layer coverages from WCS, (ii) support new formats, such as HDF, adequate for satellite
imagery and multi-layer files, and (iii) support Coordinate Reference Systems. We also demonstrate that it
is feasible to use MODIS datasets to automatically compute valuable and regularly updated fuel maps, used
as input of fire spread simulations. The results also show that in spite of using inexpensive general and low
resolution (500m) MODIS maps, we obtained quite acceptable results when compared with the static ones,
which are tailored and higher resolution (80m).
1 INTRODUCTION
This work is part of the Portuguese CROSS-Fire
project aimed to develop a grid-based risk manage-
ment decision support system, for the Civil Protec-
tion (CP) authorities, using wildfires as the main case
study, and FireStation (Lopes et al., 2002) a simulator
to compute the fire spread over a complex topography.
The paper reports the work that has been carried
on to improve the quality of fire spread simulations
by automatically renewing the old static fuel maps
used as input, with fresh data obtained from satellite
sensors, as an alternative to a time and money con-
suming human update. The approach uses standard
Web Coverage Services (WCS) from Open Geospa-
tial Consortium (OGC) to get and process land cov-
ers and recently burned areas, available in the form of
satellite imagery data, to automatically generate ren-
ovated fuel maps.
To integrate information models, encodings, and
metadata we use: i) a central core of Web services,
implemented as a set of Web Processing Service
(WPS) algorithms, ii) the EGEE/EGI to provide raw
technological capability provision, iii) a Spatial Data
Infrastructure (SDI), to provide the access and man-
agement of remote geospatial data from remote sen-
sors/satellites or in-situ sensors, and iv) a GUI that
provides users with visualization facilities, and meta-
data and spatial data queries (Pina et al., 2011).
The overall software development take advantage
of available implementations of the standards pro-
posed by the OGC: (i) the OGC Web Services (OGC-
WS), (ii) the OGC Sensor Web Enablement (OGC-
SWE) services, and (iii) gvSIG, a full-featured Open
Source GIS desktop GUI.
The simulator requires both static and dynamic in-
put data. The static data comprises: i) the terrain di-
vided into cells, each one characterized by its altitude
and fuel type, ii) the wind conditions, and iii) the con-
trol parameters. The dynamic data, is provided by a
Remote Weather Station Sensor Observation Service
(SOS) client. Given the potential of the imagery data
that may be obtained from satellite sensors we eval-
uated the possibility of computing improved and up-
dated fuel maps based on: i) updated vegetation, ii)
newly burned areas, and iii) land cover type, by get-
ting and processing data from MODIS (USGS, 2008)
sensors aboard of Terra and Aqua satellites. To main-
tain the commitment to OGC standards we use the
WCS (Whiteside and Evans, 2008) and its Web Cov-
erage Processing Service (WCPS) (Baumann, 2009)
extension.
238
Esteves A. and Pina A..
A WCS-BASED APPROACH TO INTEGRATE SATELLITE IMAGERY DATA IN WILDFIRE SIMULATION.
DOI: 10.5220/0003898002380241
In Proceedings of the 8th International Conference on Web Information Systems and Technologies (WEBIST-2012), pages 238-241
ISBN: 978-989-8565-08-2
Copyright
c
2012 SCITEPRESS (Science and Technology Publications, Lda.)
Among the related work we should mention the
SAFORAH project, the work by Daniel Mandl at
NASA, Sentinel/Digital Asia, GEO Grid, and RGI-
project projects, and the tools developed by NASA to
process and deliver data from MODIS/Aster sensors:
the MODIS Rapid Response system and Fire Informa-
tion for Resource Management System.
2 OGC STANDARDS
The WCS standard specifies 3 operations: GetCapa-
bilities, DescribeCoverage, and GetCoverage. These
operations allow spatial, temporal and band subset-
ting, scaling, reprojection, and format encoding.
The WCS-Transactional (WCS-T) extension to
WCS 2.0 allows the insertion and updating of cov-
erages stored on a WCS server. WCS-T specifies an
additional Transaction operation.
The Web Coverage Processing Service (WCPS)
extension to WCS 2.0 defines a flexible interface for
the navigation, extraction, and ad-hoc analysis of
large, multi-dimensional raster coverages. WCPS is
abstract in that it does not anticipate any particular
protocol, and specifies an additional ProcessCover-
ages operation.
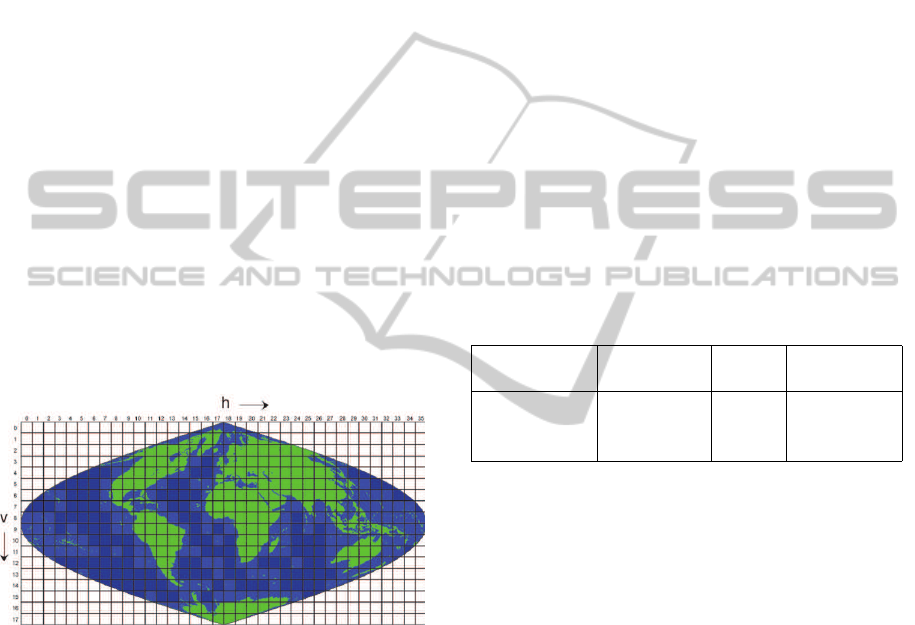
Figure 1: MODIS tiling scheme.
3 MODIS SENSOR
MODIS sensor is placed aboard of Terra and Aqua
satellites, both covering the entire surface of the
planet Earth. The planet is divided into 36X8
tiles, and the Portuguese continental land and islands
spread over 3 tiles: h16v05, h17v04 and h17v05.
The spatial resolution of MODIS data can be 250m,
500m or 1000m and classified in 3 categories: atmo-
spheric, land cover, and oceanographic data. NASA
provides this information at several levels, L0 up to
L4, where L0 is raw data and L4 are the most pro-
cessed products. MODIS L2 to L4 products are de-
fined on a global sinusoidal grid. The grid is divided
into fixed-area tiles of approximately 10x10 degrees
in size. Each tile is assigned a horizontal (h) and ver-
tical (v) coordinate ranging from 0 to 35 and 0 to 17,
respectively (figure 1) (Boschetti et al., 2009).
Produced from daily surface reflectance,
MCD45A1 is a monthly L3 500m product that
approximates the date of burning, and maps the
spatial extent of recent fires. MCD12Q1 L3 product
describes land cover properties derived from one
year of observations. It is delivered yearly at 500m
resolution and incorporates 5 different land cover
classification schemes: IGBP, UMD, LAI/FPAR,
NPP, and PFT. Using MODIS reflectances, vegetation
indices are computed daily. Difference Vegetation
Index (NDVI) and Enhanced Vegetation Index (EVI)
are among these indices. MOD13Q1 is a L3 grid
product delivered every 16 days at 500m spatial
resolution. In the present work, we are interested in
the level-3 (L3) land products described in table 1
and selected the IGBP scheme since it is the most
detailed and comprehends 17 classes of land cover
type.
Table 1: MODIS land products.
Product Product Resol. Temporal
Info. Code (m) Granularity
Burned Area MCD45A1 500 Monthly
Veg. Indices MOD13Q1 250 16 Day
Land Cover MCD12Q1 500 Yearly
4 ARCHITECTURE
The architecture that integrates the data provided
by MODIS on the fire spread simulator is sup-
ported by the following technologies: the Hierar-
chical Data Format (HDF) used by NASA to pub-
lish MODIS data, the Java HDF Object Package
that provides an object-oriented interface to HDF
data objects (The_HDF_Group, 2010), and ras-
daman ((rasdaman GmbH), 2011), which is a domain-
independent database management system (DBMS)
with a WCS suite of services built on top of it. From
bottom to top, the architecture (figure 2) includes:
• The postgreSQL relational DBMS that manages
and stores the coverages and their metadata in two
separated databases;
• The core modules of rasdaman that mediate the
interaction between the WCS services (petascope)
and the DBMS, and the format converters;
• petascope implements a OGC-compliant WCS
2.0 suite of services: WCS, WCPS, and WCS-T;
AWCS-BASEDAPPROACHTOINTEGRATESATELLITEIMAGERYDATAINWILDFIRESIMULATION
239

Firestation
getCoverage ()
Format Converters
WCS-T client WCS client
WCS-T WCPS
WCS
Petascope
WCS Suite
(rasdaman)
TIFF
Converter
JPG
Converter
ArcGrid
Converter
rasdaman
...
Other Modules
(rascontrol, rasmgr, rasql processor, …)
rasql
Relational DataBase
Managment System
(postgreSQL)
sql
sql
Coverage
WCS Suite
of Clients
Download HDF files
HDF processing algorithms
Generate XML files to insert data in WCS
GDAL
WCPS client
Local HDFs
Coverages
Coverages
Metadata
Satellite Data Manager
MODIS
FTP
Figure 2: Proposed architecture, based on rasdaman, to ex-
tend the fire spread simulator with satellite data.
• The WCS suite of clients implements the clients
that dialogue with petascope WCS services, gen-
erating the adequate XML requests and parsing
the XML answers from the WCS servers;
• The Satellite data manager provides: i) a mod-
ule to download HDF files from the MODIS site
to a local directory; ii) a collection of algorithms
to process the HDF files; iii) a module to gener-
ate the XML files necessary to insert datasets and
their metadata in WCS.
The developed HDF processing algorithms permit
to: (1) generate datasets for tiles missing on MODIS
site (full ocean tiles), (2) extract a dataset from an
HDF, (3) merge datasets when the requested region
spans more than one tile, (4) reproject a dataset in
order to combine datasets that use different projec-
tions, (5) extract a subset from a dataset, (6) modify
the resolution of a dataset for combining/comparing
datasets with different resolutions, (7) modify the
range of a dataset, (8) compare datasets, and (9) com-
bine datasets in a fuel map. Comparing datasets is
needed, for example, to validate if a dynamic land
cover scheme may replace a static scheme (figure 3).
The algorithm that combines a land cover dataset with
one or more burned area datasets, in order to update
the yearly produced land cover with the monthly pro-
duced burned areas, is summarized in figure 4.
5 RESULTS
Initially, we compared the static and the MODIS-
based land cover classification schemes, by previ-
ously replacing each class of the MODIS map by
Local
DB
multi-dataset files (HDF)
Extract
Dataset
single-dataset
files
(HDF)
Merge
Datasets
merged dataset
(HDF & ArcGrid)
Reproject
Dataset
reprojected
dataset
(HDF & ArcGrid)
subset
(HDF & ArcGrid)
MODIS dynamic
landcover
(HDF & ArcGrid)
ADAI static
landcover
(ArcGrid)
landcover
difference
(HDF & ArcGrid)
1 2
3
Extract
Subset
4
Modify
Resolution
Modify
Landcover
Scheme
6
Compare
Landcovers
7
subset with
modified resolution
(HDF & ArcGrid)
Modify
Resolution
5
Figure 3: Processing flow to compare static (ADAI) land
cover scheme with MODIS-based scheme.
1
landcover
2
Combine
landcover
and burned
areas
1
burned
areas
2
6
dynamic
fuel map
Local
DB
3
3
4
4
5
5
Figure 4: Processing flow to compute a MODIS-based dy-
namic fuel map.
its static (ADAI
1
) equivalent, to be able to calculate
the difference between the maps. Based on the re-
sults from this comparison, a mapping from static to
MODIS land cover classification scheme was elabo-
rated (Esteves, 2011). To quantify the quality of the
mapping MODIS 7→ static land cover schemes, we
measured the difference among the static classes, con-
sidering 6 fuel characteristics of each class: fuel load-
ing dead after 1 hour/10 hours/100 hours, fuel load-
ing live, heat content, and moisture content of extinc-
tion (Cruz, 2005). Subsequently, we estimated the
maximum value of the difference for each character-
istic (1 to 6), among all land cover classes (0 to 16).
Finally, the global difference between two static land
cover classes was computed. Figure 5 displays the
results of comparing MODIS-based with static land
cover map. Black colour pixels represent a perfect
match (0% difference) between maps and a lighter
1
ADAI - Associação para o Desenvolvimento da Aerod-
inâmica Industrial, Coimbra, Portugal, www.adai.pt.
WEBIST2012-8thInternationalConferenceonWebInformationSystemsandTechnologies
240

Figure 5: Difference between the MODIS-based and static
land cover maps for Portuguese land.
colour means a greater difference. The mean differ-
ence is 14% and the average difference is 2%.
6 CONCLUSIONS
rasdaman is a running project still lacking some fa-
cilities. In the course of this work, we made sev-
eral extensions, including: i) insertion and retrieving
of multi-layer coverages from WCS, ii) support for
formats, such as HDF, for satellite imagery and for
multi-layer files, and iii) support to Coordinate Ref-
erence Systems. It is well known that MODIS reso-
lution is moderate. However, our results prove that
it may be used to improve the quality of static fuel
maps, by combining fresh burned areas information
with the land cover datasets, and to feed Firestation
with the generated valuable fuel. These maps may
be further improved with vegetation data produced
more frequently. In the future, we plan to evaluate the
architecture with higher resolution sensors/satellites,
such as ASTER/Terra, ETM+/Landsat-7, SAR/ESR-
2 and ASAR/Envisat, PROBA, SPOT-4/5, AVNIR-
2/ALOS, or DEIMOS-1. We also plan to contribute,
with others academics, industrial institutions and Por-
tuguese Civil Protection, to create a national platform
for fast and reliable wildfire management, based in
a distributed computing infrastructure built on top of
the EGI/Grid middleware.
REFERENCES
Baumann, P. (2009). The OGC Web Coverage Processing
Service (WCPS) Standard. Geoinformatica.
Boschetti, L., Roy, D., and Hoffmann, A. (2009). MODIS
Collection 5 Burned Area Product - MCD45, User’s
Guide version 2.0.
Cruz, M. G. (2005). Guia fotográfico para identificação de
combustíveis florestais - Região Centro de Portugal.
Centro de Estudos sobre Incêndios Florestais - ADAI,
Coimbra.
Esteves, A. (2011). A wcs-based integration of multidimen-
sional data on firestation grid application. Technical
report, Departamento de Informática, Universidade
do Minho, Portugal. https://pop.cp.di.uminho.pt/
crossfire/wp-content/uploads/ 2011/ 11/PaperSatellite
Info_a4.pdf.
Lopes, A., Cruz, M., and Viegas, D. (2002). FireStation -
an integrated software system for the numerical simu-
lation of fire spread on complex topography. Environ-
mental Modelling and Software, (17(3):269285).
Pina, A., Esteves, A., Puga, J., and Oliveira, V. (2011). A
Geographical Information System for wild fire man-
agement. Proceedings of the 5th Iberian Grid Infras-
tructure Conference (Ibergrid’2011), pages 144–155.
(rasdaman GmbH), P. B. (2011). The Rasdaman
Project Documentation. http://kahlua.eecs.jacobs-
university.de/trac/ rasdaman.
The_HDF_Group (2010). The HDF Object Package. http://
www.hdfgroup.org/hdf-java-html/hdf -object.
Whiteside, A. and Evans, J. (2008). Web Coverage Ser-
vice (WCS) Implementation Standard, Open Geospa-
tial Consortium Document 07-067r5.
AWCS-BASEDAPPROACHTOINTEGRATESATELLITEIMAGERYDATAINWILDFIRESIMULATION
241
