
MULTI-LEVEL GROUPING GENETIC ALGORITHM
FOR LOW CARBON VIRTUAL PRIVATE CLOUDS
Fereydoun Farrahi Moghaddam, Reza Farrahi Moghaddam and Mohamed Cheriet
Synchromedia Laboratory,
´
Ecole de Technologie Sup
´
erieure, Montreal, QC, Canada
Keywords:
Cloud Computing, Virtual Private Cloud, Green IT, Carbon Footprint, Genetic Algorithm, Multi-level
Grouping.
Abstract:
Optimization problem of physical servers consolidation is very important for energy efficiency and cost reduc-
tion of data centers. For this type of problems, which can be considered as bin-packing problems, traditional
heuristic algorithms such as Genetic Algorithm (GA) are not suitable. Therefore, other heuristic algorithms are
proposed instead, such as Grouping Genetic Algorithm (GGA), which are able to preserve the group features
of the problem. Although GGA have achieved good results on server consolidation in a given data center, they
are weak in optimization of a network of data centers. In this paper, a new grouping genetic algorithm is in-
troduced which is called Multi-Level Grouping Genetic Algorithm (MLGGA), and is designed for multi-level
bin packing problems such as optimization of a network of data centers for carbon footprint reduction, energy
efficiency, and operation cost reduction. The new MLGGA algorithm is tested on a real world problem in a
simulation platform, and its results are compared with the GGA results. The comparison shows a significant
increase in the performance achieved by the proposed MLGGA algorithm.
1 INTRODUCTION
Global warming and its impacts on our life is one of
the biggest twenty-first century’s challenges for hu-
man societies. There are different reasons for global
warming, but one of main reasons is known to be ex-
cessive Green House Gases (GHG) emissions. Nowa-
days, the share of ICT sector in the total GHG emis-
sions is not greater than 2% (McKinsey, 2007). How-
ever, according to rapid growth of ICT sector within
the ICT enabling effect (Webb, 2008), in near future,
GHG emission reduction in ICT sector will be very
important.
After introduction of virtualization technology,
physical server consolidation plays an important role
in energy efficiency and GHG emission reduction in
data centers (Beloglazov et al., 2010)(Gmach et al.,
2009)(Liu et al., 2009). In this type of problems, the
objective is fulfilled by minimizing the energy con-
sumption, carbon footprint, cost, or a mixture of them.
Considering the locations of VMs as variables of the
problem and one of the aforementioned cost func-
tions, the consolidation problem can be written as a
bin-packing optimization problem. Bin packing algo-
rithms such as improved First Fit Decreasing (FFD)
and Least Loaded (LL) (Ajiro and Tanaka, 2007) as
well as heuristic optimization algorithms can be used
in order to solve this type of problems.
Because of high complexity of this kind of op-
timization problems, heuristic algorithms are good
candidates for them. But traditional general heuris-
tic algorithms such as GA are not able to provide a
good solution for the special case of server consoli-
dation (Xu and Fortes, 2010). Particular genetic op-
erators which take advantage of the group-oriented
structure of cost function, could lead the genetic al-
gorithm to better results compare to the non-grouping
heuristic algorithms which are not aware of that struc-
ture. For example, the GGA has been used to achieve
more efficient results in various works (Xu and Fortes,
2010)(Agrawal et al., 2009)(Wilcox et al., 2011).
These new methods are proven to have better results
than traditional methods and global heuristic algo-
rithms.
Ability to migrate virtual machines in a lively
manner from one data center to another data
center without service interruption (Clark et al.,
2005)(Van der Merwe et al., 2010)(Wood et al.,
2010)(Wood et al., 2009)(Farrahi Moghaddam and
Cheriet, 2010), opens the door to more complex archi-
tectures and behaviors of connected data centers and
brings higher opportunity for GHG, and mainly car-
315
Farrahi Moghaddam F., Farrahi Moghaddam R. and Cheriet M..
MULTI-LEVEL GROUPING GENETIC ALGORITHM FOR LOW CARBON VIRTUAL PRIVATE CLOUDS.
DOI: 10.5220/0003903303150324
In Proceedings of the 2nd International Conference on Cloud Computing and Services Science (CLOSER-2012), pages 315-324
ISBN: 978-989-8565-05-1
Copyright
c
2012 SCITEPRESS (Science and Technology Publications, Lda.)

bon footprint reduction (Farrahi Moghaddam et al.,
2011). Higher complexity of new designs requires
better and more efficient optimization algorithm in or-
der to reduce the GHG emissions as much as possible
in real-time in response to the unpredicted variations
in the workload and energy sources. In these net-
works, not only server consolidation should be con-
sidered, but also for each VM the best data center
should be chosen while meeting all the constrains.
In this type of complex problems, even algorithms
such as the GGA, are not able to discover all the re-
lations between VMs, servers and data centers to lead
to the best optimal solution. As a bin-packing algo-
rithm, GGA is able to benefit from consolidation of
VMs on servers, while it cannot discover the possible
benefits of data center consolidation. Therefore, even
a more complex heuristic algorithm is needed in order
to discover these relations and behaviors.
In this paper, a new genetic algorithm is proposed
as multi-level grouping genetic algorithm (MLGGA),
and we argue that this algorithm is useful for those
types of problems which deal with different levels of
bin packing. This new algorithm will consider not
only the relation of individuals as groups, it also con-
siders the relation of groups of groups in order to
achieve the best possible solution for the optimization
problem. As a use case in this work, a network of data
centers is optimized for carbon footprint reduction. it
is worth noting that the concept of the MLGGA could
be used in any optimization problem which deals with
groups of groups in different levels and their relations.
The paper is organized as follows. In the first
section, different works on using heuristic algorithms
for server consolidation, energy efficiency and carbon
footprint reduction are reviewed. In the next section,
the principle of the proposed algorithm is explained.
In the next section, a case study is planned for com-
parison of the proposed algorithm with GGA. Finally,
in the last section, the conclusion and some prospects
for future works are discussed.
2 RELATED WORKS
2.1 Grouping Genetic Algorithm
In (Falkenauer and Delchambre, 1992), Falkenauer
and Delchambre proposed a new version of genetic al-
gorithm known as grouping genetic algorithm. They
argue that normal genetic crossover and mutation op-
erators are not able to preserve the group features of
the parent chromosomes. In the straightforward en-
coding scheme, each item (for example, a VM) is rep-
resented by a gene in the chromosome, and its label is
its group (for example, a server) which that item be-
longs to. For example, the chromosome ADEBFFBC
encode a solution for 8 VMs where the first VM is
on server A, the second VM is on server D, and so
on. Basically, when there are two parents with good
groups defined in their chromosomes, there is no way
for normal genetic crossover operator to create an
offspring in which those good groups are preserved.
A part of a child chromosome comes from one par-
ent, and the rest comes from the other parent, well-
defined groups in both parents will break in parts, and
the probability of having an offspring with stronger
groups is very low. Therefore, they proposed a new
crossover and mutation operators in their new algo-
rithm, which perform on groups instead of individual
genes.
In their crossover operator, the groups presented
in the chromosomes are lined up (keeping one gene
per group), and the crossover will happen on these
two group representations of the parents. For ex-
ample, for the chromosome ADEBFFBC, the group
lineup will be ADEBFC. It is worth noting that, in
the group representation the chromosomes could be
of variable length. Two crossover points will be se-
lected in each parent group-lineup randomly. And,
the groups in middle part of the second parent group-
lineup will be inserted in first parent group-lineup at
the first crossover point. For example, the group-
lineup of the parents are as follows:
P1 : ADE|BF|C (ADEBFFBC)
P2 : bd|ca| (bbdcabba)
where the groups with same alphabetic character but
with different cases (upper and lower cases) are same
but represent that group in first and second parent, and
crossover points are marked as |. Also, the straight-
forward encoding of the chromosome is provided in
parentheses.
After insertion, the offspring group lineup of the
offspring will look like (ADEcaBFC). Because the
groups “c” and “a” are inserted from the second par-
ent, their matched groups in first parent “C” and “A”,
are no longer valid and these two groups and all their
assignments to individual genes will be removed from
the offspring; remaining the offspring group lineup as
(DEcaBF). For our example, the straightforward en-
coding of the offspring will be: (?DEcaFBa). ”?”
symbol shows that the first individual gene has no
group assigned to it any more because group A is re-
moved from the chromosome. In a same way, there
are some individuals which are in groups “c” and “a”
in second parent while they are in other groups in
first parent. The group of these individuals will be
replaced with inserting groups from second chromo-
some. The groups of replaced individuals need to
CLOSER2012-2ndInternationalConferenceonCloudComputingandServicesScience
316

be removed with all assignment to individual genes
which are groups “B” and “F” in the first parent. For
our example, the straightforward encoding of the off-
spring will be: (?DEca??a). Now, there are some in-
dividuals which their group assignments are removed
from chromosome in previous actions which needs
to be reinserted in the offspring chromosome. First
Fit Descending algorithm (Garey and Johnson, 1979)
is used in order to reinsert the removed individuals
into the chromosome. The priority is with the groups
which are almost full.
In mutation operator of grouping genetic algo-
rithm, the lineup of groups will be created in a similar
way of the crossover operation. Then, some groups
will be chosen by random and those groups with their
containing individuals will be removed from the chro-
mosome. Then, there are some individuals, which
have been removed in previous action, and are needed
to be reinserted into the chromosome. A similar ac-
tion as that of the crossover operator will be taken
here in order to reinsert the removed individuals into
the chromosome.
2.2 GGA in Server Consolidation
Xu et al. used Grouping Genetic Algorithm (GGA)
in (Xu and Fortes, 2010) in order to achieve multi-
objective goals in placement of virtual machines in
virtualized data center environments. They claimed
that normal GGA crossover operator is not efficient
and they modified it to achieve better results. They
proposed a ranking-crossover instead, and claimed
that new crossover is able to inherit good features
from parents more efficiently. They evaluated all the
individuals based on three evaluation functions which
they used to represent their three optimization objec-
tives. These three objectives were resource usage ef-
ficiency, power consumption efficiency, and thermal
efficiency. They represented some evaluation func-
tions for each of these objectives. The evaluation re-
sults were some numbers in the range of [0,1]. Instead
of random selection of crossover points, the selected
groups for insertion to the first chromosome are most
likely selected from groups with higher rank in rank-
ing evaluation of three objectives. They claimed that
this way, the high quality groups will most probably
remain intact and optimizer will reach to better so-
lutions faster. They also combined GGA with fuzzy
concepts in order to achieve the best solution for their
several objectives problem.
Shubham Agrawal et al. used the GGA algorithm
for a server consolidation problem in (Agrawal et al.,
2009). They modeled the server consolidation prob-
lem as a vector packing problem with conflicts. In
their mathematical model, they tried to differentiate
between efficiency of bin packing and number of bins
which are packed. Their model was designed to prefer
the bin-packing efficiency over bin number optimiza-
tion. They used the original version of the GGA in
order to solve the optimization problem.
In another work, David Wilcox et al. introduced
another type of GGA algorithm known as Reorder-
ing Grouping Genetic Algorithm (RGGA) (Wilcox
et al., 2011). They describe the multi-capacity bin-
packing problem in data center server consolidation
as bins (servers) with multiple capacities (CPU, mem-
ory, network, storage, and etc.) and VMs with mul-
tiple weights. In their proposed grouping genetic al-
gorithm, each individual has several representations,
and they claim these multiple representation will lead
to better solution in more efficient time frame. Parent
chromosomes are chosen with a higher probability for
more fit individuals. In their approach, they combined
all the bins from both parent chromosomes and sort
them by fitness. The fuller a bin is, it is on top of
the list, and less full bins are at the bottom of the list.
From the top of the list, some bins will be selected
and the rest of the bins will be discarded. If there is a
bin which contain an individual belongs to already se-
lected bins, that bin will be discarded as well. For the
individuals which are discarded, they will be ordered
by their fitness and first fit descending algorithm will
be used in order to reinsert them to the offspring chro-
mosome.
Because the algorithm always prefers tightly
packed bins over other bins, they added a Gaussian
noise to the fitness function of the individuals in order
to escape the local minimums. Respectively, in their
mutation operator, the mutation take place more on
less fit bins than good bins. This will assure that the
structure of good groups does not intact often. They
used three mutation operator. First, normal GGA mu-
tation while some bins will remove randomly and
their individuals will reinsert into the chromosome.
Second, two items in the order list will be swapped,
and third, one item will be randomly relocate in the
order list.
3 MULTI-LEVEL GROUPING
GENETIC ALGORITHM
In the GGA, a new crossover and mutation operators
were introduced in order to save the group relations
between individual genes. In a similar way, here, the
MLGGA crossover and MLGGA mutation operators
are introduced in order to preserve the relations be-
tween groups. These operators substitute the normal
MULTI-LEVELGROUPINGGENETICALGORITHMFORLOWCARBONVIRTUALPRIVATECLOUDS
317

GA crossover and mutation operators and work along
with the other GA operators as shown in lines 6 and 7
of the following MLGGA pseudocode:
1: Choose initial population.
2: Evaluate each individual’s fitness.
3: repeat
4: Select individuals to reproduce.
5: Mate pairs at random.
6: Apply MLGGA crossover operator.
7: Apply MLGGA mutation operator.
8: Evaluate each individual’s fitness.
9: until terminating condition
3.1 MLGGA Crossover
In the virtual cloud problems, the positions of VMs
are the variables of the problem. In these problems,
grouped variables, such as server consolidation, lower
the cost function. However, normal GA crossover
break the existing groups in parent genes, and prob-
ability of preserving the good grouping features pre-
sented in parent genes is very low. Although the GGA
crossover provides a way to preserve the grouping
features in parent genes, there are relations between
groups that the GGA crossover is not able to preserve,
and most probably it breaks these relations. In the net-
work of data centers, the GGA is good to consolidate
VMs on servers, but it is not able to identify that there
are benefits in choosing servers from only one data
center. For example, the GGA may consolidate VMs
on different servers which allow us to turn off some of
the servers and save energy, but it is not aware that if
it consolidate all servers on less number of data cen-
ters as well, it may save a lot more by turning off an
intermittent data center.
For example, assuming parent genes P1 and P2
and their groups are as follow:
P1 : ACDEGIJB
(ACDEGAIJDCBACDEAGIA)
P2 : bcghieda
(bcghieddaccccehigha)
If each group is assigned to a higher level group (a
bigger bin) as follows:
W={A} X={B,C}, Y={D,E,F}, Z={G,H,I,J}
w={a} x={b,c}, y={d,e,f}, z={g,h,i,j}
The genes group lineup can be rewritten as their
higher level groups as follows by replacing the group
representations (for example, ACDEGIJB for P1) by
their higher level group labels:
P1 : WXYYZZZX ← ACDEGIJB
P2 : xxzzzyyw ← bcghieda
As it is shown above, some higher level groups
are repeated in the group lineup. Here, we create a
higher level group lineup (level 2 group lineup), and
we keep only one gene per higher level group similar
to what we did in group lineup in lower level. Now,
the chromosome could be written as below:
P1 : WXYZ WXYYZZZX
(ACDEGAIJDCBACDEAGIA)
P2 : xzyw xxzzzyyw
(bcghieddaccccehigha)
where the first column is the new level 2 group
lineup representation of the chromosomes. The
crossover will be done on the level 2 group lineup rep-
resentation of the genes: (WXYZ) and (xzyw). Like
the GGA, two crossover point will be chosen ran-
domly on each gene:
P1 : WX|Y|Z WXYYZZZX
(ACDEGAIJDCBACDEAGIA)
P2 : x|zy|w xxzzzyyw
(bcghieddaccccehigha)
and the middle part of second gene will be inserted
to the first gene, and similar higher level groups in
first gene with their assigned groups and containing
individuals will be removed from the gene.
Offspring : WX|zyY|Z
As it is shown in above, higher level groups (z) and
(y) are inserted from second parent to the first parent.
This means that their matching higher level groups
(Z) and (Y) are not any more valid and their contain-
ing groups (D,E,F,G,H,I,J) and their containing in-
dividuals should be removed from the chromosome;
which remains the offspring chromosome as below:
Offspring : WXzy (ACghiedd?CBACehighA)
Genes number 3-8, and 14-18 in second parent (P2)
are belongs to groups (d,e,f,g,h,i,j) which are belongs
to higher groups (y,z) and they are transferred directly
from second chromosome to the first chromosome.
Gene number 9 is in group (D) in first parent which
belongs to higher level group (Y) which needs to be
removed as mentioned above.
For the genes in first parent, which are replaced
with genes from second parents, there are some indi-
viduals which are belongs to some groups and higher
level groups which are not yet removed from the chro-
mosome. For our example, genes number 6 and 16 are
belong to group (A) in first parent chromosome which
are replaced with (e) and (i) from the second parent
chromosome. These individuals with their co-group
and co-higher-group individuals need to be removed
from the chromosome as well. Co-group individuals
of an individual are those genes which are in the same
group, and co-higher-group individuals of and indi-
vidual are those genes which are in the same higher
CLOSER2012-2ndInternationalConferenceonCloudComputingandServicesScience
318

group. For our example, all individuals in higher level
group (W) which is higher level group of (A) need to
be removed from the offspring chromosome. For our
example, the offspring chromosome will be like this:
Offspring : Xzy (?Cghiedd?CB?Cehigh?)
As it is shown in above, higher level groups (X) from
first parent, and (z) and (y) from the second parent are
preserved in the offspring chromosome intact which
is the goal of the crossover operator.
At the end, there are some individuals which are
not assigned to any group and higher level group.
These individuals will fit in the chromosome by us-
ing the First Fit Descending algorithm or more ad-
vanced fitting techniques. Higher level groups which
are fuller will chosen first, and also fuller groups are
in more priority for first fit algorithm.
3.2 MLGGA Mutation
The MLGGA mutation is very similar to the MLGGA
crossover concept. From a selected chromosome:
P1 : WXYZ WXYYZZZX
(ACDEGAIJDCBACDEAGIA)
Some higher level groups will be randomly cho-
sen, and all co-group and co-higher-group individual
genes will be removed from the chromosome. For our
example, if higher level group (Z) is selected to be re-
moved, the remaining chromosome will be as below:
P1 : WXY WXYY???X
(ACDE?A??DCBACDEA??A)
Then, the First Fit algorithm will be used to reinsert
them to the chromosome as described in crossover op-
erator section.
3.3 Extensions of the MLGGA
Crossover and Mutation
In the GGA, the concept of group of individual genes
is introduced. In previous section, we described a sit-
uation where there are some relations between groups
of groups in a problem. We can extend this solution
for cases in which there are several level of group-
ing involved. For example, if, in a problem, individ-
uals are grouped by some criteria, the problem has
grouping relations at level 1. If the groups of level
1 are grouped by some other criteria, there will then
be a grouping of level 2. And similarly, we can have
grouping of level n for a problem.
For a problem with the grouping of level n, a level
n MLGGA crossover and mutation should be used.
The concept of the level-n MLGGA crossover and
mutation is similar to what we described in previous
subsections which was a level-2 MLGGA crossover
and mutation. For the level-n MLGGA crossover, in-
dividual genes will be represent by their level 1, level
2, ..., level n groups. Two crossover point will be se-
lected randomly in parents level-n groups representa-
tion, and the second part of second chromosome will
be inserted to the first chromosome. The matching
level-n groups in first chromosome with all their indi-
viduals will be removed from the offspring chromo-
some. For those individual genes in first parent which
are replaced with transferring genes from second par-
ent, all their co-level-n-group individual genes will be
removed as well. Co-level-n-group individuals of an
individual are those genes which are in the same level
n group. At the end, all removed individuals will be
inserted to the chromosome with using an First Fit al-
gorithm or more advanced algorithms as described in
previous subsections. According to this definition, the
GGA algorithm is a level-1 MLGGA.
Level-n mutation operator will be defined in a
very similar way with randomly selecting some level-
n groups and removing their individuals and reinsert-
ing them.
4 VIRTUAL PRIVATE CLOUD
USE CASE
In order to examine the performance of new algorithm
on energy efficiency and Carbon footprint reduction,
we test it in a simulation platform. A Virtual Pri-
vate Cloud (VPC) (Van der Merwe et al., 2010)(Wood
et al., 2010)(Farrahi Moghaddam et al., 2011) is sim-
ulated and tested under two heuristic algorithms: the
GGA and the proposed MLGGA. Different case stud-
ies are considered to test the proposed algorithm as
follows:
• Medium-scale network under normal load (Case
study 1):
In this case study, a network of 7 data centers in
7 cities around the world is simulated and car-
bon footprint and energy consumption of the net-
work is measured under different optimization al-
gorithms. Initial utilization of servers are about
60% in this case study. This case study shows
how the proposed algorithm competes with the
other algorithm in a medium-scale network under
medium utilization. This case study is the base-
line case study for this research. Some parameters
is changed in this case study to create new case
studies. For example, in order to see the effect of
high utilization on the algorithms, the following
case study is considered.
MULTI-LEVELGROUPINGGENETICALGORITHMFORLOWCARBONVIRTUALPRIVATECLOUDS
319

• Medium-scale network under heavy load (Case
study 2):
In this case study, A network similar to case study
1 is simulated and Carbon footprint and energy
consumption of the network is measured under
different optimization algorithms. Initial utiliza-
tion of servers are about 90%. This case study
shows how the proposed algorithm outperforms
the other algorithm in a medium-scale network
under heavy utilization.
Another important parameter is the network size
which is considered in the following case study
in which a large-scale network is defined in order
to show the effect of the size of network on the
algorithms.
• Large-scale network under normal load (Case
study 3):
In this case study, A network of 20 data centers in
11 cities are simulated and carbon footprint and
energy consumption of the network is measured
under different optimization algorithms. Initial
utilization of servers are the same as case study 1.
This case study compares the performance of the
new algorithm compete with other algorithm in a
Large-scale network under medium utilization.
4.1 Simulation Platform Specifications
Simulation platform is designed in Matlab environ-
ment. In this platform, a set of components are sim-
ulated such as data centers, servers, VMs, VM mi-
grations, and weather conditions. It is possible to de-
fine more than one data centers in each selected cities
in this simulation platform. Each data center can be
connected to a source of renewable energy and alter-
native non-green source of energy. Renewable source
of energies which are simulated in this environment
includes solar, wind, hydro, and nuclear source of en-
ergies. There is battery bank in each data center which
stores extra green power to be used when the source of
green energy is not available. The simulator estimates
the energy used in each data center based on the num-
ber of running servers and other utilities, and calcu-
lates the extra green power. Knowing the extra green
power at a moment, the simulator will update the bat-
tery charge of each data center. Not all source of green
power are the same, and each renewable source of
energy has its own cleanness measured as the g fac-
tor (Farrahi Moghaddam et al., 2011). The g factor
changes according to the availability of source of en-
ergy and charge of batteries in each node. For exam-
ple, for solar and wind energy, if there is enough en-
ergy stored in the batteries, the g is high. In contrast,
when the batteries are discharged and data center is
using the grid energy the g factor is low. For hydro
and nuclear energy, if energy exist, g factor is always
high, and for grid energy powered by coal, g factor is
always low.
4.2 Optimization Algorithms
To evaluate the efficiency of the proposed algorithm,
the MLGGA algorithm is compared with the GGA
algorithm which is used in other works for energy ef-
ficiency in virtualized data center environments. car-
bon footprint and energy consumption of the network
are also measured when there is no optimization in
order to have a baseline in the comparison of the re-
sults of the GGA and the MLGGA. This will show
how much energy and carbon these two algorithm can
save. As shown in the previous works section, there
are things which can be done to improve the result
of the GGA in energy efficiency in virtualized data
center environment. Here, we use the same improve-
ments for both GGA and MLGGA as described in
previous works. The only differences between the two
algorithms implementation are the crossover and mu-
tation operators, and the rest of the algorithms are ex-
actly the same, and both algorithms benefit from the
enhancements.
4.3 Carbon and Energy Measurement
One of very important parts of the new algorithm eval-
uation is the carbon and energy measures which are
used to show the carbon/energy footprint of the whole
network. For this research, a measurement tool which
is developed for virtual private clouds is used to mea-
sure the Carbon and energy footprint of the whole net-
work of data centers (Kansal et al., 2010)(Economou
et al., 2006)(Farrahi Moghaddam et al., 2011). For
Carbon footprint the following formulation is used:
C(t,∆
t
) = C
m
(∆
t
) +C
DC
on/o f f
(∆
t
)
+ρ
max
∑
d
O
d
(1 − g
d
(t))
P
c
d
(t)+ P
P
d
(t)
+
∑
s∈d
O
s
(α
cpu
s
µ
cpu
s
+α
mem
s
µ
mem
s
+α
io
s
µ
disk
s
+ γ
s
)
∆
t
(1)
where C(t,∆
t
) is the total carbon footprint of the net-
work in time t for time period of ∆
t
. For more details
please see (Farrahi Moghaddam et al., 2011).
And for energy measurement, the following for-
mulation is used:
E(t,∆
t
) = C
m
(∆
t
)/ρ
max
+C
DC
on/o f f
(∆
t
)/ρ
max
+
∑
d
O
d
P
c
d
(t)+ P
P
d
(t)
+
∑
s∈d
O
s
(α
cpu
s
µ
cpu
s
+α
mem
s
µ
mem
s
+α
io
s
µ
disk
s
+ γ
s
)
∆
t
(2)
CLOSER2012-2ndInternationalConferenceonCloudComputingandServicesScience
320
where E(t,∆
t
) is the total energy consumption of the
network in time t for time period of ∆
t
. For more
details please see (Farrahi Moghaddam et al., 2011).
The objective of this work is to reduce the car-
bon footprint and emissions. As shown in (Farrahi
Moghaddam et al., 2011), Carbon optimization and
energy optimization are not equivalent in VPC envi-
ronments. When the Carbon is optimized, energy is
not necessary optimized. Here, the energy is mea-
sured just as a reference, and no optimization with re-
spect to energy is performed. There are many works
that deal with energy efficiency in the literature such
as dynamic CPU speed, energy-aware job scheduling,
server consolidation (Zhang et al., 2008).
4.4 Results
The algorithms are tested on medium-scale and large-
scale networks in a simulation environment
1
which
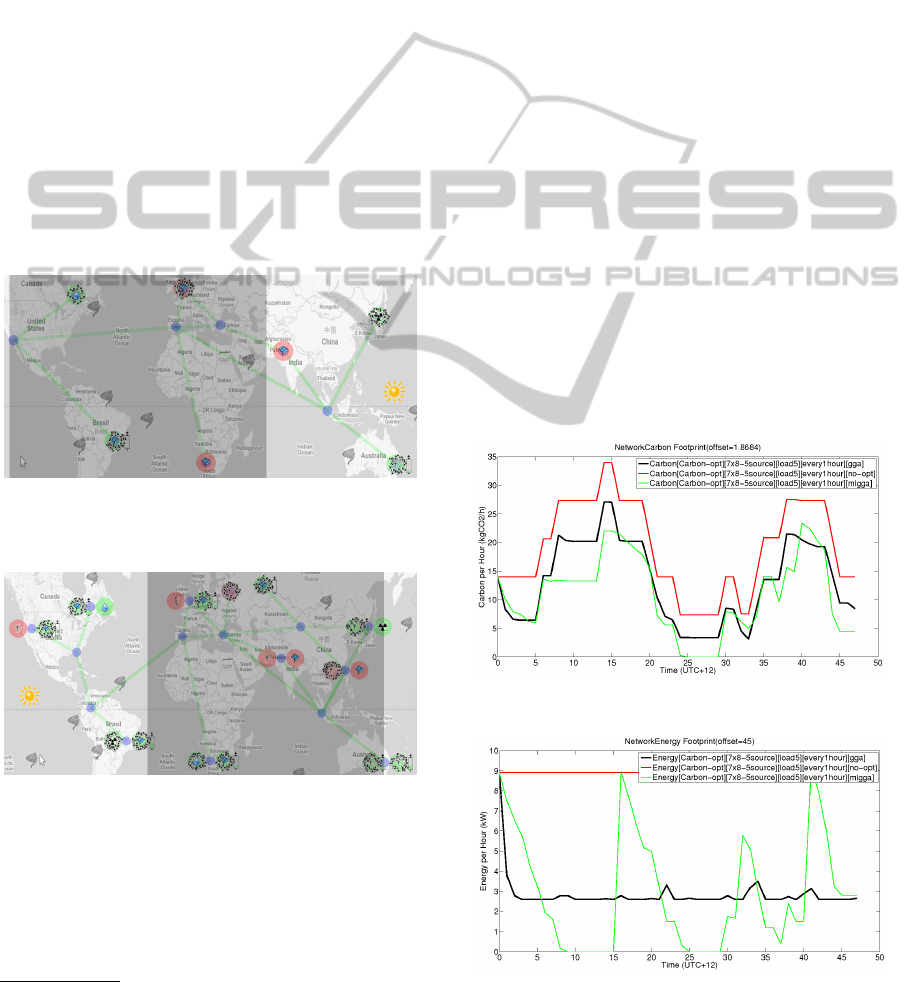
are shown in Figure 1 and Figure 2.
Figure 1: Medium-scale network of data centers (case study
1).
Figure 2: Large-scale network of data centers (case study
3).
As it is depicted in Figures 1 and 2, each data cen-
ter is illustrated with a red or green filled circle. Red
circle means that data center is using a source of en-
ergy with a g factor less than 0.5, and green circle
means that data center is using a source of energy with
1
http://www.greenservices.info/2011/10/simulation-
environment.html
g factor greater than 0.5. The type of source of energy
for each data center is illustrated as an icon in the mid-
dle of the circle. Available source of energies in this
simulation are solar, wind, hydro, nuclear, and grid
(coal). As it is shown, hydro and nuclear source of
energies are always green, and grid source of energy
is always red. For solar and wind source of energies,
it depends on existence of sun and wind, and also on
the amount of energy stored in the batteries. For ex-
ample, in Figure 1, the solar power in Brazil is green
even though at the moment the snapshot taken it is
midnight there. It is because of available solar power
stored in batteries of the data center. As it is shown,
there is a battery indicator near the data center which
is reflecting the remaining battery charge in each data
center. The battery indicator for data center in Brazil
shows that there is not much battery left and the data
center will soon switch to grid which is a non-green
source of energy. This has already happened for the
data center in South Africa and France. The data cen-
ter in India is in day time, but it is still red. There
are two reason for that. First, it is early morning in
India, so the sun light is not direct, and solar power
generation is low. Second, there is not enough energy
stored in data center batteries in order to enable the
data center to switch from grid power to solar power.
For case study 1, measured carbon and energy are
shown in Figures 3 and 4.
Figure 3: Carbon measurement in case study 1.
Figure 4: Energy measurement in case study 1.
MULTI-LEVELGROUPINGGENETICALGORITHMFORLOWCARBONVIRTUALPRIVATECLOUDS
321
In the legend of figures Figures 3 and 4, Carbon
means that carbon is measured and Energy means that
energy is measures, while [Carbon-opt] means that
for all cases the optimizer was trying to minimize the
carbon and not the consumed energy. The tag [7x8-
5source] shows the structure of the network which is
a 7 data center with 8 server on each data center with
5 different type of source of energy. [every1hour]
means that the optimizations are done for every one
hour, according to (Farrahi Moghaddam et al., 2011)
this is an acceptable interval. [gga], [no-opt], and
[mlgga] represent the optimization algorithm for each
graph. All the graphs need to be summed with the off-
set value in the title of each graph in order to achieve
the real carbon or energy value.
As it is shown in Figure 3, the proposed algorithm
has a better performance compare to the GGA. The
associated curve of the MLGGA is under the curve of
the GGA in the most of time. This is not the case for
the energy as it is shown in Figure 4, and the energy
footprint of the MLGGA is not visually better than
the GGA. As described in (Farrahi Moghaddam et al.,
2011), carbon optimization and energy optimization
are not equivalent in network of data centers with dif-
ferent energy and carbon footprint profiles, and here
we confirmed it again.
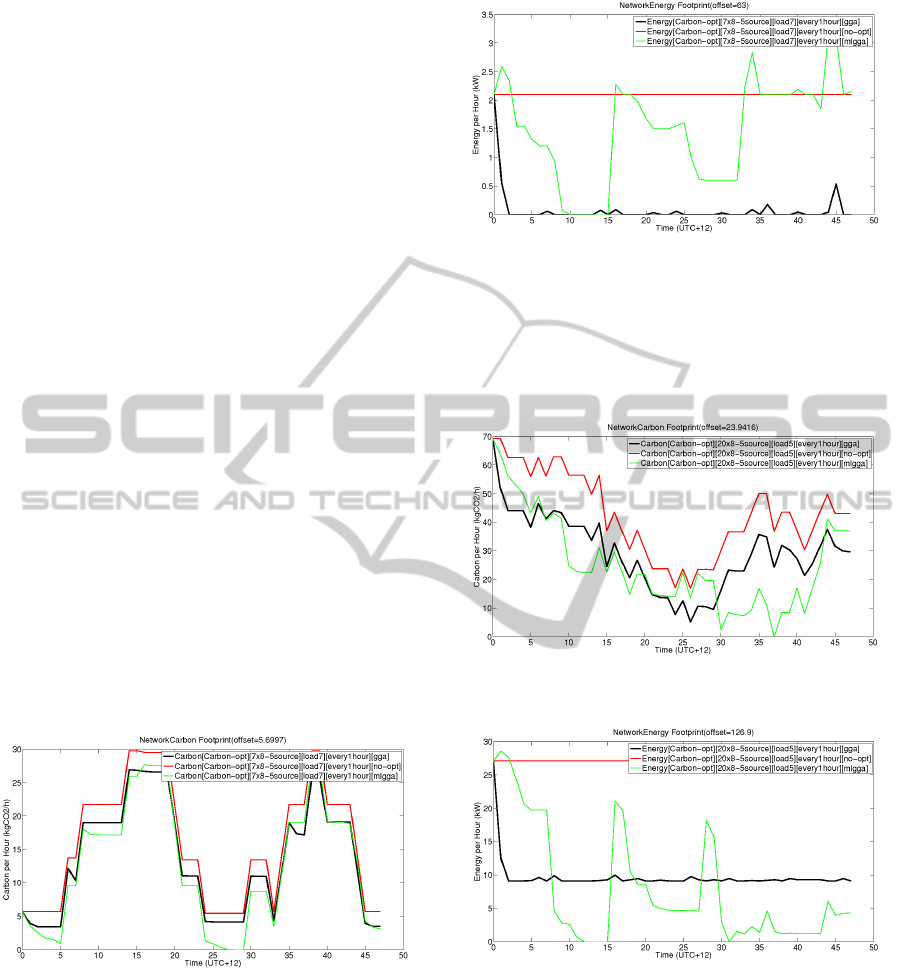
For case study 2, the measured carbon and en-
ergy are shown in Figures 5 and 6. As it is shown,
the MLGGA has a better performance compare to the
GGA, but the difference in the performance is de-
creased because of higher data center utilization.
Figure 5: Carbon measurement in case study 2.
For case study 3, measured carbon and energy are
shown in Figures 7 and 8. The graph shows more
complexity compared to case study 1 and 2 according
to higher number of involved data centers in this case
study. The better performance of the MLGGA is vi-
sually recognizable on the carbon graph. Because the
optimization for each point is not isolated from previ-
ous points, we cannot compare the two curves point
to point. To have a better understanding of the amount
of carbon footprint and energy consumption, the ac-
Figure 6: Energy measurement in case study 2.
cumulated amount of emitted carbon is summarized
in Table 1 and Table 2, and accumulated amount of
consumed energy is summarized in Table 3 and Table
4.
Figure 7: Carbon measurement in case study 3.
Figure 8: Energy measurement in case study 3.
The ”No-opt”, ”GGA”, and ”MLGGA” columns
show the exact measured emitted carbon of the net-
work. the ”GGA %” and ”MLGGA %” columns show
the emissions percentage of the two optimization al-
gorithms with respect to the no-optimization situa-
tion. And the ”MLGGA perf. %” column show the
performance of ”MLGGA” over ”GGA”. As shown
in the Table 1 and Table 2, the MLGGA has a better
performance of 10.65 % over the GGA in case study
1. The MLGGA has better performance compare to
CLOSER2012-2ndInternationalConferenceonCloudComputingandServicesScience
322

Table 1: 48 hour carbon footprint.
Case No-opt GGA MLGGA
study
CO2kg CO2kg CO2kg
Case 1 1009.56 719.79 612.30
Case 2 1040.31 922.92 877.14
Case 3 3202.28 2560.70 2369.49
Table 2: 48 hour carbon footprint.
Case GGA MLGGA MLGGA
study perf.
% % %
Case 1 71.30 60.65 10.65
Case 2 88.72 84.32 4.40
Case 3 79.96 73.99 5.97
the GGA in case study 2 and 3 too, but the better per-
formance is decreased when network is more utilized
or the network is bigger. Overall, the table shows a
better performance for the proposed algorithm. For
more utilized network, it is much harder for the GGA
and the MLGGA to group all the VMs on some data
centers with green energy and empty the one with non
renewable energy due to high number of VMs in the
network.
Table 3: 48 hour energy footprint.
Case No-opt GGA MLGGA
study
KWh KWh KWh
Case 1 2587.20 2296.48 2299.63
Case 2 3124.80 3027.88 3095.52
Case 3 7392.00 6555.61 6466.39
As mentioned earlier, the gain on energy is little
or even negative as it is shown in Table 3 and Table
4. With targeting on Carbon, this loss will pay off in
future with Carbon penalty/reward regulations.
5 CONCLUSIONS AND FUTURE
WORK
According to the results, the level-2 MLGGA, intro-
duced in this work, can provide better results in prob-
lems such as VPC carbon optimization. The GGA
was able to reduce 28.7% carbon emission compare
to no-optimization situation, while the MLGGA was
able to reduce 39.35% carbon emission compare to
no-optimization case which shows that the MLGGA
has an overall 10.65% better performance compared
to the GGA. When the utilization of the network of
data centers is increased, the MLGGA was able to re-
duce 4.4% more in carbon emission compared to the
Table 4: 48 hour energy footprint.
Case GGA MLGGA MLGGA
study perf.
% % %
Case 1 88.76 88.88 -0.12
Case 2 96.90 99.06 -2.16
Case 3 88.69 87.48 1.21
GGA. The decrease in the relative performance com-
pared to the low-utilization case is because of higher
number of VMs in the network. This lowers the pos-
sibility of emptying a whole data center from virtual
machines. But, overall the MLGGA has a better per-
formance in higher utilization compare to the GGA.
In another test, when the network size increased from
7 data centers to 20 data centers with the same rate of
utilization, again the MLGGA outperforms the GGA
with 5.97% extra Carbon emission decrease. Over-
all, the MLGGA has a better performance compared
to the GGA in problems such as low-carbon virtual
private cloud problem.
Beside the carbon footprint, the energy consump-
tion of the network was measured. According to the
results the energy consumption for the MLGGA has
a little improvement or declination compared to the
GGA over time. This is because of the nature of the
virtual private cloud problem. In VPC, which is dis-
tributed over different locations and powered with dif-
ferent source of energies, the carbon footprint reduc-
tion and energy efficiency are not equivalent. Accord-
ing to our objective, the carbon footprint was min-
imized. According to the cost of renewable source
of energies, carbon footprint optimization is costly
now, but with implementation of the expected carbon
penalty/reward regulations in the near future, carbon
footprint optimization could be used to minimize the
overall cost of the network as well.
For future works, the following suggestion might
be considered: i) The MLGGA can be used on other
type of grouping problems and success of the al-
gorithm can be compared with other heuristic algo-
rithms, ii) The higher levels of MLGGA can be tested
on problems with higher level of grouping, iii) More
real world data can be used in the simulations in or-
der to make the results more usable in real world VPC
implementations, iv) the energy consumption can be
chosen as target and the indirect carbon footprint re-
duction can be studied, and v) for having a good es-
timation of cost in such a networks, the real cost of
operating a virtual private network can be model and
measured. The measured cost can be compared for
different inter- and intra-data center topologies with
their constraints, such as pooling limits. The solution
will be different for different load scenarios, and also
for different application types running on the VMs.
MULTI-LEVELGROUPINGGENETICALGORITHMFORLOWCARBONVIRTUALPRIVATECLOUDS
323

One scenario could be the comparison of costs of car-
bon footprint optimization and energy consumption
optimization. In additional, various penalty/reward
regulations for carbon footprint reduction, such as
carbon tax, can be model and simulated in order to es-
timate the success rate of such networks in real world
conditions.
ACKNOWLEDGEMENTS
The authors thank CANARIE (Canadian Network for
Advanced Research in Education) for their financial
support of the GreenStar Network project. The au-
thors also thank the MDEIE (Ministry of Economic
Development, Innovation and Export Trade) of Que-
bec for their financial support.
REFERENCES
Agrawal, S., Bose, S. K., and Sundarrajan, S. (2009).
Grouping Genetic Algorithm for Solving the Server-
consolidation Problem with Conflicts. In Proceedings
of the first ACM/SIGEVO Summit on Genetic and Evo-
lutionary Computation, pages 1–8, Shanghai, China.
ACM.
Ajiro, Y. and Tanaka, A. (2007). Improving Packing Algo-
rithms for Server Consolidation. In In Proceedings of
the International Conference for the Computer Mea-
surement Group (CMG).
Beloglazov, A., Buyya, R., Lee, Young, C., and Zomaya, A.
(2010). A Taxonomy and Survey of Energy-Efficient
Data centers and Cloud Computing Systems. Tech-
nical report, CLOUDS-TR-2010-3. Cloud Comput-
ing and Distributed Systems Laboratory, University of
Melbourne, Australia.
Clark, C., Fraser, K., Hand, S., Hansen, J. G., Jul, E.,
Limpach, C., Pratt, I., and Warfield, A. (2005). Live
Migration of Virtual Machines. In In Proceedings
of the 2nd conference on Symposium on Networked
Systems Design & Implementation (NSDI05), Vol. 2.
USENIX Association, Berkeley, CA, USA.
Economou, D., Rivoire, S., and Kozyrakis, C. (2006). Full-
System Power Analysis and Modeling for Server En-
vironments. In In Workshop on Modeling Benchmark-
ing and Simulation (MOBS.
Falkenauer, E. and Delchambre, A. (1992). A Genetic Algo-
rithm for Bin Packing and Line Balancing. In IEEE In-
ternational Conference on Robotics and Automation,
pages 1186–1192 vol.2.
Farrahi Moghaddam, F. and Cheriet, M. (2010). Decreasing
Live Virtual Machine Migration Down-Time Using a
Memory Page Selection Based on Memory Change
PDF. In Networking, Sensing and Control (ICNSC),
2010 International Conference on, pages 355–359.
Farrahi Moghaddam, F., Cheriet, M., and Nguyen, K. K.
(2011). Low Carbon Virtual Private Clouds. In
IEEE International Conference on Cloud Comput-
ing (CLOUD’ 11), pages 259–266, Washington, DC,
USA.
Garey, M. R. and Johnson, D. S. (1979). A Guide to
The Theory of NP-Completeness. Technical report,
W.H.Freeman Co., San Francisco.
Gmach, D., Rolia, J., Cherkasova, L., and Kemper, A.
(2009). Resource Pool Management: Reactive Ver-
sus Proactive or Let’s be Friends. Comput. Netw.,
53(17):2905–2922.
Kansal, A., Zhao, F., Liu, J., Kothari, N., and Bhattacharya,
A. A. (2010). Virtual Machine Power Metering and
Provisioning. In Proceedings of the 1st ACM sympo-
sium on Cloud computing, pages 39–50, Indianapolis,
Indiana, USA. ACM.
Liu, L., Wang, H., Liu, X., Jin, X., He, W. B., Wang, Q. B.,
and Chen, Y. (2009). GreenCloud: A New Architec-
ture for Green Data Center. In Proceedings of the
6th international conference industry session on Au-
tonomic computing and communications industry ses-
sion, pages 29–38, Barcelona, Spain. ACM.
McKinsey (2007). The Impact of ICT on Global Emissions.
Technical report, tech. rep., on behalf of the Global
eSustainability Initiative (GeSI).
Van der Merwe, J., Ramakrishnan, K. K., Fairchild, M.,
Flavel, A., Houle, J., Lagar-Cavilla, H. A., and Mulli-
gan, J. (2010). Towards a ubiquitous cloud computing
infrastructure. In 17th IEEE Workshop on Local and
Metropolitan Area Networks (LANMAN), pages 1–6.
Webb, M. (2008). SMART 2020: Enabling the Low Carbon
Economy in The Information Age. In The Climate
Group, London.
Wilcox, D., McNabb, A., and Seppi, K. (2011). Solving
Virtual Machine Packing with A Reordering Group-
ing Genetic Algorithm. In Evolutionary Computation
(CEC), 2011 IEEE Congress on, pages 362–369.
Wood, T., Gerber, A., Ramakrishnan, K. K., Shenoy, P., and
der Merwe, J. V. (2009). The Case for Enterprise-
Ready Virtual Private Clouds. In Proceedings of the
2009 conference on Hot Topics in Cloud Computing
(HotCloud09). USENIX Association, Berkeley, CA,
USA.
Wood, T., Ramakrishnan, K., van der Merwe, J., and
Shenoy, P. (2010). CloudNet: A Platform for Opti-
mized WAN Migration of Virtual Machines. Techni-
cal report, University of Massachusetts Technical Re-
port TR-2010-002.
Xu, J. and Fortes, J. (2010). Multi-Objective Virtual Ma-
chine Placement in Virtualized Data Center Environ-
ments. In In proceedings of the 2010 IEEE/ACM In-
ter. Conference on Green Computing and Communi-
cations & Inter. Conference on Cyber, Physical and
Social Computing, Hangshou, PR of China.
Zhang, Q., Cheng, L., and Boutaba, R. (2008). Cloud Com-
puting: State-of-The-Art and Research Challenges.
Journal of Internet Services and Applications, 1(1):7–
18.
CLOSER2012-2ndInternationalConferenceonCloudComputingandServicesScience
324
