
COMMUNITY ASSOCIATION MAP
Processing Inter-community Relationships
D
´
arlinton B. Feres Carvalho, Hugo Fuks and Carlos Jos
´
e Pereira de Lucena
Department of Computer Science, Pontifical Catholic University of Rio de Janeiro (PUC-Rio)
Rua Marqu
ˆ
es de S
˜
ao Vicente 225, Rio de Janeiro, Brazil
Keywords:
User Interest Analysis, Online Community Analysis, Social Media Analysis, Social Media.
Abstract:
The use of modern communication technology like the Internet brings a new perspective for the study of
society. Following this paradigm shift, this paper presents a process to help in the analysis of social media
available on the Internet, specially the analysis focused in the online community’s content. The process goal
is to reveal the interests of users through a map of associated communities. The user membership is utilized to
establish the relationship among communities. This map shows the interests of members in other communities.
An example illustrates the application of the process. A discussion about the opportunities and drawbacks of
the process usage is also presented.
1 INTRODUCTION
With more than two billion users
1
, the Internet has
become the mainstream channel to study society. The
content available in social media is useful for many
different kinds of applications, from academia to busi-
ness purposes. For instance, the analysis of the dis-
cussion presented in online communities could be
a promising way to study healthcare topics (Paton
et al., 2011; Bender et al., 2011).
In the literature, publications can be found ana-
lyzing the content available on the Internet, devoting
special attention to social network analysis. How-
ever, recent studies are questioning the overrating
of current social network studies and looking for a
broader analysis of the content available in social me-
dia (Kwak et al., 2010; Cormode et al., 2010). This
work improves on the existing body of work devoted
to the content analysis of online communities (Preece
and Maloney-Krichmar, 2005), providing information
of users’ interests based on their associations within
their communities that helps to characterize the pop-
ulation involved in the community under analysis.
The process proposed in this paper focuses on user
membership within communities. Membership could
be seen as the user interest in the community topic.
The process relies on a model of related communities
based on users’ interest. A plotted graph reveals the
1
http://www.internetworldstats.com/stats.htm (Novem-
ber 2011)
strongest affinities by weight of the connecting lines
linking communities. These graphs help experts in
discovering trends that will further their understand-
ing in specific social matters. Furthermore, experts
can apply filters on the data set to choose which users
and communities are interesting for the analysis. The
process application is limited to situations in which
users are also members of other communities.
The remainder of this paper is organized as fol-
lows. The methodology, with the epistemology con-
sidered on the process creation, is presented in Sec-
tion 2. Section 3 presents the proposed process. The
application of the process is illustrated by an exam-
ple in Section 4. A discussion about the opportunities
and drawbacks of the process application concludes
this paper in the Section 5.
2 METHODOLOGY
The study of social media has its roots in social sci-
ence. However, the use of modern communication
technology like the Internet brings a new perspective
for the study of society (Lazer et al., 2009). Follow-
ing this paradigm shift, this paper introduces a pro-
cess to exploit the content available on the sites that
support communities in order to reveal users’ prefer-
ences. This section presents the epistemology consid-
ered on the process development.
Social networking sites have spread over the Inter-
665
B. Feres Carvalho D., Fuks H. and José Pereira de Lucena C..
COMMUNITY ASSOCIATION MAP - Processing Inter-community Relationships.
DOI: 10.5220/0003913006650670
In Proceedings of the 8th International Conference on Web Information Systems and Technologies (WEBIST-2012), pages 665-670
ISBN: 978-989-8565-08-2
Copyright
c
2012 SCITEPRESS (Science and Technology Publications, Lda.)

net, bringing a new perspective for communication.
Systems like Orkut and Facebook empower people
to manage their social networks and engage in online
community discussion on topics of their interest. The
data publicly available might be useful to allow dif-
ferent kinds of research and applications.
Research over content available on the Internet
used to give special attention to social network anal-
ysis. In the literature, there are studies that attempt to
characterize the users’ population of important sites,
such as Facebook (Nazir et al., 2008), Twitter (Hu-
berman et al., 2008) and YouTube (Cheng et al.,
2008). The mainstream theory used to analyze so-
cial networks is based on complex networks stud-
ies (da F. Costa et al., 2007). Other studies aim
to understand the users on social networks, so one
can identify special users on these networks and pre-
dict the network evolution and its implications (Ben-
evenuto et al., 2009; Wilson et al., 2009; Ahmed et al.,
2010; Bigonha et al., 2010).
Recent studies are questioning the overrating of
current social network studies and looking for a
broader analysis of the content available in social me-
dia (Kwak et al., 2010; Cormode et al., 2010). An
extensive discussion on modeling and measurement
of social media is presented in the paper by Cormode
et al. (Cormode et al., 2010). This paper presents a
process to help in the analysis of social media pre-
sented in sites that support communities. The focus
is to reveal users’ interests by exploring their com-
munity associations. A community association map
is built from the communities’ membership informa-
tion, and allows the visualization of the most related
communities within a defined boundary. Due to the
kind of processed data, advanced statistics of this data
can lead to a misleading analysis, therefore it is not
covered in this work (Krishnamurthy and Willinger,
2008). Although similar approaches are found in lit-
erature, such as the feature presented on Orkut system
to provide up to nine related communities at a com-
munity page (Chen et al., 2009), not all data required
by other methods are available to be used. Moreover,
experts require more suitable tools for helping them in
the analysis of social media, such as the one presented
in this paper.
Models and measurements help experts to analyze
social media, which also considers other elements as-
sociated with their study. A key point for measure-
ment considered in the process development is the use
of appealing visualization for its outcome. To achieve
this goal, the process relies on a software package for
visualizing data and information. The study case that
motivated the process development is available in the
technical report (Carvalho and Lucena, 2010).
3 THE PROCESS CAM
The process has three steps: data gathering, model
and measurement, and visualization. The first step,
data gathering, obtains the social media data from on-
line community sites. Next is the model and measure-
ment step, as discussed in the previous section. The
collected data is processed and organized in an ap-
propriated format to plot the data visualization. The
visualization step is responsible for displaying data in
a more appealing way, easing the work of the experts.
Details of the steps to build the Community Associa-
tion Map (CAM) are presented as follows.
1 ) Data Gathering
Collect data from an online community site (social
media data source). The collection step requires ac-
quiring all user information from an isolated com-
munity of interest. Then, for each user, membership
information for other communities is obtained. The
gathered data set is a collection of users, communi-
ties, and the relationships among them.
2 ) Model and Measurement
Create the model of communities’ relationships. In
a formal notation, if user
x
is a member of commu-
nity cmm
a
and cmm
b
then cmm
a
has a relationship
with cmm
b
. If user
y
is also a member of cmm
a
and
cmm
b
, then the relationship is reinforced (+1). There-
fore, applying this rule over a given list of users and
their membership information builds the model with
the weighted relationship among the communities.
The most important measurement obtained from
this model is a list of the top relationships within the
communities (strongest ties), which means the com-
munities with more users in common. This measure
is exposed through the community association map,
which is displayed in the next step, plot.
Depending on the data available, the model size
can cause problems in the process application. To
overcome eventual processing limitations, there are
filters for the communities considered in the model.
For instance, one can choose to model only relation-
ships among communities with more than 10 mem-
bers. Applying this filter, the model will keep its
features, because the modeling goal is to identify the
most related communities.
Filters can also be applied to change the focus of
the measurement, for instance, taking into account
only communities of some specific category. An ex-
ample of filtering is in Section 4.
3 ) Plot the Visualization
The final step is to plot the community association
map. Given that the map is used to reveal the most in-
teresting associations among communities, it is useful
WEBIST2012-8thInternationalConferenceonWebInformationSystemsandTechnologies
666

Figure 1: The process that generates the Community Association Map.
to limit the number of communities presented in the
final graph.
The outcome of this process is to support experts
in the study of social media. For this purpose, one can
use Circos, a software package for visualizing data
and information. Circos plots graphs that visualize
data in a circular layout – making it ideal for explor-
ing relationships between objects or positions (Krzy-
winsk et al., 2009). Other visualization tools can also
be used.
Figure 1 gives a glance at the whole process ap-
plication. At the top of the image is the three steps
of the process in a sequence. Bellow the steps, cor-
responding with each one, there is a diagram with the
data flow from the social media source to the final plot
of the community association map. In between, there
are agents representing the software that manipulates
the data, transforming it into suitable formats. An ex-
ample of the process application is presented in the
next section.
4 EXAMPLE OF APPLICATION
The process application is illustrated by an example
used in a real life study about Hepatitis C, a medical
condition defined by the inflammation of the liver and
characterized by the presence of inflammatory cells in
the tissue of the organ
2
. This study analyzed the dis-
course presented in an online community discussion
that has Hepatitis C as its main theme and involves
other subjects related to the disease. The Commu-
nity Association Map was part of the study unveling
the interest of the users that posted messages in the
community forum. As a result, the Community Asso-
ciation Map shows the interests of active users in the
community topic reinforcing the discourse analysis.
The process implementation is split over many in-
2
http://en.wikipedia.org/wiki/Hepatitis
teractions, executed by different programs. Scripts
implemented in Lua process the data, while the
iMacros script executor on Internet Explorer Browser
automates Orkut’s system access. The final step of vi-
sualization plotting is done by a program specialized
for this purpose (i.e. Circos).
The studied community was the Hepatite
C (Portuguese for Hepatitis C), which had
around 1.2 thousand members in March 2010
and more than 2.100 days of existence. The
community URL is http://www.orkut.com.br/
Main#Community?cmm=216788. The process is
applied as described in the previous section consid-
ering active members of the Hepatitis C community.
Figure 2 illustrates the whole process application.
The full process execution took two weeks, mainly
because of the data gathering step.
1 ) Data Gathering
The application considered Orkut communities,
which were chosen mainly because of the experts’ in-
terests. The data acquisition is scraping-based due
to Orkut system limitation (no API for this purpose
is available). The data acquisition was an exhaustive
crawling within a defined boundary, having a starting
point in a community of interest.
Instead of taking all members, the process con-
sidered as input only users that posted messages on
the community forum (467 active users). From these
users, the crawler was able to retrieve 48,218 associ-
ations with 35,954 communities.
2 ) Model and Measurement
Most of the 35,954 communities have few users as-
sociated with them. The use of these communities
in the model only adds an extra effort in the model
processing. A filter to remove the communities with
less than 20 users is applied to build a more concise
model with 30 communities. The communities’ re-
lationships model is built based on a combination of
these communities.
COMMUNITYASSOCIATIONMAP-ProcessingInter-communityRelationships
667
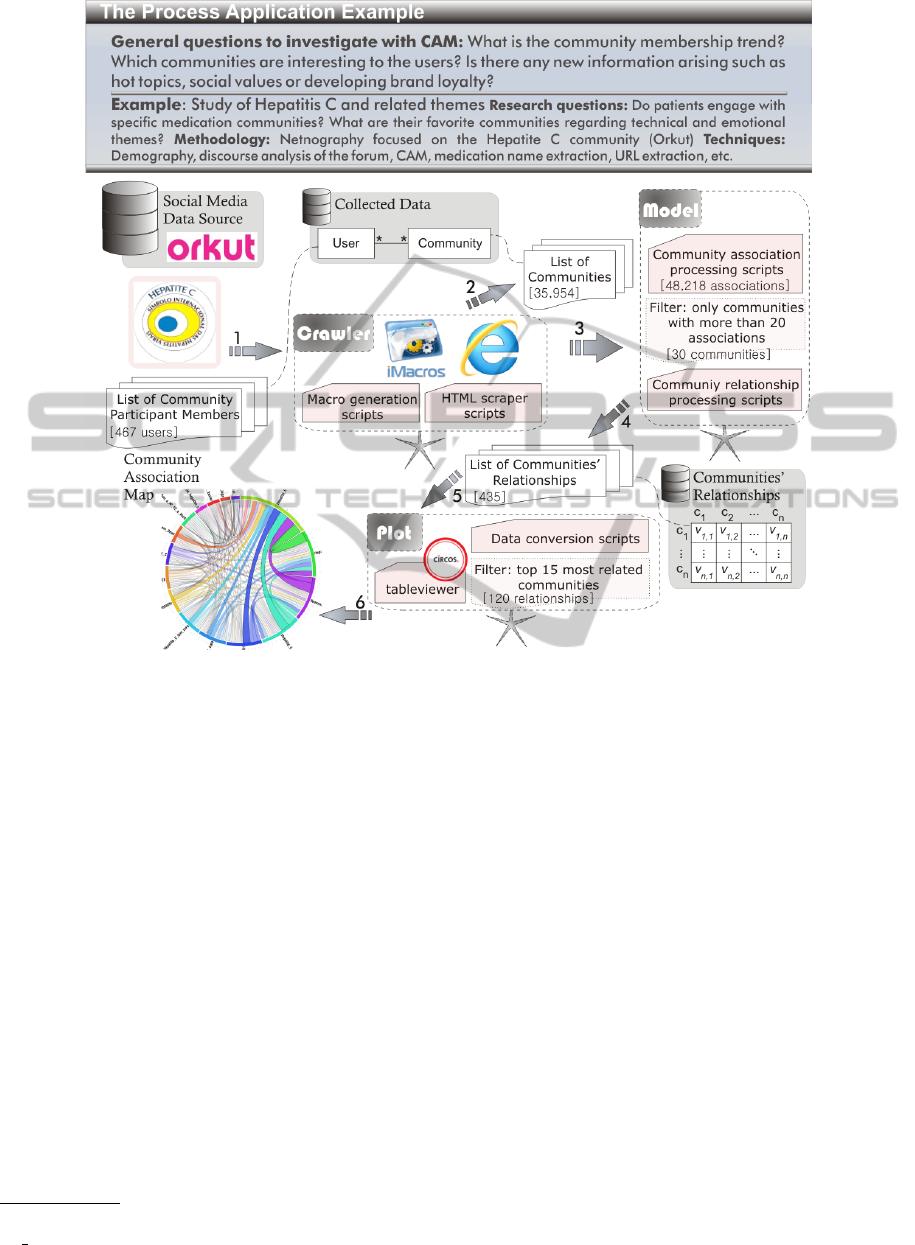
Figure 2: Details of the process application example.
3 ) Plot the Visualization
In the final step of the process, graph plotting, the last
filter is important to provide a smooth visualization.
A plot with the 15 communities related to the ana-
lyzed community has 120 weighted relationships. It
is the combination of 16 communities (15 + analyzed
community).
Figure 3 shows the plot for the model considering
the top 15 communities related to the Hepatite C com-
munity. The image is built using a special component
of Circos, the Table Viewer
3
. Table Viewer has many
configuration variables, and it must be customized for
better visualization according to each expert’s prefer-
ences. The last step is completed in two phases, first
generating the input file for Table Viewer and then ex-
ecuting it.
The communities are displayed in the graph fol-
lowing clockwise orientation in descending order of
the relationship weight with the analyzed commu-
nity (Hepatite C). The connection lines among com-
munities show the relationship weight by thickness
3
http://mkweb.bcgsc.ca/circos/presentations/articles/
vis tables2/
and transparency. Broad and opaque relationships are
stronger than narrow and translucent ones.
The plot showed in Figure 3 reveals the interests
of active users in other communities related to hepati-
tis, meaning that they are users looking for informa-
tion and support in other communities related to the
disease as well. The names of related communities
are in Portuguese because this is the language used in
the Hepatite C community.
It is important to remember that the Community
Association Map (CAM) is more interesting when
compared to other research artifacts, as part of the
whole content analysis (Kozinets, 2009). However, it
is interesting to note that most of the associated com-
munities are related to Hepatitis C, showing the strong
interest of the active users in discussing the disease.
The Orkut environment has all kinds of commu-
nities and, even without weighting the relationships
among the communities considering their size, the
graph shows that the users are engaged with others
communities regarding the topic of interest. The trend
showed in the graph is the user interest in other com-
munities related to the disease. In this case, no special
WEBIST2012-8thInternationalConferenceonWebInformationSystemsandTechnologies
668
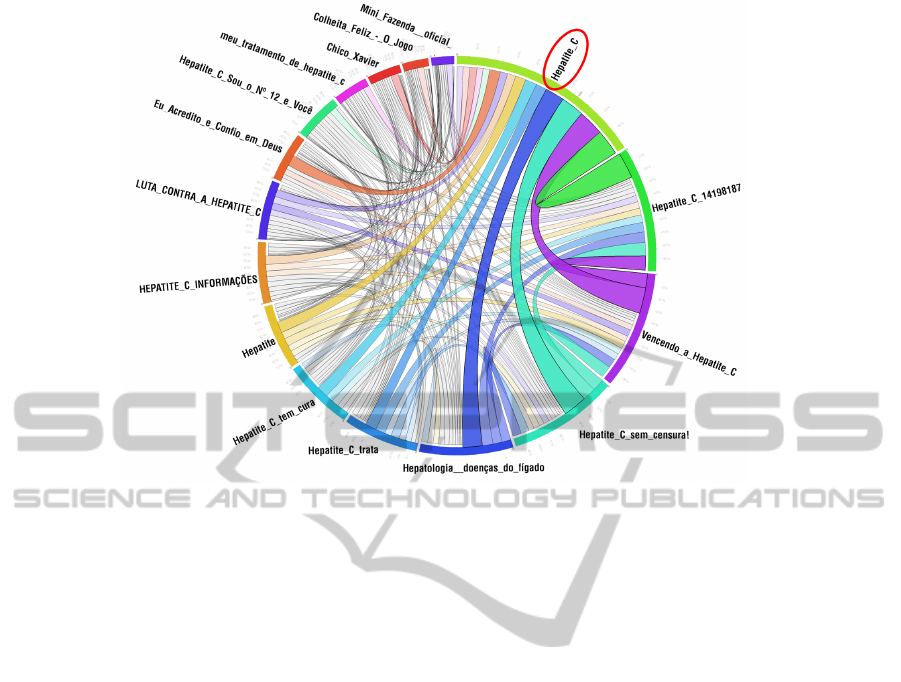
Figure 3: Community Association Map for Hepatite C (ID 216788) community.
interest stand out of the associated communities re-
lated with brands. Two other hot topics are Religion,
also identified in the discourse analysis as an impor-
tant matter of the treatment, and Games, considered
by far the most popular application in social network-
ing sites. Therefore, it reinforces the validity of the
discourse analysis of this community content in the
sense of getting a broader perception of what its user
population says and seeks.
5 DISCUSSION
A promising way to study social media is to focus
on the analysis of the online communities’ discus-
sions (Kozinets, 2009). Identifying the users’ inter-
ests in these online communities is an important part
of this study. Specialists can apply the process pre-
sented in this paper to reveal these interests and search
for textual clues in the discussions to corroborate their
findings, or vice-versa. The process generates an el-
ement of analysis that shows the interests of users
through a map of associated communities as part of
a study of social media.
The process application is limited to situations in
which users are also members of other communities.
Consequently, there must exist many other communi-
ties being hosted by the same social media site of the
community under analysis, or a way to identify links
between users from the communities under analysis to
other communities in different social media sites. For
instance, the SIOC (Semantically-Interlinked Online
Communities), an initiative that aims to create and
leverage a layer of semantic data in online communi-
ties (Breslin et al., 2006), could be used to map these
communities over different sites.
If the number of community members is avail-
able, one can modify the model to consider a nor-
malized relationship weighting. The relationship with
very large communities would show a weaker re-
lationship than with smaller communities, because
they have lesser proportional membership overlap.
This approach is not considered in this work because
the community size information is not a reliable in
the Orkut’s system, as detailed in the technical re-
port (Carvalho and Lucena, 2010). Nevertheless, the
use of filters can alleviate misrepresentations.
The advantage of the process is to provide extra
information about interests of users of an online com-
munity. Although it is up to the experts to choose
which users and communities are interesting for the
analysis, there are several filters like those shown in
the previous section. The aforementioned example
gives clues of how one can place filters on the data set
to reveal specific interests, such as considering only
active users that are more relevant to the study.
According to Cormode et al. (Cormode et al.,
2010), the process is characterized as follows. The
data collection can be retrieved by connecting to the
social media site API, or scraping-based when the
API is not available, which was the case in the exam-
COMMUNITYASSOCIATIONMAP-ProcessingInter-communityRelationships
669

ples described in this paper. The sampling methodol-
ogy is based on an exhaustive crawling within a de-
fined boundary, with starting point in a community
of interest. The measurement efforts focus on show-
ing the weighted relationships among the communi-
ties through a map. An evaluation of process results
is achieved by comparing them to other elements of
analysis (e.g. discourse analysis).
A considerable step for advancing this work is
to minimize process application restrictions. Instead
of relying on explicit user membership information,
other ways of community detection like finding inter-
ests on exchanged messages could be applied to deter-
mine community association data. In the same line of
reasoning adding text-mining capabilities could fur-
ther the extraction of more information from social
media. Finally, this process could be added as a com-
ponent on a social media analysis platform.
ACKNOWLEDGEMENTS
The authors would like to thank Rodrigo Pazzini
for his expert social media skills. This work has
been sponsored by CNPq (Brazilian Council for
Research and Development) – Bolsa de Doutorado
CNPq 142620/2009-2.
REFERENCES
Ahmed, N. K., Berchmans, F., Neville, J., and Kompella, R.
(2010). Time-based sampling of social network activ-
ity graphs. In Proceedings of the Eighth Workshop on
Mining and Learning with Graphs, MLG ’10, pages
1–9, New York, NY, USA. ACM.
Bender, J. L., Jimenez-Marroquin, M.-C. C., and Jadad,
A. R. (2011). Seeking support on facebook: a content
analysis of breast cancer groups. Journal of medical
Internet research, 13(1).
Benevenuto, F., Rodrigues, T., Cha, M., and Almeida, V.
(2009). Characterizing user behavior in online social
networks. In Proceedings of the 9th ACM SIGCOMM
conference on Internet measurement conference, IMC
’09, pages 49–62, New York, NY, USA. ACM.
Bigonha, C. A. S., Cardoso, T. N. C., Moro, M. M.,
Almeida, V. A. F., and Goncalves, M. A. (2010). De-
tecting evangelists and detractors on twitter. In Web-
Media - Brazilian Symposium on Multimedia and the
Web, pages 107–114, Belo Horizonte, Brazil.
Breslin, J. G., Decker, S., Harth, A., and Bojars, U. (2006).
SIOC: an approach to connect web-based communi-
ties. Int. J. Web Based Communities, 2:133–142.
Carvalho, D. B. F. and Lucena, C. J. P. (2010). Social media
savvy: exploiting Orkut data. Technical Report 20/10,
Pontif
´
ıcia Universidade Cat
´
olica do Rio de Janeiro,
Rio de Janeiro, Brazil.
Chen, W.-Y., Chu, J.-C., Luan, J., Bai, H., Wang, Y., and
Chang, E. Y. (2009). Collaborative filtering for orkut
communities: discovery of user latent behavior. In
Proceedings of the 18th International Conference on
World Wide Web, WWW ’09, pages 681–690, New
York, NY, USA. ACM.
Cheng, X., Dale, C., and Liu, J. (2008). Statistics and Social
Network of YouTube Videos. In Quality of Service,
2008. IWQoS 2008. 16th International Workshop on,
pages 229–238.
Cormode, G., Krishnamurthy, B., and Willinger, W. (2010).
A manifesto for modeling and measurement in social
media. First Monday, 15(9).
da F. Costa, L., Rodrigues, F. A., Travieso, G., and Boas,
P. R. V. (2007). Characterization of complex net-
works: A survey of measurements. Advances In
Physics, 56:167–242.
Huberman, B., Romero, D., and Wu, F. (2008). Social net-
works that matter: Twitter under the microscope. First
Monday, 14(1).
Kozinets, R. (2009). Netnography: Doing Ethnographic
Research Online. Sage Publications Ltd, London.
Krishnamurthy, B. and Willinger, W. (2008). What are our
standards for validation of measurement-based net-
working research? SIGMETRICS Perform. Eval. Rev.,
36:64–69.
Krzywinsk, M. I., Schein, J. E., Birol, I., Connors, J., Gas-
coyne, R., Horsman, D., Jones, S. J., and Marra, M. A.
(2009). Circos: an information aesthetic for compara-
tive genomics. Genome Res., 19(9):1639–1645.
Kwak, H., Lee, C., Park, H., and Moon, S. (2010). What is
twitter, a social network or a news media? In Proceed-
ings of the 19th international conference on World
wide web, WWW ’10, pages 591–600, New York, NY,
USA. ACM.
Lazer, D., Pentland, A., Adamic, L., Aral, S., Barabsi, A.-
L., Brewer, D., Christakis, N., Contractor, N., Fowler,
J., Gutmann, M., Jebara, T., King, G., Macy, M., Roy,
D., , and Alstyne, M. V. (2009). Life in the network:
the coming age of computational social science. Sci-
ence, 323(5915):721–723.
Nazir, A., Raza, S., and Chuah, C.-N. (2008). Unveil-
ing facebook: a measurement study of social net-
work based applications. In Proceedings of the 8th
ACM SIGCOMM conference on Internet measure-
ment, IMC ’08, pages 43–56, New York, NY, USA.
ACM.
Paton, C., Bamidis, P. D., Eysenbach, G., Hansen, M., and
Cabrer, M. (2011). Experience in the use of social
media in medical and health education. contribution
of the imia social media working group. Yearbook of
medical informatics, 6(1):21–9.
Preece, J. and Maloney-Krichmar, D. (2005). Online com-
munities: Design, theory, and practice. Journal of
Computer-Mediated Communication, 10(4).
Wilson, C., Boe, B., Sala, A., Puttaswamy, K. P., and Zhao,
B. Y. (2009). User interactions in social networks and
their implications. In Proceedings of the 4th ACM
European conference on Computer systems, EuroSys
’09, pages 205–218, New York, NY, USA. ACM.
WEBIST2012-8thInternationalConferenceonWebInformationSystemsandTechnologies
670
