
NEW RAILWAY TRANSFER SEARCH PROPOSAL
The Development of the Interactive Design Tool using the Graph Visualization of
Railway Transfer Process
Takeshi Sato
1
and Michiaki Yasumura
2
1
East Japan Railway Company, JR-East Research and Development Center, Frontier Service Lab, Saitama, Japan
2
Faculty of Environment and Information Studies, Keio University, Fujisawa, Kanagawa, Japan
Keywords: Interactive Design, Smartphone, Visualizing Railway Transfer Process, Railway Diagram.
Abstract: While individual needs are diversified, the information which railway users search for is also diversified.
But if we cannot offer the information which the users want, there is a possibility that the opportunity loss
of "transfer" and "consumption". Train transfer search engine web services let us know only information of
transfer route consisted by departure stations and arrival stations. It is difficult to satisfy user’s demands. On
this paper, we discuss the way of the railway promotion with visualization of train transfer process using
railway diagram.
1 INTRODUCTION
In Japan the most of railway companies keep the
accurate time in each every station with only a
minute delay, and the most frequent time in the
railway operation they conduct is only within a few
minutes interval. So the most railway users in Japan
can plan an accurate schedule. And the users can get
on the railway without waiting because of almost no
delay of train.
For the accuracy and convenience of railway,
Japanese station has the power of gathering people.
At the biggest station in Japan 3 million people is
gathering there in a single day. The station in Japan
takes the lead in town. If many people get off the
station more, the worth of town around station is
increasing more. However many railway users
consider the train to be a mere transportation device
from departure station to arrival station. Therefore
we consider it important to promote a stopover in
order to raise worth of the area along railroad. We
aim the promotion of stopping over using the graph
visualization of railway transfer process.
2 RESEARCH BACKGROUND
Japanese railway service is controlled by the minute
and has almost no delay but only several seconds. So
Japanese railway users can plan schedule per minute.
The most of people search train transfer time using
mobile phone web service while taking a train. The
web services have three methods of searching. The
first one is the way to get arriving earliest time from
departure station to arrival station. The second one is
the way to get arriving one with the cheapest fare
from departure station to arrival station. The last one
is the way with least number of times of changing
from departure station to arrival station. The search
engine web services offer the information on
transportation of only two points of departure station
and arrival station. And these method has used ever
since the search engine web services were developed.
The users of smartphones such as iPhone and
Android phone are increasing in Japan. And the new
search engine web services for smartphone are
developed. However they are developed on the basis
of three methods mentioned above. In short a new
information web service is hard to be not developed
even if smartphones are developed. These web
services offer the information on transportation of
only two points. In this way there are few
opportunities for railway users to get off
intermediate stations between departure one and
arrival one.
In this paper, we propose the interactive design
tool for promoting a stopover paying attention to
train transfer search engine web services. Then, we
propose the tool for visualizing railway transfer
784
Sato T. and Yasumura M..
NEW RAILWAY TRANSFER SEARCH PROPOSAL - The Development of the Interactive Design Tool using the Graph Visualization of Railway Transfer
Process.
DOI: 10.5220/0003917807840787
In Proceedings of the International Conference on Computer Graphics Theory and Applications (IVAPP-2012), pages 784-787
ISBN: 978-989-8565-02-0
Copyright
c
2012 SCITEPRESS (Science and Technology Publications, Lda.)
process for the purpose of increasing the opportunity
stopover during taking trains.
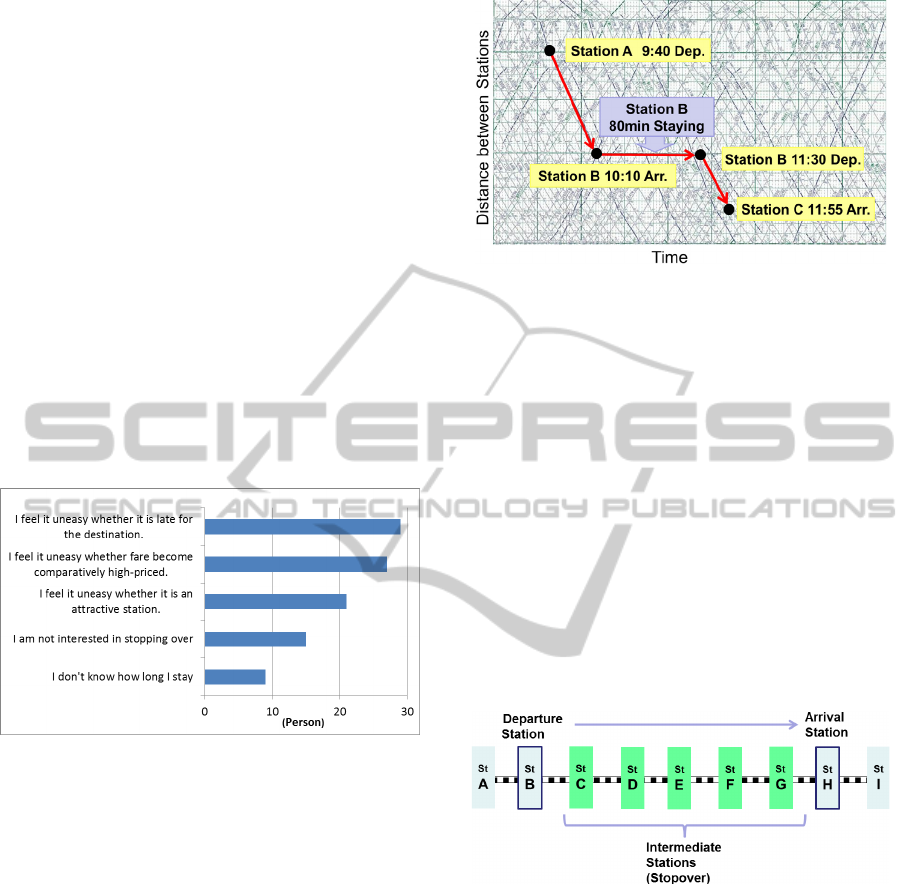
3 PRELIMINARY SURVEY
We conducted the Web survey about the factor that
railway users feel uneasy when stopping over. (101
persons, from 10’s to 60’s) The result is shown in
Figure.1. “I feel it uneasy whether it is late for the
destination.” “I feel it uneasy whether fare become
comparatively high-priced.” “I feel it uneasy
whether it is an attractive station.” Therefore it is
important to offer at sightseeing tractive information
about intermediate stations for promotion of
stopping over. And we need to offer the proof which
it is not late for arriving at the destination even if
railway users stop over intermediate stations. We
need to offer the information of transfer process
when users stop over.
Figure 1: Web survey (the factor that railway users feel
uneasy when stopping over).
4 THE FEATURE OF THIS
SYSTEM
4.1 Visualizing Railway Transfer
Process with Diagram
In this research, we propose to offer “the time to stay
at the station which the user dropped in” and “the
time the users arrive at the final destination” in order
to visualize railway transfer process. Then we
decided to use the diagram (related figure of
distance and time) used by railway operation
management. We can express the transfer process
for railway users in smartphone screen using railway
diagram. The transfer process with diagram is shown
in Figure 2.
Figure 2: The transfer process with diagram.
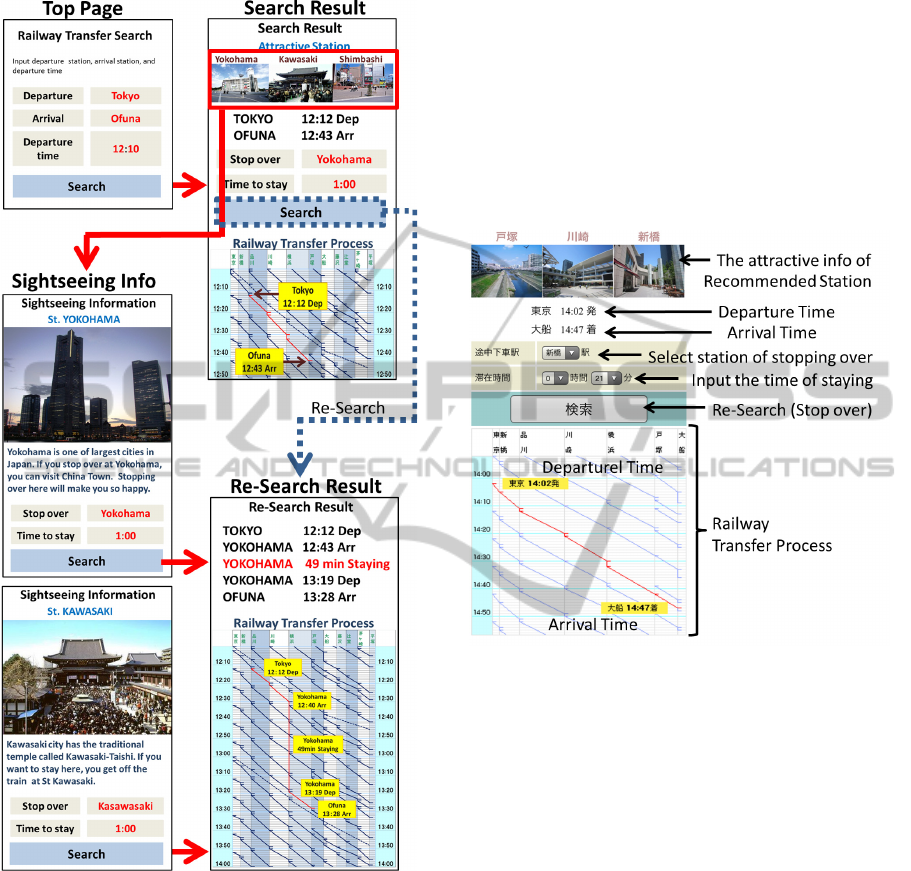
4.2 Visualizing Sightseeing Information
about Intermediate Stations
We consider it important to offer sightseeing
information about intermediate stations which users
can stop over. The present search engine web
services display advertisements related to the
departure station and arrival station which the users
input. Utilizing this technology, we have discussed
the way of visualizing sightseeing information. So
we decided to express the information on the station
between departure station and arrival station when
users search transfer process with mobile phone. The
sightseeing information of recommended station is
displayed according to the station names which users
input on the top page. This idea is shown in Figure 3.
Figure 3: The idea of visualizing sightseeing information
about intermediate stations.
5 THE OUTLINE OF THIS
SYSTEM
We developed the new search engine web service of
a part of Tokaido line (from Tokyo to Odawara).
Tokaido Line is the main railway route which
connects the big city such as Yokohama, Hiratsuka,
and Odawara to Tokyo. As Tokaido line is used by
many people, we developed the system with this line.
The structure of this system is shown in Figure 4.
And the system for Japanese railway users is shown
NEW RAILWAY TRANSFER SEARCH PROPOSAL - The Development of the Interactive Design Tool using the Graph
Visualization of Railway Transfer Process
785
in Figure 5.
Figure 4: The structure of this system.
The railway users input the departure station, the
arrival station and departure time on the screen of a
smartphone. The system shows the information on
the station between departure station and arrival
station. And with attractive station information it
shows the railway transfer process with diagram.
And the users can search the transfer again for
stopping over on the search-result screen. The
system re-creates the diagram including stopover
time. We added the function which users re-search
on the attractive station information screen. This
system is a tool for promotion of stopover by
visualizing the railway transfer process and the
attractive station information.
This system consists of timetable database and
station database. The timetable database consists of
the data of the departure time and the arrival time in
each station. It is distinguished on the weekday and
the holiday. The station database consists of station
names and the distance between stations.
These databases are read by SQL programming.
We enabled the route search and the display of
diagram using PHP programming.
Figure 5: The system for Japanese railway users.
6 DISCUSSION
We got some persons to use this system. Some of the
users answered that it was useful tool if they
understand the meanings and structure of railway
diagram once. And some of them are to enjoy
railway transfer by dropping in lots of stations. We
succeeded in raising the probability of stopping over
using the graph visualization of railway transfer
process.
7 CONCLUSIONS
In this research we succeeded in visualizing railway
transfer process and attract sightseeing station
information on the smartphone as a new interactive
tool. We will add the new information such as
shopping and tourism to this system in order to
attract railway users. Offering the appropriate
IVAPP 2012 - International Conference on Information Visualization Theory and Applications
786

information during taking trains makes it higher the
possibility of stopping over. Not only development
of railway service but it is necessary for us to offer
the information and advertising for the purpose of
railway promotion. We will propose new interactive
tool for railway users.
REFERENCES
Shintaro T, Adusa S, Shoichi G., 2010. Users Survey of
Web-based Trip Planner for Railway Route. The
Japan Society of Mechanical Engineers.
Tatsuhiko U, Toru N, Takeshi N, Mitsuo K., 2002.
Notation method of Station Symbol on Railway Maps.
Japanese Society for the Science of Design
Yuzo O, Kenta C, Naoki I, Hisao S, Masanori H., 2010.
Implementation and Evaluation of Transfer Guide
Application based on Human Context Recognizer.
Forum on Information Technology
Maruthappan S, Pourang I., 2008. The Effect of Animated
Transitions in Zooming Interfaces. Proceedings of the
Working conference on Advanced Visual Interfaces.
Topi H., 2006. A Mobile Multimodal Dialogue System for
Public. Proceedings of the 8th Conference on Human-
Computer Interaction with Mobile Devices and
Se
rvices.
NEW RAILWAY TRANSFER SEARCH PROPOSAL - The Development of the Interactive Design Tool using the Graph
Visualization of Railway Transfer Process
787
