
VIRTUAL INSTRUMENTATION APPLIED TO MONITORING
A SENSOR PLATFORM
Virtual Instrumentation based on Computer Supported Education
Manuella Martins Nascimento, Romulo Afonso Luna Vianna de Omena, Jaidilson Jó da Silva,
Angelo Perkusich and José Sérgio da Rocha Neto
Department of Electrical Engineering, Federal University of Campina Grande, Campina Grande, Brazil
Keywords: Virtual Instrumentation, Monitoring, Sensor Platform, Labview.
Abstract: A virtual instrument is a system formed by a computer and an equipment of measurement or command
which uses a program executed in the computer. The real equipment is accessible to the operator by the
graphic interface of the employed software. The monitoring of sensors in the test platform uses a HMI
(Human Machine Interface) developed in the software LabVIEW. The experimental tests with sensor
platform allow the students perform experiments on-line for monitoring the observed signal in the output
sensors.
1 INTRODUCTION
Virtual Engineering is a word used to mean the way
of accomplishing projects, tests and simulations in
engineering. This paradigm has two great
components: virtual instrumentation and computer
simulation. The first one refers to the use of the
computer to amplify the instruments functional
capacity, while the second one corresponds to the
use of computer to simulate the behavior of
processes, systems, devices, means and materials
.
Now, one can tell about virtual instrumentation
by sending real data in real time to a simulated
model, which processes these data and sends them to
the physical system via adequate interfaces, signals
and effects. Thus, a virtual instrument is a system
formed by a computer and an equipment of
measurement or command which uses a program
executed in the computer. The real equipment is
accessible to the operator by the graphic interface of
the employed software (Adam, Rosow and Karselis,
1996).
Actually, the keys on the virtual instrument
screen do not always correspond to the real control
of the instrument connected with the computer, in
other words, the computer amplifies the functions of
the instrument connected with the computer, by
adding new characteristics in the measures provided
by the instrument (Bhaskar, Pecol and Beug, 1986).
2 MATERIALS AND METHODS
The software used to produce the virtual
instrumentation was the LabVIEW, which, based
upon the data flux, utilizes the program wherein the
data flux determines the execution. This software is
very functional because the user’s interface or
frontal panel is very much like the conceptual
interface that a real instrument would show to the
user. So, it not only facilitates the students’
comprehension, as the inclusion of them in work to
develop interfaces. Furthermore, the LabVIEW
possesses other advantages such as: being
thoroughly integrated to communicate with
hardware, counting upon resources to connect its
applications to the Internet via LabVIEW Web
Server and applicative such as ActiveX and TCP/IP
networks (Ertugrul, N., 2002).
The LabVIEW programs are called virtual
instruments (VIs - Virtual Instruments). The VIs
have three main components: the frontal panel, the
block diagram and the panel of icons and
connectors, wherein the frontal panel is the interface
with the user, the icons diagram contains the code
that controls the frontal panel objects and the panel
of icons and connectors that modularize the diagram,
so as to allow the use of the VI in another VI.
The LabVIEW comes with a set of VIs that
allows data configuration and acquisition, as well as
423
Martins Nascimento M., Afonso Luna Vianna de Omena R., Jó da Silva J., Perkusich A. and Sérgio da Rocha Neto J..
VIRTUAL INSTRUMENTATION APPLIED TO MONITORING A SENSOR PLATFORM - Virtual Instrumentation based on Computer Supported
Education.
DOI: 10.5220/0003919004230426
In Proceedings of the 4th International Conference on Computer Supported Education (CSEDU-2012), pages 423-426
ISBN: 978-989-8565-07-5
Copyright
c
2012 SCITEPRESS (Science and Technology Publications, Lda.)

the sending of data to DAQ (Data Acquisition)
devices. The main task of a DAQ system is
to
measure and to generate real physical signals, it
means that the data acquisition system finality is to
gather information from the real world in order to
generate data that can be manipulated in a computer
or micro-processed system. So, the platform of
experiments is composed of several sensors and
actuators to convert the physical signal into an
electric signal, such as voltage or electric current,
which can be monitored and controlled via the data
acquisition board.
Besides all these advantages, to facilitate the
study of experiments, increase the iteration of
the student with the teacher and the learning,
LabVIEW allows experiments to be accessed
remotely. Thus, a site was created, and to have
access to the experiments, LabVIEW must be
configured as a server, and the student must have
the software installed on the machine, thus
performing the monitoring.
For the proposed work, we utilized the National
Instruments data acquisition system, the NI-USB
6210 (National Instruments, 2007), which is
connected with the computer via USB (Universal
Serial Bus) inputs. The NI-USB 6210 possesses 16
analogical inputs, 4 digital inputs, 4 digital outputs,
two 32-bits controllers/temporizers and a frequency
generator.
3 EXPERIMENTS
The experiments are presented in this section
describing the greatness of each one, as regards the
sensor and the actuator being employed; to describe
the experiment itself; to show the electronic circuit
used; to expose the block diagram and the interface
created in the LabVIEW.
3.1 Experiment 1: Strain Gauge
Use the Strain-Gauge to measure the deformation of
an aluminum bar, caused by the placing of weights
on its edge.
3.1.1 Strain-Gauge
The electric resistance extension-meter, also known
as strain gauge, is a small frame made of thin
metallic blades that can be glued to the surface of a
component or structure to measure its deformations.
The thin layer of sticking-plaster used serves to
transmit the structure deformations to the strain
gauge, also serving as isolation between the two.
This instrument changes little structure dimension
variations into equivalent variations of its electric
resistance, so being considered like a transducer
(Fraden, 1993).
Extension-meters are used in the experimental
analyses of deformations in machines, bridges,
locomotives, vessels and in the construction of
transducers of strength, tension, pressure, flux,
acceleration, among others.
The representation of the Strain-Gauge Platform
of Experiments, in block diagram, is shown in
Figure 1.
This platform contains an aluminum bar,
horizontally fixed by a support. Two identical
extension-meters are stick-plastered to the bar, with
one on the upper part and the other on the lower one.
Figure 1: Blocks Diagram of Strain-Gauge Platform.
To measure the deformation caused by a force on
the bar, the extension-meters are connected to a
Wheatstone bridge, as shown in Figure 2. The bridge
is completed with two pressure resistors with equal
resistance. This configuration is called “½ bridge”
because there are two active elements (extension-
meters). Other configurations used are the “¼
bridge” and the “full bridge”, with one and four
active elements, respectively.
Figure 2: Electric diagram of Wheatstone bridge with two
extension-meters.
The way how the extension-meters are
positioned on the bar allow them to undergo
opposite deformations. Therefore, the resistances
will suffer the same alterations, further to
minimizing the effects of temperature, as the
temperature variations will be made sensitive by the
resistive frames of the extension-meters. Thus, are
presented the equations (1 - 4):
CSEDU2012-4thInternationalConferenceonComputerSupportedEducation
424
R1 = R2 = RG (1)
R3 = RG + ∆R (2)
R4 = RG - ∆R (3)
∆R = KℰRG
(4)
Wherein K is a Constant that depends on the
alloy used in the confection of the extension-meter
and ε is the deformation. To accomplish the
measurements, the bridge is excited with a
continuous V
EX
voltage and the V
o
voltage must be
void when the bridge is in balance, i. e., when the
bar is exempted from deformation. The deformation
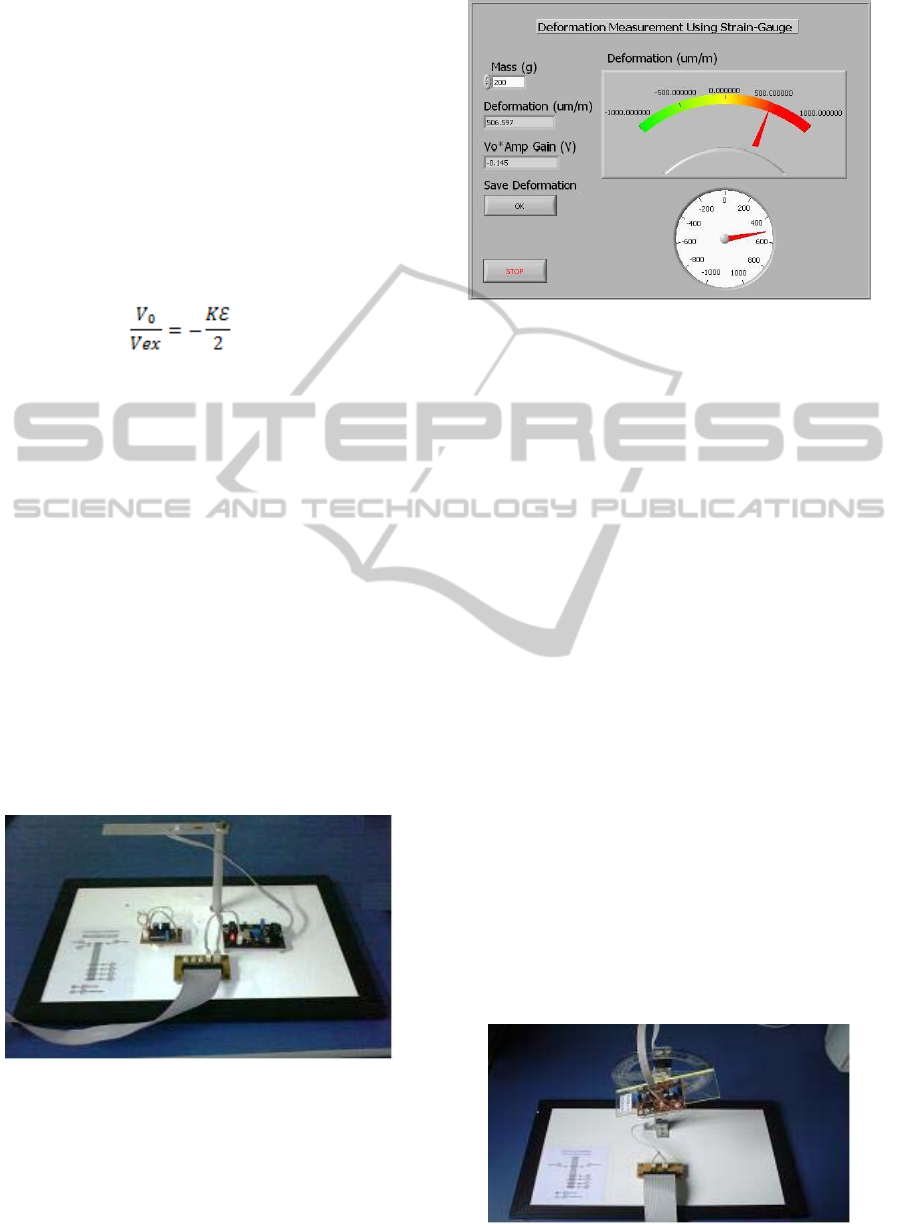
is then found throughout the following equation (5):
(5)
The value of the V
o
voltage is very small in
relationship with the bridge excitation voltage.
However, the applications with extension-meters
require an amplification to increase the output level
of voltage, and this, on its turn, will increase the
reading resolution and will improve the signal-noise
relation. After the measurement, the value is divided
by the gain so as to obtain the real deformation
value.
3.1.2 Platform and Interface
The experiment is accomplished by means of the
platform of experiments shown in Figure 3. It is
connected with the data acquisition platform
throughout a flat cable. Furthermore, a program was
developed in the LabVIEW and its interface is
shown in Figure 4. This is how the deformation
measurement is achieved.
Figure 3: The Strain-Gauge Experiment Platform.
In the hole shown on the edge of the bar, some
determined masses must be placed with a piece of
wire. For the smaller masses, the wire must be very
thin, so that its mass may not influence in the
measurements. Then, if we put the desired masses
on the bar, we click on “record deformation” and the
Figure 4: Interface in the LabVIEW to measure the
deformation.
deformation caused by mass on the bar will be
given.
3.2 Experiment 2: Accelerometer
In this experiment, our objective is to characterize
the ADXL 202 accelerometer throughout its
mathematical model, and the use of the LabVIEW
for acquisition of the experiment data.
3.2.1 Accelerometer
The platform of this experiment, shown in Figure 5,
is composed of the ADXL 202 sensor accelerometer
(Mohn-Yasin, Korman, and Nagel, 2003), a metallic
basis where a 180° protractor is fixed. On the same
metallic basis, a plate - where the accelerometer is
also placed - is fixed in a way to let it in a 0°
reference level; this plate also carries the signal
conditioning circuit. The platform still contains an
interface with the data acquisition platform,
consisting of a plate with 34 pins, wherein the
measurement points are found (point 11; axis X and
point 12; axis Y). The interconnection with the
platforms is made by a flat cable.
The representation of the accelerometer Platform
of Experiments – in block diagrams – is shown in
Figure 6.
Figure 5: Photo of the Accelerometer Platform.
VIRTUALINSTRUMENTATIONAPPLIEDTOMONITORINGASENSORPLATFORM-VirtualInstrumentation
basedonComputerSupportedEducation
425
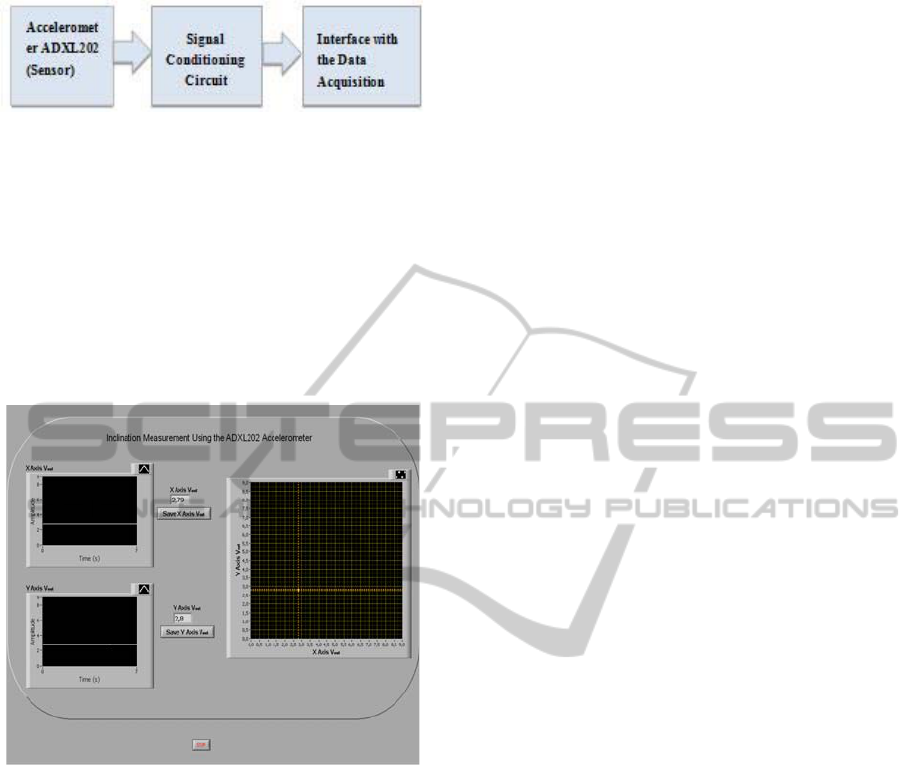
Figure 6: Blocks Diagram of Accelerometer Platform.
3.2.2 Interface
Using the experimental platform constructed in the
LabVIEW, we managed to measure the voltage
referring to a level of inclination. First of all, we
must adjust the values of voltage referring to each
sensor axis (accelerometer), so, as to show a point
on the screen of the created interface (XY Graph), as
can be seen in Figure 7.
Figure 7: Interface created in the LabVIEW to measure
inclination.
4 CONCLUSIONS
The experiments gave us expertise in various fields,
such as analog and digital electronics. We could also
see how important is the development of interfaces
using LabVIEW, which is a simple software, and,
eventually use it in others applications.
The discussed experiments attempted to transmit
to the students the concepts involved in this paper
using the computer as a main tool for performing
and analyzing experiments.
Also, the flexibility of iteration between student
and teacher provided by technology tools establishes
a new dynamic of teaching. The students can better
organize your questions on the subject under study
and they have the initiative to find their answers.
ACKNOWLEDGEMENTS
The authors would like to thank to CNPq for
financial support and everyone from the LIEC
(Electronic Instrumentation and Control Laboratory)
who supported the development of this work.
REFERENCES
Adam, J. S., Rosow, E., and Karselis T., 1996.
"Educational Applications Using Computerized
Virtual Instrumentation", Presented at the Association
for the Advancement of Medical Instrumentation in
Philadelphia, PA, June.
Bhaskar, K. S., Pecol, J. K., and Beug, J. L., 1986.
"Virtual instruments: objectoriented program
synthesis", Conference proceedings on Object-
oriented programming systems, languages and
applications, ACM Press, New York, NY, USA, pp.
303-314.
Ertugrul, N., 2002. LabVIEW for Electric Circuits,
Machines, Drives, and Laboratories, Prentice Hall
PTR.
Fraden J., 1993. “AIP handbook of modern sensors:
physics, designs and applications”, AIP, New York.
Mohn-Yasin, F., Korman, C. E. and Nagel, D. J., 2003.
Measurement of noise characteristics of MEMS
accelerometers. Solid-State Electronics v. 47, pp. 357-
360.
National Instruments, 2007, NI USB-621x User Manual.
National Instruments, 2011. NI LabVIEW Web Site, http:
//ni.com/info.
Perry, C. C. and Lissner, H. R., 1962. THE STRAIN
GAGE PRIMER. McGraw-Hill, Inc., New York.
CSEDU2012-4thInternationalConferenceonComputerSupportedEducation
426
