
A LIGHT-WEIGHT SEMANTIC INTERPRETATION
MECHANISM FOR A SKETCH-BASED LEARNING
ENVIRONMENT
Stefan Weinbrenner, Jan Engler, Pouyan Fotouhi-Tehrani and H. Ulrich Hoppe
University of Duisburg-Essen, Department of Computer Science and Applied Cognitive Science
Duisburg, Germany
Keywords: Sketch Interpretation, Architectures for Learning Environments, Intelligent Tutoring Systems.
Abstract: Free-hand drawing of diagrams or sketches is a natural form of expression that is very useful in learning
scenarios. It is easily supported by tablets or tablet PCs. Often such sketches are the basis of reasoning
processes, also in collaborative scenarios. They can also indicate misconceptions. Therefore it is desirable to
support a semantic interpretation of sketches in a way that could be easily combined with other parts of a
learning environment or with an ITS. Our solution introduces a multi-agent architecture based on the
blackboard paradigm. Inspired by the CogSketch system, it supports the introduction of user-defined
"glyphs" as external representations of concepts, it provides a set of basic geometrical/topological primitives
and allows for the addition of more domain-specific semantic relations.
1 INTRODUCTION
Visualization is an important means to aid the
learning process. Describing procedures, objects,
relations etc. can be done more easily and more
intuitively using visual aids. Research results
suggest that over 80% of information enters the
brain through the eyes (Petty, 2004). However, this
should not imply that words are less important. The
key point lies in combining words and pictures to
generate powerful messages (Lester, 2006).
To a large extent, efforts in the area of advanced
visualization techniques for learning address the
learner as a passive recipient. Sketching however
can be an active means of expression and
externalization in the hands of the learners
themselves. Sketching has some characteristics that
distinguish it from other visualization methods:
Everyone can sketch, i.e. there is no need for
preliminary skills. Sketching is natural, i.e. no need
for more than a (digital) pen, and sketching allows
for imperfection, i.e. additional communication can
fill lack of presented information.
An imperfect sketch, e.g. a bike with rectangle
tires, would still be understandable by the observer,
if it is explained so by the subject. However, this
natural vagueness and imprecision of sketches,
makes an automatic interpretation very hard. The
main challenges in such an algorithmic approach of
interpreting sketches would be to discover the
components that the sketch is composed of and what
these components of the sketch actually mean. In
other words, the interpretation can be separated into
segmentation and recognition.
Such an automatic interpretation can be used for
similar purposes that usually need a human beholder
that interprets the sketch. When drawing sketches in
school classes, the teacher often has to judge
whether a sketch is correct or shows some
misconceptions of the learner. In the latter case, a
teacher would give the learner hints, which concepts
were misunderstood. In this case, after the
interpretation the teacher assesses the sketch using
his or her knowledge about the corresponding
domain and gives feedback to the learner.
A system designed to interpret sketches and to
help the learner in a similar way has to encompass
automatic solutions to the tasks of segmentation,
recognition, assessment and feedback generation.
The work presented in this paper aims at
implementing supportive mechanisms capable of
interpreting learner sketches by examining spatial
relations between their components and giving
appropriate domain-dependent feedback.
42
Weinbrenner S., Engler J., Fotouhi-Tehrani P. and Hoppe H..
A LIGHT-WEIGHT SEMANTIC INTERPRETATION MECHANISM FOR A SKETCH-BASED LEARNING ENVIRONMENT.
DOI: 10.5220/0003919400420047
In Proceedings of the 4th International Conference on Computer Supported Education (CSEDU-2012), pages 42-47
ISBN: 978-989-8565-06-8
Copyright
c
2012 SCITEPRESS (Science and Technology Publications, Lda.)

One can imagine scenarios, for which such a
system can be utilized: in all subjects, where abstract
or concrete concepts are thought using visual aids,
this tutor can be used. It allows individuals to
examine their acquired knowledge without directly
being relied on the teacher. It may be part of an
intelligent tutoring environment, which would
include additional learner and domain modeling.
Our work has been inspired by CogSketch
(Forbus et al., 2008), a sketching and sketch
interpretation environment that uses a large
universal ontology (OpenCyc) for semantic
interpretation. On the surface level, the user
introduces sketches called “glyphs”. These glyphs
are mapped to semantic concepts “by hand”. By
combining glyphs it is possible to visually represent
statements such as “the DNA (a glyph) is inside the
nucleus (another glyph)”. The derivation of such a
statement does not require the ontology but is based
on an analysis of geometrical relations of the sketch
elements. The ontology, in turn, is used to check the
semantic validity of such statements and to allow for
further inferences. CogSketch does not use pattern
recognition for identifying glyphs. They are only
interpreted in the way explicitly declared by the
user. In our work we have re-constructed the
CogSketch with a different focus.
Our system is not a monolithic architecture for
one standalone application, but we extended an
already existing, powerful collaborative modeling
environment and connected it to a loosely coupled
blackboard architecture that integrates the key
components as agents in a flexible and modular way.
The blackboard architecture also allows for sharing
glyphs among students and together with the
existing synchronization features of the modeling
environment additionally stresses the collaborative
approach of our work. Moreover, we do not use a
“heavy” external ontology that covers lots of
different domains, but use a “light-weight” approach
that is very specific for the domain. Currently we
also use an ontology for storing the domain-specific
knowledge, but due to its modularity an adaptation
of the system to interpret other representations (e.g.
simple csv files) would be very simple.
Be advised that papers in a technically unsuitable
form will be returned for retyping. After returned the
manuscript must be appropriately modified.
2 SCENARIO
Alice and Bob are students of a geography class that
deals with the problems of planning and designing
the layout of modern cities. After getting
familiarized with the fundamentals of Urban Design,
the students are asked to design a city on an island,
considering the following rules and constraints:
The city is divided into three areas: at least one
industrial area that consists of factories, one
commercial area, where shops and business centers
are located, and a residential area, where the
inhabitants live.
The city must have a waste treatment and
disposal facility on the island, which is not near
aforementioned areas.
The island’s port has to be located on the western
coast of the island. To save costs for transportation,
the industrial area has to be situated in the vicinity of
the island’s port.
The commercial area must be somewhere within
the residential area.
Figure 1: List of proposed concepts.
Other details are considered irrelevant and
students are allowed to add other components (such
as tourist attractions, infrastructural facilities etc.) as
long as aforementioned rules are not broken. In the
course of this exercise students are allowed to draw
in any arbitrary shape for the areas and facilities.
Moreover, there is no unique design for this city;
rather there are many different designs, which
conform to the rules and are all equally correct. To
fulfill the task, the students have tablet PCs that run
a sketching program.
Alice starts to draw the island and all required
areas and facilities with the sketching tool. For each
component of the sketching she uses a different
color and groups them by a grouping mechanism of
the sketching tool. When finishing the component,
the tool asks her for a name and presents a list of
proposed labels such as “Island”, “Port”,
“Residential Area”, etc. (c.f. Figure 1). After a
while, Alice’s sketch is finished and it looks like
Figure 2. She clicks on a button labeled “Check
Sketch” and after some seconds a dialog box pops
up in the sketching tools and shows the message
“Congratulations! Your sketch complies with the
constraint of the assignment.”
ALIGHT-WEIGHTSEMANTICINTERPRETATIONMECHANISMFORASKETCH-BASEDLEARNING
ENVIRONMENT
43

Bob also adds one component after the other to
his sketch and labels it according to the proposed
labels. However, when he hits the button “Check
Sketch”, the message tells him to check the location
of the industrial area. He reflects on his sketch and
reads the assignment again. After that, he notices
that the industrial area within his sketch is not near
the port, so he moves it closer to it. Then, he again
runs the check and now he also gets the message that
his sketch complies with the assignment.
Figure 2: Example sketch of an urban design.
3 APPROACH
As described in section 1, the overall process that is
supported by the sketch interpretation system can be
separated into the four tasks of segmentation,
recognition, assessment and feedback generation.
In the work presented here, the first two tasks are
in fact done by the learner, which has several
reasons. First, automatically discovering segments
and semantically analyzing them is difficult and
error-prone. Even a teacher sometimes misinterprets
the sketch of a learner and such an error results in
wrong assessment and feedback (both false-positive
and false-negative). The only person, who can define
segments and explain the semantics of a sketch for
sure, is the person that produced it. Additionally,
from a pedagogical perspective, this encourages the
learner to reflect on his sketch and its components.
In our case, the environment differentiated
between strokes and glyphs. As the most basic entity
in sketching, a stroke is an arbitrary number of
connected points that the user has drawn at once. In
most sketching environments a stroke also has a
width (in pixels) and a color, but these properties are
not relevant for the purpose of this work. A glyph is
a collection of strokes that also has a label attached
to it. In Figure 2 the different glyphs are all drawn in
different colors, but that is not necessarily the case
and was done here just for clarity reasons.
The recognition is done by labeling the glyphs.
The learner can enter arbitrary texts, but he is
encouraged to choose labels that are known to the
system by displaying a list of labels, that shows
already used ones in green (c.f. Figure 1).
The next part of the recognition comprises the
spatial relationship between the segments or glyphs,
because often it is not sufficient to just know what is
presented in a picture, but also where it is located.
This discovery of spatial relations is the first part,
that is done automatically by the system. Spatial
relations can be generally categorized in three of
topological, orientation (or directional), and metric
relations (Beaubouef and Petry, 2010):
Topological are those relations which are
invariant under topological transformations, i.e.,
translation, scaling and rotation (Egenhofer, 1989),
e.g. disjoint, surrounded.
Orientational are those relations which describe
the position of objects in relation to each other
(Hernández, 1994), e.g., left, under.
Metrical are those relations, which are based
upon distance of two objects, e.g. near, far.
The definition of spatial relations, in spite of
seeming to be self-evident, presupposes some
clarification. (Freeman, 1975) pinpoints various
complexities in course of defining spatial relations.
One problem, for example is to establish borders
implied by a given word: where does being left start
and where does it end. We calculate a value for each
glyph pair and for each supported relation and then a
threshold is introduced, which is used for decision
making procedures. The supported relations are
surrounded (topological), left, right, bottom, top
(orientational) and near (metrical).
As soon as the spatial relations are known and
the labels of the glyphs match pre-defined concepts,
the system has finished the recognition and will start
to assess the sketch. Since this process needs
domain-specific knowledge about sketches, the
necessary information is encoded in an ontology.
This holds all the labels and spatial relations of the
concepts of the given assignment. The ontology is
rather simple and consists of the two classes “Scene”
and “Spatial Entity” and supports all spatial relations
as object properties of “Spatial Entity”. A scene
represents the domain of an assignment and has
“belongsTo” relations to all spatial entities that
occur in this domain. A graphical example of an
ontology that expresses the knowledge about our
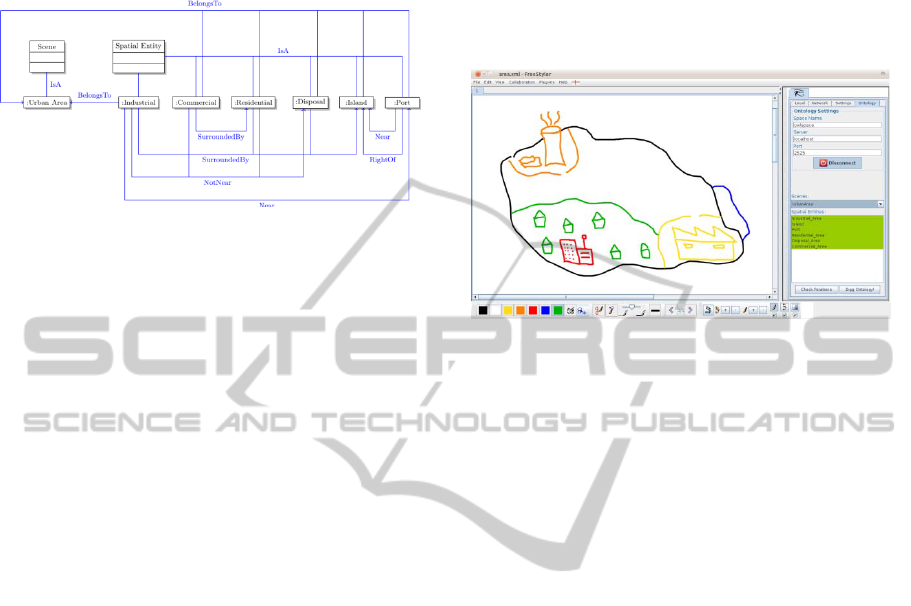
scenario assignment can be seen in Figure 3.
After comparing the relations among the
learner’s glyphs and the expected relations in the
ontology, the system can tell the learner exactly,
which glyph is missing and which pair of glyphs is
CSEDU2012-4thInternationalConferenceonComputerSupportedEducation
44
not located in the correct spatial relation. This is
displayed in the sketching environment so that the
learner can act accordingly and rethink his sketch.
Figure 3: Graphical representation of the scenario’s
ontology.
4 IMPLEMENTATION
Our sketching tool has been implemented as an
extension of the collaborative modeling environment
FreeStyler (Hoppe and Gassner, 2002). In order to
support the envisioned scenario, it was extended
such a way that multiple strokes could be labeled
and grouped to glyphs. Now, after clicking on the
“Start Glyph” button, the glyph mode is activated
and all following strokes are grouped. After clicking
again this button, the user is asked for the name of
the just finished glyph. The overall user interface
(i.e., FreeStyler using the glyph mode and our sketch
interpretation plug-in) can be seen in Figure 4.
The actual sketch interpretation has been
implemented as a separate component (or agent) of a
distributed system that uses the black board
approach (Erman et al., 1980). In this case a
FreeStyler plug-in has been developed that acts as
one client among several others. In a blackboard
architecture, all participating nodes only
communicate via the blackboard, which is a central
place for storing and reading information. The main
advantage of a blackboard system is its inherent
flexibility and robustness due to the loosely coupled
design. Since the components only have minimal
knowledge of the others a failure of one component
will not directly affect the functioning of another.
Such an architecture is naturally also more flexible,
because a new agent with new features can be easily
integrated, often without other agents being
modified.
To implement such a blackboard system, we
chose to use TupleSpaces (Gelernter, 1985). In a
TupleSpace system there is one central server and
several clients, that only send messages to the
server. These messages are in tuple structure, i.e.
they consist of lists of typed data. As an
implementation of the TupleSpaces idea we chose
the SQLSpaces (Weinbrenner et al., 2007), since
they offer a rich feature set and are multi-lingual and
can therefore be used as a language switchboard
(Bollen et al., 2008).
Figure 4: FreeStyler with the sketch interpretation plug-in.
The functionality of our semantic sketch
interpretation system is encapsulated in two agents
that are implemented in SWI Prolog and make use of
the tspl interface that allows accessing an
SQLSpaces server from Prolog clients. This is
particularly interesting for tasks that are more
naturally implemented using a specific programming
language. In our case it makes sense to implement
the relation checking and the ontology checking
facility in Prolog because of its backtracking and
logical problem-solving features in comparison to
object-oriented languages like Java.
All in all, there are three components in our
black board system, which communicate over two
different subspaces. The overall architecture can be
seen in Figure 5.
The first space Ψ contains all glyphs and is
therefore connected to the FreeStyler plug-in.
However, this plug-in does not only write glyphs
into the space, but is also able to import glyphs back
to the frontend. That way it is possible to exchange
glyphs among learners and therefore to work
collaboratively on assignments. The next agent that
uses the glyph data is the relation inspector that
works on the coordinates of the glyphs and adds the
inter-glyph relations to the space. To determine the
relations, the relation inspector uses algorithms for
each relation category (c.f. section 3) that all result
in a normalized value between 0 and 1.
Unfortunately, there are several intuitive
understandings of the “left-ness” or “surrounded-
ness” of two glyphs, but in the end our brief
definition is the following:
ALIGHT-WEIGHTSEMANTICINTERPRETATIONMECHANISMFORASKETCH-BASEDLEARNING
ENVIRONMENT
45

Figure 5: Overall interaction and data flow between the
components.
• To determine if glyph A is left of glyph B, the
ratio of ratio of points of glyph A that are left of the
left-most point of glyph B to the amount of points of
glyph B. Other orientational relations are calculated
accordingly.
• To determine the extent to which glyph A is
surrounded by glyph B, we calculate how many
circular rays (360 rays, each arc degree one ray)
from the centroid of A hit B. This is an adaptation of
the visual surroundedness by (Rosenfeld and Klette,
1985).
• The calculation of the nearness of glyph A to
glyph B is more complicated. If the minimal
distance between A and B minA,B is greater than
the diagonal dB of the bounding box of B, the
nearness is 0. Otherwise, the nearness is (dB-
minA,B)/dB.
The third and last component is the ontology
inspector that first retrieves the glyphs and their
relations and maps them to concepts from the
ontology. These concepts are stored in the space Ω
and are used to validate the glyph relations
according to the assignment. In the case that a
learner created a sketch that does not comply to the
constraints of the assignment, the ontology inspector
notifies the FreeStyler plug-in about the problems
and FreeStyler shows a dialog to inform the learner.
If the sketch does comply with all constraints, just a
confirmative message is displayed to the learner.
The ontology inspector also is the instance that
transfers the numerical results of the relation
inspector to the boolean world of the ontology. This
needs obviously to be done here, since the ontology
either contains a relation or not. This transfer is done
by applying a threshold to the numerical value.
Currently, a value above 0.8 is interpreted as a
confirmed relation, otherwise there is not enough
evidence for the relation.
Finally, FreeStyler also reads the concepts from
the space Ω in order to propose meaningful glyph
names as shown in Figure 1.
5 CONCLUSIONS AND FUTURE
WORK
This paper describes a semantic sketch interpretation
system. The implemented framework allows for
checking for accordance between a sketch and its
corresponding conceptual definition and to provide
feedback. The conceptual definition represents a
scene using spatial relations between spatial entities.
Various tools have been utilized to realize this work:
SQLSpaces is used as a middleware to connect the
different components of the system in a loosely
coupled way and to persist the sketches and their
corresponding conceptual definitions to allow
sharing of these artifacts. FreeStyler collects user
input as glyphs and serializes them in tuples in the
SQLSpaces server. Agents that have been realized in
Prolog are notified by signal tuples and are
responsible for a specific task. Two agents have
been implemented: The Relation Inspector, which
computes several spatial relations between spatial
entities (glyphs) of a sketched scene, and the
Ontology Inspector, which uses the outputs of the
Relation Inspector and the ontological scene
description to check a sketch against its
corresponding conceptual definition. The Ontology
Inspector also provides feedback if necessary.
The framework can be used in learning facilities,
from schools to universities, as an aid for teachers
and students. From the simplest subjects, such as
cardinal directions, to more complicated subjects,
such as anatomy of the human heart, this framework
can help individuals to strengthen their knowledge
and understanding. It can be utilized in teaching of
nearly all subjects, which are taught using visual
aids and sketches.
However, this system is still under development
and there are a great number of features and
functionalities, which can improve this framework.
One interesting extension of this work would be
to turn FreeStyler into an authoring environment,
which makes it possible for the user to directly
export the conceptual definition of his sketches to a
knowledge base (in this case an ontology). An
interesting starting point for this is a visualization
utility that was actually only implemented as a
debugging tool during the development. This tool
displays the results of the Relation Inspector agent,
i.e. for all relations between all glyph pairs it will
display a value between 0 % and 100 %. This
visualization can be seen in Figure 6 (here only the
surrounds relation is shown, otherwise the list would
be too long).
CSEDU2012-4thInternationalConferenceonComputerSupportedEducation
46
Figure 6: Visualization of the results of the Relation
Inspector.
A possible workflow for an assignment author
would be to draw a reference “expert sketch”
without any ontology or agent support. This set of
labeled glyphs could then first be inserted as
unconnected instances into the ontology. After that
the Relation Inspector agent could propose some
relations that are found between the given glyphs for
adding it to the ontology representation. However,
the author would presumably not transfer all these
relations to the ontology, since though many of them
are evident, only some are probably necessary for
the assignment. In the example of Figure 2 for
instance, it would not be necessary to have the waste
disposal facility in the north of the residential area.
After importing these relations, the FreeStyler plug-
in for students could immediately interpret this
newly defined assignment.
Such an authoring environment would be a
bridge from a static, predefined knowledge base to a
dynamic one. An authoring environment would also
allow the user to modify already existing
conceptualizations in the knowledge base. That
means, adding, removing or updating spatial entities
and spatial relations among them.
Beside these technical improvements a study
could be conducted to investigate on the effect that
this tutoring system has on the learning process of
users. This study could compare students’ solution
without the tutoring system and solutions that make
use of the system in order to find out whether the
usage of the system will lead to solutions that are
fulfilling more restrictions of the assignment. As the
system allows for sharing the glyphs between
different users, the study could also investigate on
advantages of a collaborative creation of glyphs.
Another interesting question is the comparison
between pen and paper based modeling and the
usage of the presented system on tablet computers
which could focus on usability issues of the system
when using tablet computers.
REFERENCES
Beaubouef, T. and Petry, F., (2010). Fuzzy and rough set
approaches for uncertainty in spatial data. In R.
Jeansoulin, O. Papini, H. Prade, and S. Schockaert,
(Ed.), Methods for Handling Imperfect Spatial
Information (Vol. 256 of Studies in Fuzziness and Soft
Computing, pp. 103-129). Berlin / Heidelberg:
Springer.
Bollen, L., Giemza, A. and Hoppe, H. U., (2008). Flexible
analysis of user actions in heterogeneous distributed
learning environments. In Proc. of the European
Conference on Technology Enhanced Learning 2008
(EC-TEL 2008), Maastrich, NL.
Egenhofer, M., (1989). A formal definition of binary
topological relationships. In W. Litwin and H.-J.
Schek, (Ed.), Foundations of Data Organization and
Algorithms (Vol. 367 of Lecture Notes in Computer
Science, pp. 457-472). Berlin / Heidelberg: Springer.
Erman, L. D., Hayes-Roth, F., Lesser, V. R. and Reddy, D.
R., (1980). The Hearsay-II speech understanding
system: integrating knowledge to resolve uncertainty.
In ACM Comput. Surv. (Vol. 12(2), pp. 213-253.)
Forbus, K., Usher, J., Lovett, A., Lockwood, K. and
Wetzel, J., (2008). CogSketch: Open-domain sketch
understanding for cognitive science research and for
education. In Eurographics Workshop on Sketch-
Based Interfaces and Modeling, Annecy, France.
Freeman, J., (1975). The modelling of spatial relations. In
Computer Graphics and Image Processing (Vol. 4(2):
pp. 156-171, ISSN 0146-664X. doi:10.1016/S0146-
664X(75)80007-4.)
Gelernter, D., (1985). Generative communication in linda.
In ACM Transactions on Programming Languages
and Systems (Vol. 7, pp. 80-112).
Hernández, D., (1994). Qualitative representation of
spatial knowledge. New York: Springer-Verlag.
Hoppe, H. U. and Gassner, K., (2002). Integrating
collaborative concept mapping tools with group
memory and retrieval functions. In Proc. of the Int.
Conference on Computer Supported Collaborative
Learning, Hillsdale (USA): Lawrence Erlbaum.
Lester, P., (2006). Visual communication: images with
messages. Thomson Wadsworth.
Petty, G., (2004). Teaching today: a practical guide.
Nelson Thornes.
Rosenfeld, A. and Klette R., (1985). Degree of adjacency
or surroundedness. In Pattern Recognition (Vol. 18(2),
pp. 169-177, ISSN 0031-3203. doi: doi:
10.1016/0031-3203(85)90041-X).
Weinbrenner, S., Giemza, A. and Hoppe, H. U., (2007).
Engineering heterogeneous distributed learning
environments using tuple spaces as an architectural
platform. In Proc. of the 7th IEEE Int.Conference on
Advanced Learning Technologies ICALT 2007 (pp.
434-436, doi: 10.1109/ICALT.2007.139).
ALIGHT-WEIGHTSEMANTICINTERPRETATIONMECHANISMFORASKETCH-BASEDLEARNING
ENVIRONMENT
47
