
VISUALIZATION OF OBJECT-ORIENTED (JAVA) PROGRAMS
Cornelis Huizing
1
, Ruurd Kuiper
1
, Christian Luijten
2
and Vincent Vandalon
1
1
Eindhoven University of Technology, PO Box 513, Eindhoven, The Netherlands
2
Oc
´
e Research & Development, PO Box 101, Venlo, The Netherlands
Keywords:
Object-oriented Programming, Program Visualization.
Abstract:
We provide an explicit, consistent, execution model for OO programs, specifically Java, together with a tool
that visualizes the model This equips the student with a model to think and communicate about OO programs.
Especially for an e-learning situation this is significant. Firstly, such a model supports the interaction with
teachers and provides a sound basis for the understanding of other e-learning material concerning program-
ming. Secondly, the tool supports acquiring proficiency with the model in an e-learning setting by giving
precise information to hone his/her conceptualization of program execution. The model is advanced in that
it accommodates multi-threading. The tool is flexible in that it directly uses the Java Virtual Machine for the
visualization: extensions and adaptations can thus make use of the information the actual execution provides.
A case in point is modeling the execution of code involving user interaction through the Graphic User Interface
library. We consider several options here.
1 INTRODUCTION
Teaching programming has evolved substantially over
the past thirty years, along at least three axes. Firstly,
the languages have progressed from Pascal-like sim-
ple imperative languages that provide structuring
through procedural decomposition to languages that
are based on object-orientation (OO), which provide
powerful additional structuring through object de-
composition and inheritance between classes. Sec-
ondly, the use of library code has increased greatly;
this, for example, makes programming Graphical
User Interfaces (GUI’s) feasible. Thirdly, the role of
programming in the curriculum has changed from be-
ing a typical nuts-and-bolts Computer Science subject
to a more generally appreciated and applied skill that
has a place in the curriculum of many departments.
This calls for new ways of offering tutoring in pro-
gramming. Furthermore, to take advantage of what
OO offers, the demanding concepts of this paradigm
need to be well-understood.
From our experience in teaching programming
(moving from Pascal, via C and C++ to Java) at vary-
ing departments at the Eindhoven University of Tech-
nology (The Netherlands) as well as in industry, we
learned that an explicit conceptual execution model
is indispensable, both for teacher - student commu-
nication as well as for communication between stu-
dents. Indicative for the need for an execution model
is that the paradigm is called object-orientation rather
than class-orientation: thinking about the program is
in terms of the objects that occur during execution
rather than in terms of the classes that occur in the
static code.
Especially for an e-learning situation students
should have an explicit, consistent model to think and
communicate about OO programs. Firstly, such a
model supports the interaction with teachers and pro-
vides a sound basis for the understanding of other
e-learning material concerning programming. Sec-
ondly, the tool supports acquiring proficiency with the
model in an e-learning setting by giving precise infor-
mation to hone his/her conceptualization of program
execution.
In this paper we do not further argue the quite self-
evident need for and use of such a model and tooling
in e-learning, but concentrate on the model and vi-
sualization tool. We have implemented the ideas for
Java, in a tool we named CoffeeDregs (in line with
the Java/coffee association). Model and tool reflect
our experience over the years; the current version is
quite usable, but further evolution is envisaged. Cof-
feeDregs has a clear aim: it is a teaching tool that sup-
ports building a conceptual semantic model. It is not
a debugger, nor does it visualize data or control for
diagnostic purposes as do the tools for professional
65
Huizing C., Kuiper R., Luijten C. and Vandalon V..
VISUALIZATION OF OBJECT-ORIENTED (JAVA) PROGRAMS.
DOI: 10.5220/0003924000650072
In Proceedings of the 4th International Conference on Computer Supported Education (CSEDU-2012), pages 65-72
ISBN: 978-989-8565-06-8
Copyright
c
2012 SCITEPRESS (Science and Technology Publications, Lda.)

programmers.
A key feature of the model is that it is detailed
enough to explain the semantics of the language at
statement level and abstract enough to enable think-
ing about the program at the level of objects. The dis-
tinction as well as the connection between dynamic
execution in objects and static class code is made ex-
plicit. The emphasis is on stepwise modeling the dy-
namics of OO execution, i.e., the objects. Class code
is merely present beside the visualization – model and
tool indicate when and how the class code is involved
in supplying information for the execution.
Another important feature is that execution of a
program on the Java Virtual Machine (JVM) drives
the visualization. This provides a close and direct
connection to the actual execution of the language,
enforcing the semantics to be realistic as well as fa-
cilitating extensions to the model and tool.
In this paper we give an overview of the model
and tool; more detail can be found in (Luijten, 2003)
and (Vandalon, 2010).
There are several approaches related to ours: Je-
liot (Levy et al., 2002), Greenfoot (K
¨
olling, 2010),
BlueJ (K
¨
olling et al., 2003), and JIVE (Gestwicki and
Jayaraman, 2004; Lessa et al., 2010; Lessa and Ja-
yaraman, 2012). Jeliot is more low-level than Cof-
feeDregs, for example showing in detail how expres-
sions are evaluated. This makes Jeliot very well
suited to the initial stages of programming educa-
tion while CoffeeDregs also seeks to support more
advanced concepts. Greenfoot and BlueJ enable to,
visually, interact with instances of classes, but do not
aim for modeling the detailed execution of a program
– Greenfoot is especially well-suited for an informal
explorative introduction. JIVE is most closely com-
parable to our approach. Also JIVE is much more
ambitious in scope and application than CoffeeDregs:
it is a dynamic analysis tool that aims to provide de-
bugging facilities as well as being usable as a teach-
ing tool. The lightweight approach in CoffeeDregs
that restricts itself to “visualizing what happens in-
side the computer”, extended to complex concepts
like user interaction through the Graphical User In-
terface. JIVE offers different, integrated views, for
example using sequence diagrams to capture interac-
tions over a longer time period. A technical differ-
ence is that JIVE is integrated with the IDE Eclipse,
whereas CoffeeDregs is more IDE-independent. Also
the use of Visual Operational Semantics ((Jayaraman
and Baltus, 1996)) and the Contour Model ((Johnston,
1971)) is subtly different. For a more detailed com-
parison and full treatment of the more subtle differ-
ences, see (Luijten, 2003).
We introduce our approach in section 2. In the
next two sections we argue how to visualize, and what
to show or hide. In section 5 we introduce the tool as
applied to single threaded programs. In section 6 we
briefly discuss its implementation. In section 7 we
explain the extension to multi-threading. We consider
options to treat user interaction through the GUI in
section 8. This also provides an opportunity to explain
our didactic approach in some more depth and shows
the power of directly using information from the JVM
for visualization.
2 DIDACTIC APPROACH
We use the bottom-up approach in teaching OO pro-
gramming rather than the objects-first approach. One
rationale is that we want to introduce the activity of
a computer as performing small steps, for which it
can be easily understood that they can be mechanized.
Another reason is that, as our experience shows, it is
advantageous to introduce objects not as given black
boxes, but as composite entities explained in terms
of already understood basic concepts. What we show
initially is very simple: one class, one method, with
basic statements. Then we incrementally add method
decomposition and the OO concepts: object struc-
tures (references between objects, interaction through
method calls), class structures (inheritance), library
use, multi-threading, GUI programming, etc. The
model shows progressively more of these concepts.
In our teaching we use lecture notes (we are aim-
ing for a book version) with small chapters, introduc-
ing one concept at a time, providing its semantics in
terms of the, visualized, execution model. This se-
mantics presents an abstract view of what happens in-
side the computer, e.g., variables and objects are visu-
alized, stack frames are not. Thus we neither rely on
machine notions for modeling nor do we make use of
metaphor.
With each concept we provide a small example,
the execution of which is visualized by the tool. The
students then program more examples themselves, vi-
sualizing the execution with CoffeeDregs. Explain-
ing the concepts in terms of the model together with
a dynamic visualization proves effective in establish-
ing a clear, concrete domain to think and communi-
cate about programs. Note that with new concepts,
new features are added to the model or already present
ones are used in new ways, but that there is no change
in the level of abstraction – only one model is built up
incrementally.
CoffeeDregs can be used stand-alone, but also as a
plug-in to an IDE - we use the latter version for teach-
ing, incorporated as a plug-in to NetBeans.
CSEDU2012-4thInternationalConferenceonComputerSupportedEducation
66

Choices about the model itself and how to visual-
ize it are so much intertwined that from now on we
will consider both under visualization.
3 HOW TO VISUALIZE
The concepts that CoffeeDregs seeks to elucidate are
the following.
1. Objects as container of data (variables) and cen-
ter of manipulation (methods - with expressions,
assignment); method and object recursion.
2. Scoping and life-time.
3. Object structures: references between objects and
interaction through method calls.
4. Difference between class and object.
5. Class structures: inheritance (notably overriding
of methods).
6. Use of libraries.
7. Multi-threading.
8. User interaction through GUI.
Essentially, the execution is visualized as a se-
ries of snapshots of the “inside of the computer” that
shows the OO structure as well as the changes during
execution. Guided by the above aims, the model has
the following features (see Figure 1).
The guiding idea is to visualize the execution as
a series of snapshots of the “inside of the computer”
that shows the OO structure as well as the points of
activity and the changes caused by this activity dur-
ing execution. The lower limit level of abstraction is
variable values, the abstraction level of the dynam-
ics is stepwise statement execution. One snapshot at
the time is visible, the effect of a step is indicated by
the change in the snapshot, with additional clues like
highlighting the locus of change.
Expression evaluation occurs as one step if only
values or variables are involved. If a function is used
in an expression, its execution involves the steps con-
form the visualization of method execution. Including
detailed expression evaluation is one of the extensions
of the tool that is considered.
1. We use a modified version of the Visual Oper-
ational Semantics (VOS) for OO by Jayarman
and Baltus (Jayaraman and Baltus, 1996), which
in turn is based on the Countour Model (CM)
for scoping by Johnston (Johnston, 1971) (for
more detail about motivation and use, see (Lui-
jten, 2003)). We first and foremost model the dy-
namics of the execution and therefore only use
contours, boxes, for objects and, inside these, for
variable values and methods (also inside methods
we use boxes to hold the values of local variables).
As we explain the semantics at statement level, in-
side the contours the corresponding program code
is present. Practicalities come to the fore here:
to make this fit on the screen, rather than the full
code of the body body, only a window of three
lines of code (the active statement plus its im-
mediate surroundings) may be displayed at each
snapshot. A cursor indicates the place of control.
2. We use the contours to indicate scope, and also to
indicate life-time: objects are visualized on cre-
ation - automated garbage collection is modeled
in that objects that are out of scope are no longer
displayed. Method calls are visualized as the ap-
pearance of the called method; methods are only
displayed as long as they are active. Various sub-
tleties apply here: for example, a shaded cursor
at the place of a method call indicates that con-
trol (that moved to the executing method) will re-
turn there after the execution is finished. Note,
that method recursion is automatically taken care
of: each recursive call causes a new copy of the
method being added to the object.
3. Object structures: references between objects are
provided both as addresses (following the actual
language mechanism) and through visible point-
ers that make the structure easier to comprehend.
The visualization of method call and correspond-
ing active method shows the interaction between
objects, emphasizing that calls come from the out-
side, but that the activity itself is taking place in-
side the object.
4. The difference between class and object is made
clear by separately displaying the class code, as
code - not using contours. The objects are dis-
played in the main window on the screen, code is
displayed to the right in a separate window. We
indicate by a colored bar in the static code where
this code is used to update the dynamic part: for
example, when a new object is created or when a
method is called.
NB Static variables and methods, notably main are
incorporated in the model using a special class-
object. As the treatment is similar to the regular
objects, we do not further elaborate here.
5. Class structures: inheritance is modeled in the dy-
namic part by labeling objects with their dynamic
type. A colored bar in the static part shows the
method that is selected - the code is copied to the
dynamic part. In case of overriding, the appro-
priate method in the appropriate class is selected
VISUALIZATIONOFOBJECT-ORIENTED(JAVA)PROGRAMS
67

- directly: stepping through the inheritance hier-
archy is not visualized. This is another example
of the many subtle choices that have to be made:
Visualizing the stepping, for example by moving
the colored bar through the class code, could be a
viable alternative, but might also create confusion
about what a step in an execution means, and com-
promise the idea that class code is static. There-
fore, for now we have chosen to limit visualiz-
ing activity inside objects. Note that variables in
the object may come from different levels of the
inheritance hierarchy. For simplicity, we do not
consider variable shadowing, although the VCS
can support this.
6. Use of library code is in principle covered by the
model - to make the visualization feasible more
needs to be done: see section 4.
7. Multi-threading is in principle straightforward:
adding a thread identifier to the control-cursor:
see section 7.
8. User-interaction through GUI is a challenging ex-
tension: see section 8.
Remark
CoffeeDregs only visualizes what happens inside the
computer during execution. Therefore, input and out-
put are not part of the visualization: the visualiza-
tion is driven by the actual execution of the program,
so input and output are no different from the case
where the program is executed without visualization.
In teaching this proves to be quite helpful in that the
students do not get confused about what belongs to
the visualization and what does not.
4 WHAT TO VISUALIZE
To make a visualization practicable requires careful
consideration of what to display and what not to dis-
play. When executing a Java program, many auxil-
iary objects are created, resulting in a very large and
incomprehensible visualization. Based on experience
with previous versions of the tool, we investigated in
detail how to decide which objects and methods to
show and how to responsibly hide the others.
4.1 Ordering to Visualization
Importance
We define a set of rules in terms of dynamic object
properties and previously assigned object order. The
rules are applied in order for each object. The first-
matching rule decides the order of the object.
1. A method is currently executing in the object, as-
sign order method-executing.
2. A method is active in the object, assign order
methods-active.
3. the object is user-selected, assign order user-
selected.
4. The object has no active methods and the object is
referenced by at least 1 object of higher order than
methods- active, assign order object-referenced-
from-above.
5. The object is referenced by x other objects, assign
order object-often-referenced.
6. No rule matches, assign order bottom.
The result is that objects with active methods get a
high order, while inactive objects get lower orders. If
an inactive object is directly referenced by an active
object or if it is heavily referenced, it gets a slightly
higher order.
We distinguish three basic levels of visibility.
1. Expanded. These contours show the full infor-
mation, including values of instance variables and
methods that are currently active in the object.
2. Collapsed. These contours show only the type and
the reference of the object and no inner structure
or text.
3. Hidden. These objects are not visualized on the
screen.
The importance level is mapped to the visualiza-
tion level as follows.
• Objects of order methods-active and higher are
expanded.
• Objects of order between object-often-referenced
and object-referenced-from-above are collapsed.
• Objects of order bottom are hidden.
4.2 Tying Objects Back Together
All objects have an importance assigned to them and
as a result some of them now have become hidden.
Now other higher-importance objects might have be-
come dangling because they were only referenced
from currently hidden objects. We replace reference
connections through objects of lower importance with
transitive reference connections. They differ in ap-
pearance from the normal object references.
If there is a reference path from an expanded ob-
ject A (see Figure 2), via one collapsed object S and
then via one or more hidden objects to another ex-
panded object B, then there a transitive reference from
S to B is added. If there is a direct reference from a
CSEDU2012-4thInternationalConferenceonComputerSupportedEducation
68
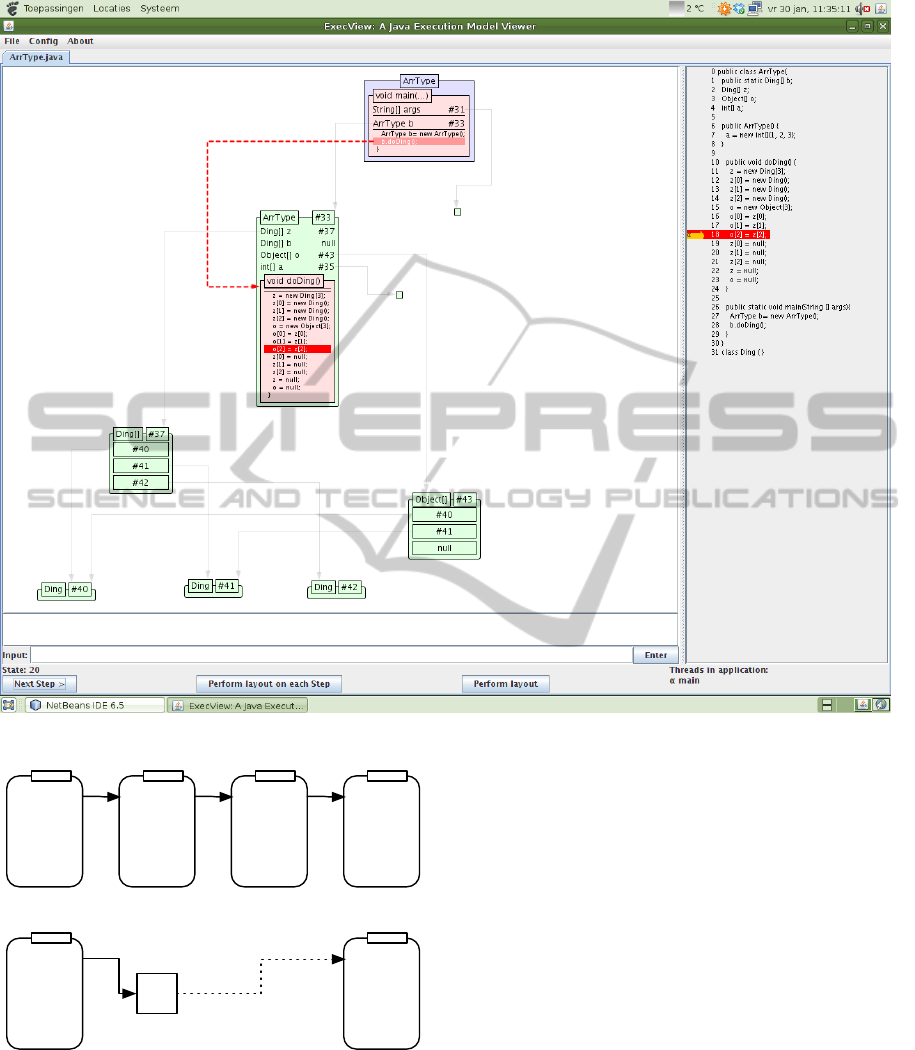
Figure 1: CoffeeDregs in action.
S
S BA T
A B
Figure 2: Using transitive links to reconnect expanded and
collapsed objects. The objects in the structure in the top
are ordered, which results in the image in the bottom: S is
collapsed and all objects between S and B (only T in this
case) are hidden. Object B is still expanded and to prevent
dangling objects, all paths to B from a collapsed object are
reconstructed by drawing transitive reference connections.
collapsed object S to an expanded object B (i.e. there
are zero hidden objects in between them), then there
is a normal reference from S to B.
4.3 Discussion
One could think of additional sublevels of expanded
objects, in which for instance private variables are
hidden if the object inherits from a non user-defined
class. Beware that much of the functionality lies in
these private variables and that, for example, a stor-
age class can not show how the user-defined objects
are stored within it if its private variables are hidden!
The hiding of private variables should therefore prob-
ably only occur for “leaves” in the object reference
graph.
Great care is therefore required not to confuse ac-
cessibility in OO with reachability (and thus visibil-
ity) in the model. The aim of the model is to visual-
ize the state of the program and not to visualize the
structures in the program code. As a result, private
VISUALIZATIONOFOBJECT-ORIENTED(JAVA)PROGRAMS
69

variables may be visible, even though they are inac-
cessible from the program code. They nevertheless
contribute to the execution model that is visualized
and are therefore required to be visible.
If it is really necessary to hide variables, a better
way probably is to merge them into a single ‘super-
variable’ private which holds all references and thus
the reference connections in the graph of the object
model.
5 CoffeeDregs
Visualization is covered for the first six concepts de-
scribed in section 3, in the manner described in sec-
tion 4.
Programs are developed in an IDE, like the Net-
Beans we currently use. CoffeeDregs can be used
stand-alone, taking the class files as well as the com-
piled program as input. Alternatively, CoffeeDregs
can be used as a plug-in for NetBeans: CoffeeDregs is
started from the NetBeans menu by clicking the Cof-
feeDregs icon in the menu.
Stepping through the program is push-button.
It is possible to step in reverse direction, e.g., to
better understand what led to certain behavior. Cur-
rently there is no support for going back and chang-
ing the course of the execution by, e.g., providing dif-
ferent input or changing values of variables. From a
didactic point of view it is debatable whether it would
be desirable to have this option: on the one hand pur-
suing alternatives may help to understand the behav-
ior of a program, on the other hand it might introduce
confusion between interaction with a program and in-
teraction with its visualization. For a technical moti-
vation see section 6.
6 IMPLEMENTING THE
VISUALIZATION
The visualization and the program under study run
in different virtual machines (JVMs). Using the Java
Debug Interface, events are sent from the second JVM
to the first when the program makes an execution step
and these are used to visualize the state and to pause
and resume execution of the second JVM. Reverse
stepping is implemented by caching previous states.
The state is visualized using the Visual Object and
Execution Model from the NetBeans Visual Library.
We lightly explore the software architecture. For
more information on this topic, see (Vandalon, 2009)
CoffeeDregs is made up of two main com-
ponents thereby partly following the Model-View-
Controller pattern: debugmodel and debugview. The
debugmodel handles the communication with the
Java debugger and keeps a consistent state model.
The debugview makes a drawing of the state model
and acts as a controller to debugmodel.
CoffeeDregs
debugview
debugmodelJava Debug Interface
NetBeans Visual API
Java Swing
Figure 3: High level architecture diagram.
When a program is loaded into CoffeeDregs, a
VM is started for the program. CoffeeDregs then con-
nects to the VM to subscribe to method entry and exit
events and to execution step events. These events are
reused as events within CoffeeDregs to notify the vi-
sualization of updates in the state.
When the visualization receives a notification, it
updates its set of visualized objects. New objects in
the programmer’s program are added to the visual-
ization. Old objects that do not exist anymore in the
programmer’s program are also removed from the vi-
sualization.
After the set of visualized objects has been up-
dated, the objects in the set are updated to reflect
changed values. If a method is active in an object,
it is also added or its state is updated.
Following the update of the state is a reevaluation
of the objects’ properties and applying the rules as
described in section 4.
7 MULTI-THREADING IN
CoffeeDregs
Multi-threaded programs are covered as follows: for
each thread a separate control cursor is visualized, la-
beled with a number. This works well for the pro-
grams that occur in educational context, that typically
have only a limited number of threads. This is spe-
cially instructive for Swing (GUI) programs where the
Swing thread is visibly different from the main thread.
Whether thread objects are visualized is optional.
There is no control as yet over which thread to
advance.
CSEDU2012-4thInternationalConferenceonComputerSupportedEducation
70

Control moves from run to dispatchEvent to the matching handler of the eventListener.
class SwingThread {
EventQueue<AWT event> eventQueue; //filled by the system
AWTEvent e;
void run {
while (true) {
if (!eventQueue.isEmpty()) {
e = eventQueue.getNextEvent(); //take topmost event from eventQueue
e.getSource().dispatchEvent(e); //on component that is source, call dispatchEvent
}
}
}
Figure 4: Abstract event loop presented separately from CoffeeDregs.
For each source that is a (sub)class (of) JComponent, lists of references to listeners and a dispatchEvent method
are provided as follows.
class JComponent {
List<MouseListener> mouseListeners; //references to listeners registered on component,
...//one list for each listener type
void dispatchEvent(Event e) {
if (isMouseListenerEvent(e)) {//for e MouseListenerEvent,
for (MouseListener lis : mouseListeners) {//on each MouseListener registered on component
if (isMouseClickedEvent(e)) {//depending on type of e,
lis.mouseClicked(e);//call handler matching type of e
} else if (is MousePressedEvent(e)){
lis.mousePressedEvent(e);
} else if
...
} else if
...
}
}
Figure 5: Dispatch method in event source, presented separately from CoffeeDregs.
8 USER INTERACTION
THROUGH GUI
Modern languages like Java provide extensive support
for user interaction, by means of libraries and a so-
phisticated framework to process user events.
We have experienced that explicitly treating (an
abstract version of) the event loop is crucial in teach-
ing this framework and prevents or takes away many
misconceptions. For example, to explain the handling
of mouse events, we show code as presented in figures
4 and 5.
Since this abstract code is not part of a Java im-
plementation, CoffeeDregs can not visualize it. Cof-
feeDregs currently gives three options to visualize the
corresponding Swing implementation.
One option is to hide all objects and activities from
library code. This is the default. This gives the
simplest view, but completely hides the event loop.
The second option is to visualize a few selected
objects involved in the event loop in a collapsed view.
This way, one sees when control is at the objects im-
plementing the event loop, but the execution itself will
not be visible.
The third option is to expand the objects that im-
plement the event loop. CoffeeDregs will then give
a detailed view of the execution of the event loop.
This may be instructive, although its level of detail
and hairiness may be detrimental to the understand-
ing of many students.
The subject of current research is to see whether
these possibilities suffice to support the explanation of
the event model or that is feasible to extend Coffee-
Dregs with the option to visualize the abstract event
loop.
VISUALIZATIONOFOBJECT-ORIENTED(JAVA)PROGRAMS
71

9 CONCLUSIONS AND FUTURE
WORK
We have presented a viable visualization tool, Coffee-
Dregs, for OO (Java) programs. In its present form,
the tool supports multi-threaded Java programs, with
standard input and output and GUI-programs to a lim-
ited extent.
At this stage of the development of the tool, it is
important to assess its educational effectiveness with
quantitative experiments. Some preliminary steps in
qualitative assessment have been reported on in (Lui-
jten, 2003)
A new direction of development would be to con-
nect the tool to a verification tool. Programs then
carry annotations for verification, and the verifica-
tion tool verifies whether or not the program satisfies
these annotation. Having the visualization available,
this would provide opportunities to better understand
where and why annotations might fail. Promising
candidate verification tool are Dafny (Leino, 2010)
and Cocktail (Franssen, 2000).
ACKNOWLEDGEMENTS
We thank the referees for detailed and constructive
advice.
REFERENCES
Franssen, M. (2000). Cocktail: A tool for deriving correct
programs. PhD thesis, Eindhoven University of Tech-
nology.
Gestwicki, P. V. and Jayaraman, B. (2004). Jive: Java
interactive visualization environment. In OOPSLA
’04: Companion to the 19th annual ACM SIGPLAN
conference on Object-oriented programming systems,
languages, and applications, pages 226–228, New
York, NY, USA. ACM.
Jayaraman, B. and Baltus, C. M. (1996). Visualizing
program execution. In VL ’96: Proceedings of the
1996 IEEE Symposium on Visual Languages, page 30,
Washington, DC, USA. IEEE Computer Society.
Johnston, J. B. (1971). The contour model of block struc-
tured processes. SIGPLAN Not., 6(2):55–82.
K
¨
olling, M. (2010). The Greenfoot Programming Envrion-
ment. ACM Transactions on Computing Education,
10(4).
K
¨
olling, M., Quig, B., Patterson, A., and Rosenberg, J.
(2003). The BlueJ system and its pedagogy. Journal
of Computer Science Education, 13(4):249–268.
Leino, K. R. M. (2010). Dafny: An automatic program ver-
ifier for functional correctness. In LPAR-16, volume
6355 of LNCS, pages 348–370. Springer.
Lessa, D., Czyz, J. K., and Jayaraman, B. (2010). JIVE:
A pedagogic tool for visualizing the execution of Java
programs.
Lessa, D. and Jayaraman, B. (2012). Explaining the dy-
namic structure and behavior of java programs using
a visual debugger. In Proceedings of the 43rd ACM
Technical Symposium on Computer Science Educa-
tion (SIGCSE).
Levy, R. B.-B., Ben-Ari, M., and Uronen, P. A. (2002). The
Jeliot 2000 program animation system. Computers &
Education, 40(1):1–15.
Luijten, C. A. (2003). Interactive visualization of the ex-
ecution of object-oriented programs. Master’s thesis,
Eindhoven University of Technology.
Vandalon, V. (2009). Concepts and structure of Coffee-
dregs. Internship report, Eindhoven Univeristy of
Technology.
Vandalon, V. (2010). Coffeedregs tool: http://
www.win.tue.nl/∼keesh/ow/coffeedregs/.
CSEDU2012-4thInternationalConferenceonComputerSupportedEducation
72
