
M4CLOUD - GENERIC APPLICATION LEVEL MONITORING
FOR RESOURCE-SHARED CLOUD ENVIRONMENTS
Toni Mastelic, Vincent C. Emeakaroha, Michael Maurer and Ivona Brandic
Information Systems Institute, Vienna University of Technology, Argentinierstrasse 8/184-1, A-1040 Vienna, Austria
Keywords:
M4Cloud, Cloud Metric Classification, Application Level Metrics, Monitoring.
Abstract:
Cloud computing is a promising concept for the implementation of scalable on-demand computing infrastruc-
tures, where resources are provided in a self-managing manner based on predefined customers requirements.
A Service Level Agreement (SLA), which is established between a Cloud provider and a customer, specifies
these requirements. It includes terms like required memory consumption, bandwidth or service availability.
The SLA also defines penalties for SLA violations when the Cloud provider fails to provide the agreed amount
of resources or quality of service. A current challenge in Cloud environments is to detect any possible SLA
violation and to timely react upon it to avoid paying penalties, as well as reduce unnecessary resource con-
sumption by managing resources more efficiently. In resource-shared Cloud environments, where there might
be multiple VMs on a single physical machine and multiple applications on a single VM, Cloud providers
require mechanisms for monitoring resource and QoS metrics for each customer application separately. Cur-
rently, there is a lack of generic classification of application level metrics. In this paper, we introduce a novel
approach for classifying and monitoring application level metrics in a resource-shared Cloud environment.
We present the design and implementation of the generic application level monitoring system. Finally, we
evaluate our approach and implementation, and provide a proof of concept and functionality.
1 INTRODUCTION
Cloud computing represents a novel and promising
approach for providing on-demand computing re-
sources to remote customers on the basis of Service
Level Agreements (SLAs) defining the terms of usage
and provisioning of these resources. Additionally, an
SLA defines metrics (Ludwig et al., 2003; Patel et al.,
2009) that represent measurable attributes of a service
that is being provided and can be expressed as a nu-
merical value, e.g., 98% for availability. SLA metrics
include resource descriptions, e.g., CPU and storage,
and a quality of service to be guaranteed, e.g., avail-
ability and response time. They must be monitored by
a Cloud provider in order to allocate the right amount
of resources to a customer.
On the one hand, a Cloud provider wastes re-
sources, if he allocates more than a customer is using,
which consumes significant amount of energy (Duy
et al., 2010; Mehta et al., 2011); and on the other
hand, if he allocates the exact amount of resources,
there is a risk of SLA violations once the customer’s
usage increases beyond that allocation. Moreover,
SLA metrics are defined for each application separat-
ely, meaning that Cloud providers are required to
monitor metrics at the application layer in the Cloud
environment, referred to as application level metrics.
Currently, a virtualization technology is deeply
used to share resources in Cloud environments. Cloud
providers are now capable of running multiple vir-
tual machines (VMs) on a single physical machine
or even multiple applications on a single VM. How-
ever, monitoring only a physical machine or even a
VM in a resource-shared environment, does not pro-
vide enough information for measuring the applica-
tion’s resource consumption, detecting SLA viola-
tions, and thus, managing resources efficiently. In
order to properly implement managing mechanisms,
a Cloud provider is required to measure metrics for
each application (Cao et al., 2009), and thus, perform
application level monitoring. Furthermore, applica-
tion level metrics lack a generic and adequate classifi-
cation, which makes their usage in other management
mechanisms difficult, such as in application schedul-
ing. Appropriate metric classification is a big chal-
lenge in achieving monitoring for purpose of efficient
scheduling and detecting SLA violations in resource-
shared Cloud environments.
522
Mastelic T., C. Emeakaroha V., Maurer M. and Brandic I..
M4CLOUD - GENERIC APPLICATION LEVEL MONITORING FOR RESOURCE-SHARED CLOUD ENVIRONMENTS.
DOI: 10.5220/0003928805220532
In Proceedings of the 2nd International Conference on Cloud Computing and Services Science (CLOSER-2012), pages 522-532
ISBN: 978-989-8565-05-1
Copyright
c
2012 SCITEPRESS (Science and Technology Publications, Lda.)

In this paper we present a novel model-driven ap-
proach for generic application level monitoring in a
resource-shared Cloud environment. We first present
the Cloud Metric Classification (CMC) approach for
classifying application level metrics, which forms the
basis for the implementation of our novel application
monitoring framework. CMC consists of four models
where each model distinguishes metrics by a single
characteristic.
Based on CMC we introduce a generic application
level monitoring model for a resource-shared Cloud
environment referred to as M4Cloud, which is ca-
pable of monitoring application level metrics at run-
time. We describe our M4Cloud model as a com-
ponent based model consisting of three core compo-
nents. Moreover, we present its main Application
Level Monitoring component implemented using an
Agent-Server architecture. We utilize Sigar tool (Hy-
peric, 2010) as the Agent’s core monitoring compo-
nent.
The rest of the paper is organized as follows:
Section 2 presents an overview of the related work.
Section 3 introduces CMC for classifying applica-
tion level metrics by explaining each model sepa-
rately. Section 4 covers the conceptual design of the
M4Cloud model. Section 5 describes the design and
implementation of the Application Level Monitoring
component. Section 6 deals with the evaluation of our
approach, and presents the results. Finally, Section 7
concludes our work and discusses the future work.
2 RELATED WORK
We present in this section an overview of the related
work for a metric classification, as well as applica-
tion level monitoring approaches by other authors. To
our knowledge, there is no commonly accepted metric
classification, which would satisfy all requirements
imposed by Cloud environments. In (Cheng et al.,
2009) the authors define a basic mathematical differ-
ence between metrics by creating two categories: di-
rect and calculable metrics, also referred as resource
and composite metrics in (Patel et al., 2009; Ludwig
et al., 2003). Although commonly used, this clas-
sification does not provide means to distinguish ap-
plication level metrics by some other criteria. How-
ever, we use this classification as the Measurement
based model in our CMC. In (Alhamad et al., 2010)
the authors define metrics for certain Cloud deploy-
ment models (IaaS, PaaS and Saas). They use met-
rics like Reliability, Scalability etc., thus, providing
a more of an abstract overview, serving as a guide-
book for a Cloud consumer when signing an SLA.
However, they do not provide measuring details for
specified metrics.
There are also approaches dealing with metric
monitoring like Runtime Model for Cloud Monitor-
ing (RMCM) presented in (Shao et al., 2010). RMCM
is also used in (Shao and Wang, 2011) for perfor-
mance guarantee in Cloud environments. It uses sev-
eral mechanisms for monitoring resource consump-
tion and performance including Sigar tool, JVM mon-
itoring, JMX and service probing. However, RMCM
focuses on Web applications, while it does not pro-
vide a generic approach for interfacing these met-
rics. (Rak et al., 2011) introduces Cloud Application
Monitoring for mOSAIC framework, which provides
API for developing a portable Cloud software. How-
ever, it offers a generic interface limited only to the
mOSAIC framework, while it depends on monitoring
tools like ganglia, nagios etc. Authors in (Lee and
Hur, 2011) provide Platform Management Frame-
work for the ETRI SaaS platform based on services,
which includes system level monitoring in a resource-
shared environment. Beside system level metrics like
CPU, memory, sessions and threads, the authors also
mention tenant, user and service monitoring. How-
ever, no indication or description of application level
metrics is provided. To the best of our knowledge,
none of the discussed approaches deals with a generic
monitoringapproach of application level metrics in an
arbitrary Cloud environment.
3 APPLICATION LEVEL
METRICS
In this section, we provide a use-case scenario for a
discussion on a metric classification. We use several
metrics as an example and describe overlapping met-
ric characteristics. Finally, we present our CMC ap-
proach for classifying application level metrics using
the example metrics from the use case.
Cloud Metrics Use Case. We use a Cloud environ-
ment use-case shown in Figure 1 that takes the fol-
lowing metrics as an input data for managing Cloud
resources and defining SLA objectives: CPU usage,
response time and number of database (db) entities.
CPU usage and response time can be measured for
every application as represented with circle shapes in
Figure 1. However, metrics represented with rectan-
gular shapes can be measured only for specific appli-
cations. In our use case, number of db entities can
be measured only for a database application. If we
implement a scheduling algorithm, which uses num-
M4CLOUD-GENERICAPPLICATIONLEVELMONITORINGFORRESOURCE-SHAREDCLOUD
ENVIRONMENTS
523
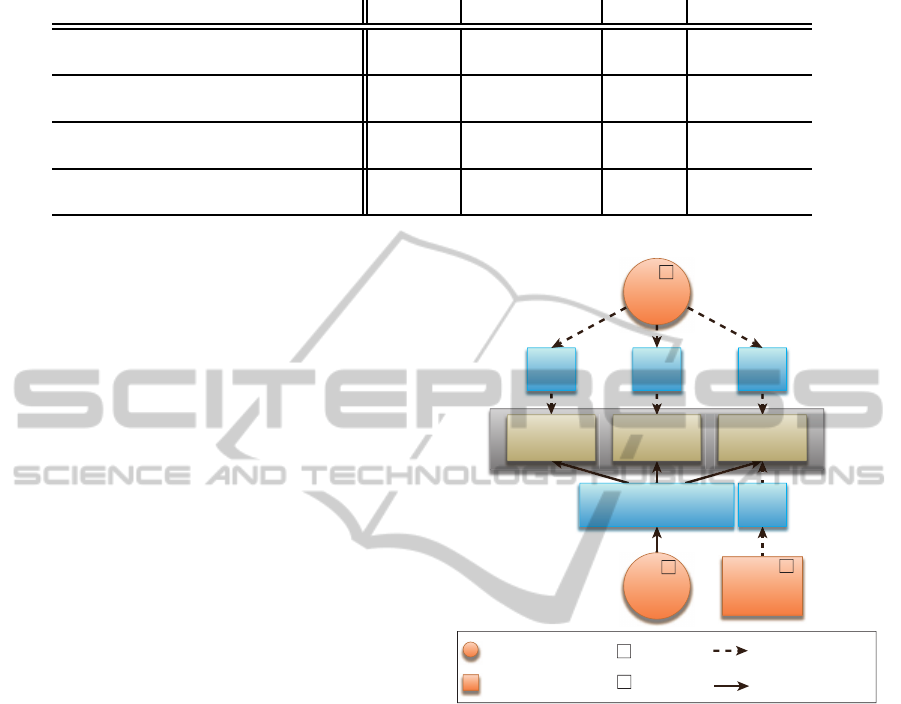
Table 1: Metric classification examples using CMC models each containing two classes.
Model Class Memory Response time Uptime Query speed
Application based
Generic
x x x
Specific x
Measurement based
Direct
x
Calculable x x x
Implementation based
Shared
x x
Individual x x
Nature based
Quantity
x x
Quality x x
ber of db entities metric as an input data, the mech-
anism would be dedicated only for database applica-
tions. Moreover, a Cloud provider has to specify how
these metrics are being measured. While number of
db entities is a raw value (marked with symbol d in
Figure 1), CPU usage and response time have to be
calculated from several other metrics, and are marked
with symbol c in Figure 1; e.g., response time is calcu-
lated using the request received timestamp (t
1
) and the
response sent timestamp (t
2
), as shown by the Equa-
tion 1 (Norton and Solutions, 1999).
ResponseTime = t
2
− t
1
(1)
Although response time can be measured for all
applications, metrics t
1
and t
2
cannot be acquired the
same way for all applications. Thus, a Cloud provider
has to implement different mechanisms for measuring
response time, for each application separately. This
is shown in Figure 1 with dotted arrows, where MM
represents a measuring mechanism for a single met-
ric. Number of db entities obviously requires a sep-
arate implementation as it can only be measured for
specific applications. Finally, a Cloud provider has
to define these metrics within an SLA. CPU usage
and number of db entities can be defined and charged
by the amount customer is using and are placed be-
low applications in Figure 1. Response time repre-
sents a quality of service (QoS), thus, it is defined as
a threshold depending on the application type and the
application input data. QoS metrics are placed above
applications in Figure 1.
In order to respond to challenges presented in
our Cloud metrics use case, we present Cloud Metric
Classification (CMC) for classifying application level
metrics with respect to their overlapping characteris-
tics.
3.1 Cloud Metric Classification (CMC)
In this section, we describe each CMC model sep-
arately by applying them on metrics used in the
Cloud metrics use case. CMC includes (i) Applica-
VM
Database
application
Image
application
Processing
application
Measurable for
evey application
Direct or
raw metrics
Separate measuring
mechanisms
Measurable only for
specic applications
number of
db entities
MM
Measuring
mechanism (MM)
MM
CPU
usage
c
response
time
c
d
Calculable
metrics
c
d
Shared measuring
mechanisms
MM MM
Figure 1: Use-case scenario with metric overview.
tion based, (ii) Measurement based, (iii) Implemen-
tation based and (iv) Nature based models. Using
these models, each metric can and must be classified
in order to be used for generic application level mon-
itoring in our M4Cloud model described in Section 4.
All CMC models are applied on an individual met-
ric by following these specific procedures: (i) a met-
ric is first classified by the Application based model,
which distinguishes it by an application for which this
metric is being measured; (ii) after that, Measurement
based model is applied to it that defines a mathemat-
ical equation to measure/calculate metric; (iii) next
step is the Implementation based model, which de-
fines a metric measuring mechanism using the equa-
tion defined in the previous step; (iv) final step is us-
ing the Nature based model to define a nature of a
metric and its definition within an SLA. Table 1 con-
tains summary of CMC models along with the exam-
ples. Next, we provide a detailed explanation for each
model:
CLOSER2012-2ndInternationalConferenceonCloudComputingandServicesScience
524

Application based model defines if a metric can
be applied on an individual or on all applications.
Consequently, this model defines two classes: (a)
generic - metrics that can be measured for every ap-
plication, e.g., CPU usage and response time; and (b)
specific - metrics that depend on additional informa-
tion that an application can provide by having specific
functions. Consequently, we can only measure spe-
cific metrics which an application is providing, e.g.,
number of db entities.
Measurement based model defines how a met-
ric is measured or calculated. This model relies on a
categorization introduced by (Cheng et al., 2009) and
defines two classes: (a) direct - metrics that are mea-
sured and used as is without further processing, e.g.,
number of db entities; and (b) calculable - metrics
which are calculated from two or more other metrics,
direct or calculable, e.g., CPU usage (Equation 2) and
response time (Equation 1).
CPUusage =
CPUtime
application
CPUtime
system
∗ 100 (2)
Implementation based model defines how metric
measuring mechanisms can be implemented for cer-
tain applications. Consequently, this model defines
two classes: (a) shared - metrics for which a single
measuring mechanism can be implemented to support
all applications, e.g., CPU usage; and (b) individual
- metrics for which a measuring mechanism has to
be implemented for each application separately, since
not all applications provide same interface or a metric
information in a uniform way, e.g., response time and
number of db entities.
Nature based model defines nature of a met-
ric and its definition within an SLA. It includes two
classes: (a) quantity - metrics that are defined as
amount of resources being provided/rented to a con-
sumer, e.g., CPU usage and number of db entities;
and (b) quality - metrics that represent a quality of
service that is guaranteed within some threshold, e.g.,
response time.
CMC models provide a clear metric classification
used for utilizing metrics on-demand in our M4Cloud
model. Moreover, they provide basis for defining
standardized set of metrics for different application
types as suggested in (Ludwig et al., 2003).
4 DESIGN OF GENERIC
APPLICATION LEVEL
MONITORING SYSTEM
In this section, we discuss the application level moni-
toring in a resource-shared Cloud environment. We
introduce our generic monitoring model M4Cloud
that implements the CMC approach described in Sec-
tion 3. We explain its role in an arbitrary Cloud Man-
agement System (CMS), which supports fully cus-
tomized components. In our model, we use the FoSII
infrastructure (Brandic, 2009) as a CMS, developed
at Vienna University of Technology in context of the
FoSII project (FoSII, 2011). Finally, we describe an
implementation of the M4Cloud main component -
the Application Level Monitoring component.
Figure 2 presents the M4Cloud model, as well as
its relations to FoSII as a CMS. FoSII offers a model
for an autonomic knowledge-based SLA management
and enforcement using the MAPE loop (Monitoring,
Analysis, Planning and Execution). Monitored data
is analyzed and stored within a knowledge database.
Data from the knowledge database is used for plan-
ning and suggesting actions. After an action has been
executed, monitored data is again acquired and ana-
lyzed for evaluating action’s efficiency. FoSII consists
of two core components: (i) the LoM2HiS frame-
work introduced by (Emeakaroha et al., 2010), used
for mapping metrics on a resource layer to SLA spec-
ified metrics; (ii) the Enactor component introduced
by (Maurer et al., 2011). It implements a knowledge-
based management system for provisioning resources
in a self-adaptable manner. Finally, FoSII includes
an SLA-aware scheduler introduced by (Emeakaroha
et al., 2011a), which decides where a user application
will be deployed.
In order to provide full functionality, FoSII re-
quires a metric monitoring system which can pro-
vide a necessary application monitored data. For this
purpose, we introduce our M4Cloud model consist-
ing of three core components: Application Deployer
(AD), Metric Plugin Container (MPC) and Applica-
tion Level Monitoring (ALM) component.
As shown in Figure 2, the Scheduler decides
where customer’s application will be executed. Af-
ter that, it sends a request to the AD that deploys
an application to a designated VM, starts it and re-
trieves its ID. It also deploys plugins to MPC con-
taining measuring mechanisms for individual metrics.
Finally, it forwards ID of the deployed application to
the ALM component. Using the application ID, the
ALM component tracks down customer’s application
and monitors it using the metric plugins. Acquired
monitored data, consisting of metric values, is stored
in a database, as well as directly forwarded to the
LoM2HiS framework. If there is a risk of an SLA
violation or some resource is being underutilized, En-
actor Component performs an action in order to cor-
rect the situation. Additionally, monitored data from
the database can be used by the Knowledge System
M4CLOUD-GENERICAPPLICATIONLEVELMONITORINGFORRESOURCE-SHAREDCLOUD
ENVIRONMENTS
525
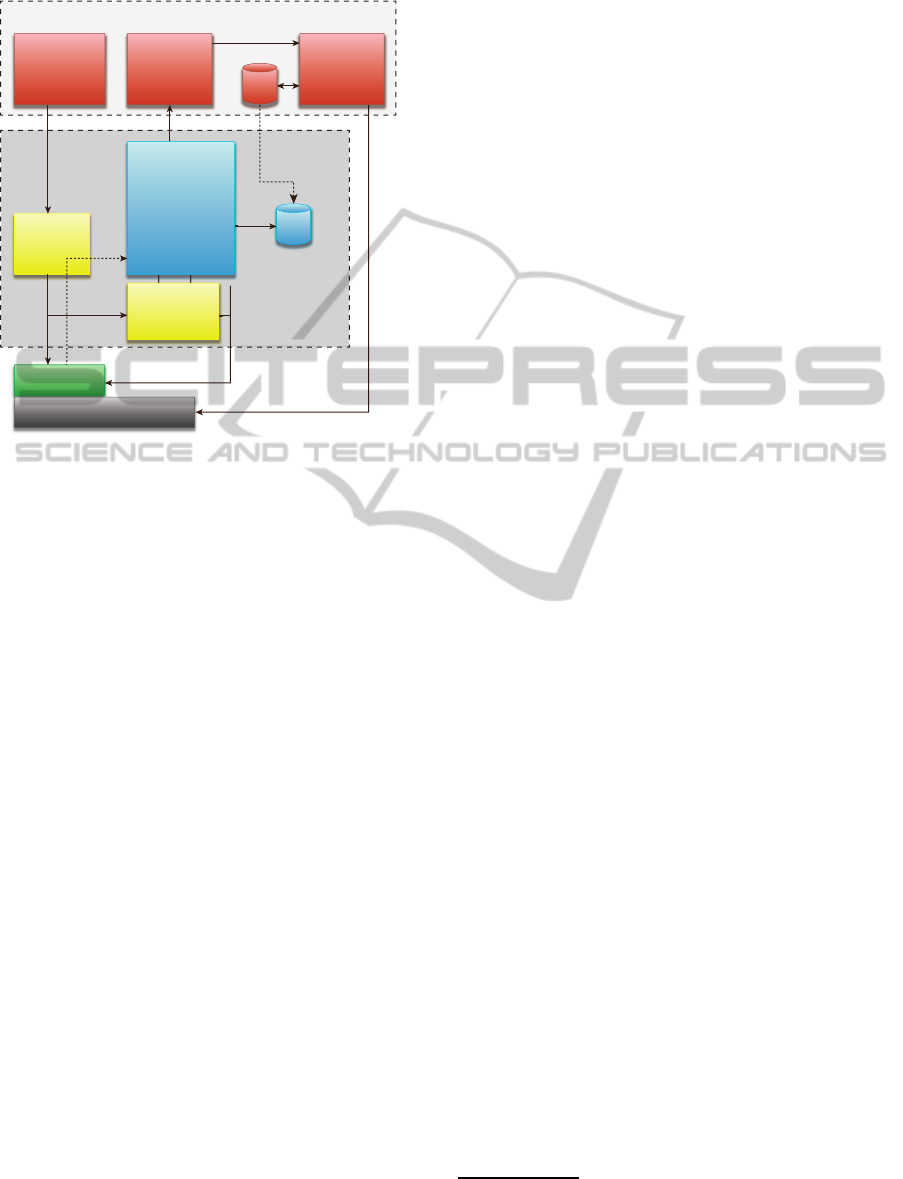
for application profiling.
DB
SLA-aware
Scheduler
LoM2HiS
Framework
KB
Application
manage resources
monitor
deploy
plugin
learn
report
request
action
ID
deploy
and start
schedule
FoSII infrastructure
Cloud infrastructure
M4Cloud
Application
Deployer
(AD)
VM
Metric Plugin
Container
(MPC)
Application
Level
Monitoring
(ALM)
component
Enactor
Component
Figure 2: M4Cloud model.
4.1 M4Cloud Infrastructure Overview
After explaining roles of the M4Cloud components
(Figure 2), here we provide a description of their in-
ternal structure and functions.
(1) Application Deployer - AD component is used
to deploy applications, achieve automatic metric plu-
gin deployment and identify applications for indi-
vidual monitoring. In our model, we assume that a
CMS has already generated an SLA description of a
customer’s application in a WSLA format including:
application name, version, metrics to be monitored,
thresholds etc. Applications are automatically iden-
tified using the SLA description received from the
CMS. Afterwards, they are matched to required plug-
ins using a plugin’s metadata in a standard data format
like JSON, XML etc. The Application is started and
assigned an ID.
(2) Metric Plugin Container - MPC supports the
concept of a dynamic plugin loader, which can uti-
lize metrics by using plugins deployed by AD. Plu-
gins are classified using the CMC approach and uti-
lized on-demand by MPC through a generic inter-
face. The generic interface is achieved with an object-
oriented development using abstract classes, as well
as dynamic libraries. The classification is done within
the plugin’s metadata which defines: (i) applications
to which this plugin is applied to by the Application
based model; (ii) metric function dependencies by the
Measurement based model in a DSL
1
format. Devel-
opment of the appropriate DSL interface is a subject
of an ongoing work; (iii) a type of implementation by
the Implementation based model including the inter-
face type; (iv) a threshold or amount defined by the
Nature based model.
(3) Application Level Monitoring - ALM compo-
nent serves as a central component used for measuring
metrics, storing monitored data into the database, and
forwarding data to a CMS. It uses ID received from
AD for monitoring individual applications, and MPC
to utilize metrics on-demand as requested by an SLA
description. The functionality and implementation of
this component is fully described in Section 5.
FoSII components on top of Figure 2 represent
third party CMS components. VM in Figure 2
represents Cloud resources provisioned by a Cloud
provider. Finally, Application is a software deployed
by a Cloud consumer. In the following section we
discuss more about ALM component and its imple-
mentation.
5 IMPLEMENTATION OF THE
APPLICATION LEVEL
MONITORING (ALM)
COMPONENT
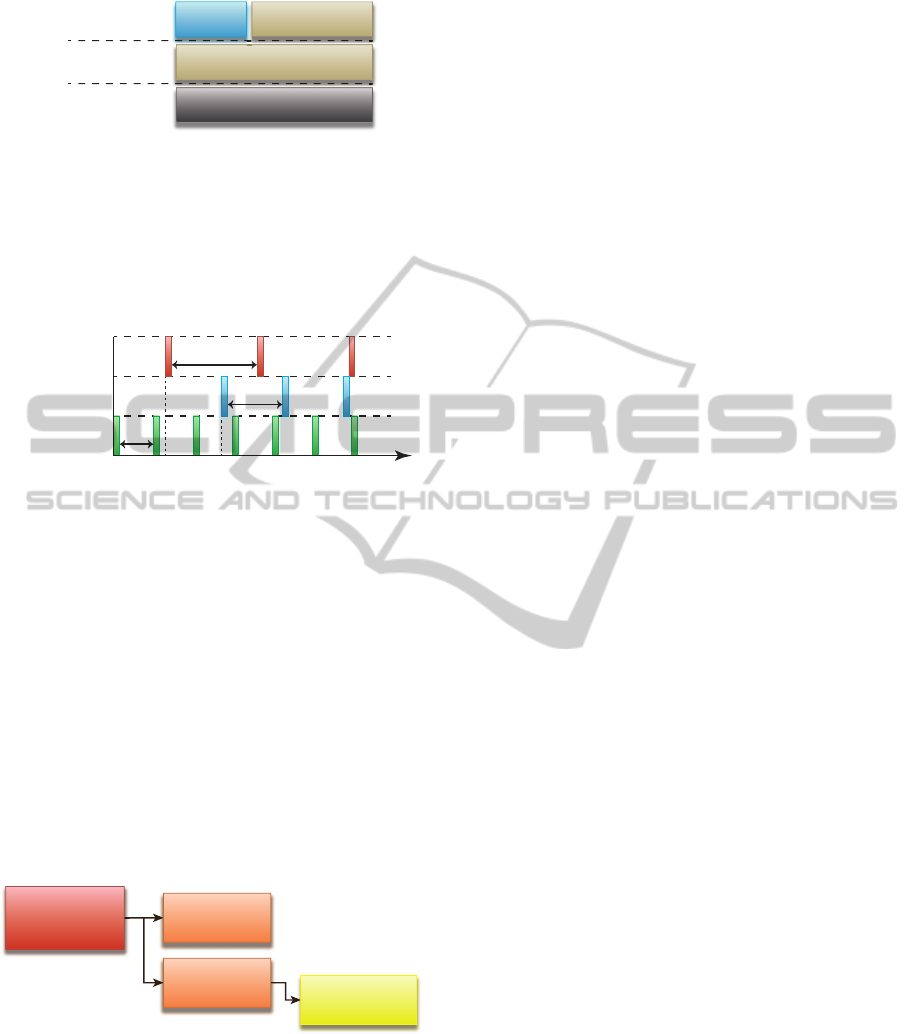
Usually, Cloud environments consist of Cloud ele-
ments represented by physical machines running one
or several VMs, which serve as a platform for run-
ning customer’s applications. These elements con-
sist of the following three layers, as shown in Figure
3: (i) Physical layer with physical machines which
can include Hypervisor, (ii) System layer with VMs,
and (iii) Application layer where customer’s applica-
tions are running. Monitoring application level met-
rics needs to be done on the Application layer. Conse-
quently, this requires metric measuring mechanisms
to be applied on that layer. We use an Agent, as
part of ALM, for utilizing metric measuring mech-
anisms on-demand and monitoring application level
metrics. The Agent represents a standalone applica-
tion that runs on the Application layer amongst other
applications, as shown in Figure 3.
Additionally, the Agent has to monitor metrics pe-
riodically on a predefined interval r. This requires a
timer-like function for each application separately, as
intervals can be arbitrary. This is shown in Figure 4
where one Agent, running on a single VM, monitors
three applications running on the same VM. Each ap-
plication has its own measuring interval (r
1
, r
2
, and
1
Domain Specific Language.
CLOSER2012-2ndInternationalConferenceonCloudComputingandServicesScience
526
Physical machine
VM
Applications
Application layer
System layer
Physical layer
Agent
Figure 3: Cloud element layers.
r
3
), and a different start time (t
1
, t
2
, and t
3
). Since
defining a monitoring interval is not a trivial task,
we refer to (Emeakaroha et al., 2011b), where an ap-
proach for defining monitoring interval has been sug-
gested.
Application 1
r
1
Application 2
Application 3
r
2
r
3
t
2
t
1
t
3
t
Figure 4: Time view of measuring procedure for three ap-
plications.
In order to distinguish one application from an-
other, and to monitor each application separately, the
Agent has to identify each application by a unique
parameter. For this purpose, we use the process ID
called PID (Linfo, 2011). Each application consists
of one or more processes, each of them having the
unique PID. While an application is being started, op-
erating system creates a main process and assigns PID
to it. The main process, also called a parent pro-
cess, can create other processes called child processes
(MSDN, 2011). In Figure 5, process P.0 is a parent to
processes P.01 and P.02, while process P.02 is a parent
to a process P.021.
Parent
process
P.0
Child
process
P.01
Child
process
P.02
Child
process
P.021
Figure 5: Application’s process tree.
Getting the PID once the process has started is not
a trivial task, as an operating system can run hun-
dreds of processes. We use the Agent as the parent
process to start customer’s applications. Once (child)
process of a customer’s application has started, it re-
ports its PID back to a parent process, in our case
the Agent. This way, the Agent can start monitoring
immediately. However, in order to monitor metrics,
the Agent must include consumption of all descend-
ing processes belonging to the application. We use the
same parent-child relationship in order to build a list
of PIDs for a single application. Using the PID list,
we can easily sum up a resource consumption of all
processes belonging to the monitored application and
calculate total resource consumption in a moment t,
as expressed with the Equation (3). Table 2 lists met-
rics measured by ALM using a Sigar tool in our im-
plementation. Metrics are classified using the CMC
approach described in Section 3.
R
t
(total) = R
t
(P
1
) + R
t
(P
2
) + ... + R
t
(P
n
) (3)
A specific metrics by the Application based model
do not share this approach, as they are implemented
and measured within an application itself, and col-
lected through an external API by the Agent. An ex-
ample is given in Section 6.1 with the render time per
frame metric on a real world application. In the fol-
lowing sections, we discuss the infrastructure of the
ALM component.
5.1 Infrastructure Overview
For implementing the ALM component, we used
an Agent-Server architecture (Figure 6) consisting
of two main components: (i) Agent is a small,
lightweight monitoring mechanism, which runs as
a standalone application on every VM/node in the
Cloud. Its task is to measure and gather monitored
data of one or more applications running on a subject
VM, and to forward acquired data to the Server. This
is the Agent described in Section 5; (ii) Server is an
application running on a separate physical element,
serving as a central point of the entire ALM com-
ponent. It is used for managing remote Agents, re-
ceiving monitored data and storing it into a database.
Infrastructure combined of one Server and multiple
Agents is referred to as M4Cloud Branch, as shown
in Figure 6. It can be used for smaller Cloud systems
up to several hundreds of VM instances. However,
larger Cloud systems can use a cluster of M4Cloud
Branches, all managed by the Dynamic Cluster Bal-
ancer. A function of the Dynamic Cluster Balancer
is to balance a communication load created by the
Agents. The Agent supports dynamic change of a
Server destination, thus, it can be easily redirected to
another Server instance for purpose of load balancing.
Dynamic Cluster Balancer in this case can use an arbi-
trary algorithm to determine the number of M4Cloud
Branches in a cluster, as well as redirect the Agents to
another M4Cloud Branches to optimize the load.
M4CLOUD-GENERICAPPLICATIONLEVELMONITORINGFORRESOURCE-SHAREDCLOUD
ENVIRONMENTS
527
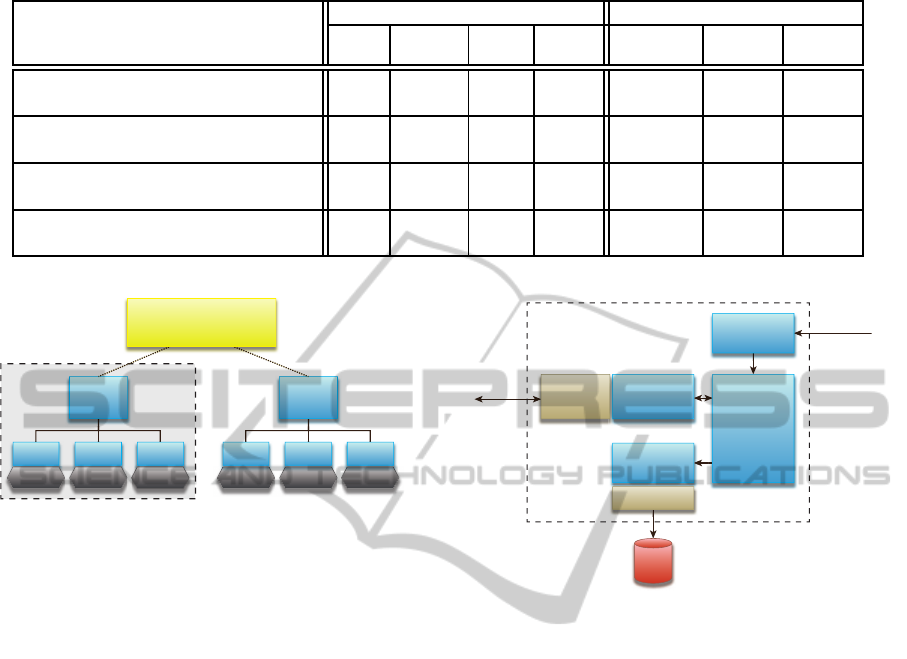
Table 2: Classification of the CPU and Memory metrics using CMC approach.
CPU metrics Memory metrics
Model Class
User
time
Kernel
time
Total
time
CPU
usage
Resident Shared Virtual
Application based
Generic
x x x x x x x
Specific
Measurement based
Direct
x x x x x
Calculable x x
Implementation based
Shared
x x x x x x x
Individual
Nature based
Quantity
x x x x x x x
Quality
Server
M4Cloud
Branch
Agent
Agent Agent
VM VM VM
Server
Agent
Agent Agent
VM VM VM
Dynamic
Cluster Balancer
Figure 6: Agent-server architecture.
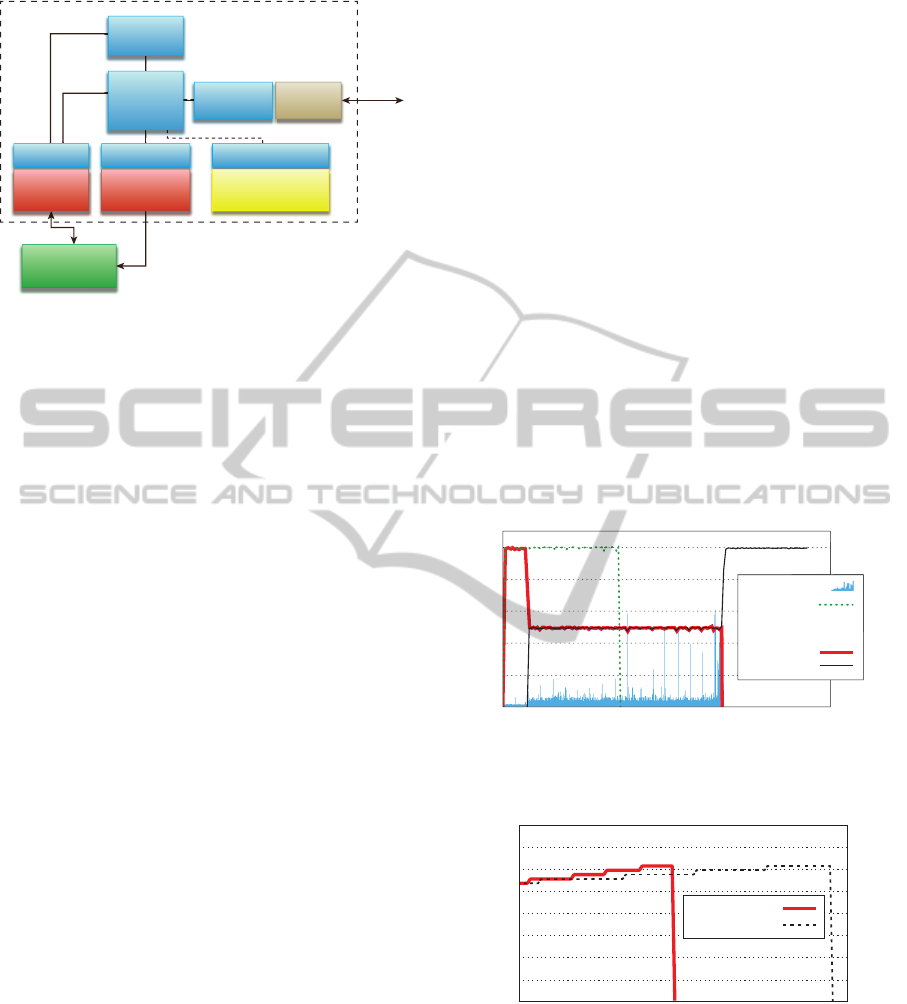
5.2 Server Implementation
The Server is implemented as a non-GUI desktop ap-
plication written entirely in Java. It consists of the
following components as shown in Figure 7: (i) Web
interface (UI) is a user interface implemented with
Java Server Faces used for managing entire ALM
component through the Server application. It sends
monitoring instructions to the Server used for start-
ing the application, defining measuring interval and
metrics for monitoring; (ii) UI connection is a socket
connection that receives monitoring instructions and
forwards them to the Core component; (iii) Core is
the main component, which controls all other com-
ponents; (iv) Connection manager is an ActiveMQ
messaging system for managing connections with the
remote Agents. It is used for sending monitoring in-
structions and receiving monitored data; (v) DB con-
nection is a JDBC connection to a MySQL database
used for storing monitored data.
5.3 Agent Implementation
The Agent is also a non-GUI desktop application im-
plemented in Java with some partitions of portable
C code. It consists of the following components as
shown in Figure 8: (i) Connection is an ActiveMQ
connection with multiple sessions for each applica-
UI
connection
DB
connection
Connection
manager
ActiveMQ
Server
Agent
Web
interface
Core
JDBC
DB
Figure 7: Server infrastructure overview.
tion being monitored. It is used for receiving moni-
toring instructions and sending monitored data to the
Server; (ii) Core is the main component which con-
trols all other components; (iii) Application starter is
a component written in C for starting a targeted ap-
plication using a run command from the monitoring
instructions. It performs functionality of the AD com-
ponent by retrieving the application’s PID and return-
ing it to the Core component. Moreover, it connects
to the Agent through a Java API implemented using
Java Native Interface; (iv) Process seeker is used for
building a PID list of a targeted application using the
Sigar tool. It returns the PID list to the Core compo-
nent; (v) Plugin interface is a Java interface for uti-
lizing metric measuring mechanisms using the plug-
ins from MPC; (vi) Sigar is a well known monitoring
tool implemented in C with Java API used by the Pro-
cess seeker component. It is also used for measuring
shared metrics of applications. Except Sigar, which
measures shared metrics, plugins for individual met-
rics are accessed through MPC.
CLOSER2012-2ndInternationalConferenceonCloudComputingandServicesScience
528
Connection
Application
ActiveMQ
Server
Agent
Core
Java APIJava API
Process
seeker
Application
starter
Plugin interface
Metric Plugin
Container (MPC)
Sigar
Figure 8: Agent infrastructure overview.
6 EVALUATION
For our evaluation we use VMs running Ubuntu
Server 10.04 edition with 1GB of RAM and one CPU
core within a single M4Cloud Branch. We run sev-
eral types of evaluation tests, which we can divide
into two groups: (i) Agent side tests, and (ii) Server
side tests. (i) For the Agent side tests we use two
VMs: one for running the Agent and one for running
the Server application. The test are performed on a
real world applications including Scilab - a free soft-
ware for numerical computation, and FFmpeg - cross
platform solution to record, convert and stream au-
dio and video. (ii) For the Server side tests we used
four VMs: one for running the Server application and
up to three VMs for running SimAgent Deployers for
simulating distributed environment. Additionally, we
evaluate MySQL database. We implemented a small
benchmark application, whose task is to continuously
store packages, but within an infinite loop and without
any additional workload. The packages are the same
as those received during a real runtime.
The setup and results of these tests are presented
in following sections: for Agent side tests in Section
6.1 and in Section 6.2 for Server side tests.
6.1 Agent Evaluation Results
Here we present the evaluation approach, as well as
the results for the Agent side tests. The tests are per-
formed on a single VM running a single Agent. This
reflects a real Cloud environment, since the Agent is
not aware of other nodes but the one it is running
on. The tests are performed with Scilab and FFm-
peg applications running alone, as well as running in
parallel. Monitored data is collected by the Server
running on a different node/VM. After an applica-
tion is completed, both the Agent and the Server are
stopped. Additional evaluation includes monitoring
Agent’s resource consumption. This is done within
the Agent itself using already implemented Sigar tool.
Resource consumption data is stored within a local
text file.
Test 1: Each application is executed indepen-
dently on a VM. Since both Scilab and FFmpeg are
CPU intensive applications, the CPU usage is almost
constant at 100% during runtime.
Test 2: For the simplicity of tests and present-
ing results, we run only two applications in parallel.
However, the same approach could apply for running
several applications. Figure 9 shows the CPU usage
of the applications running in parallel. Since both ap-
plications are CPU intensive, there is a performance
impact by one application to another. Figure 10 shows
the memory consumption of the FFmpeg application.
Since execution time is prolonged due to a lower CPU
usage as seen in Figure 9, the memory usage is also
prolonged on the time axis. This shows how one met-
ric can impact on other metric, directly or indirectly.
time [sec]
cpu usage [%]
0 100 200 300 400 500 600 700 800
100
80
60
40
20
0
CPUFFmpeg
CPUFFmpeg
CPUScilab
Running parallel:
Render time
Figure 9: CPU usage of Scilab and FFmpeg from Test 1 and
Test 2.
time [sec]
memory usage [mb]
running parallel
running alone
0 100 200 300 400 500 600
40
35
30
25
20
15
10
5
0
Figure 10: Memory usage of FFmpeg while running alone
(Test 1) and parallel (Test 2).
Moreover, we implemented an additional metric
for monitoring: render time per frame that measures
time needed to render a single video frame by FFm-
peg. Obviously, this is a specific metric by the Appli-
cation based model since it can be monitored only for
FFmpeg in our example, as well as individual met-
M4CLOUD-GENERICAPPLICATIONLEVELMONITORINGFORRESOURCE-SHAREDCLOUD
ENVIRONMENTS
529
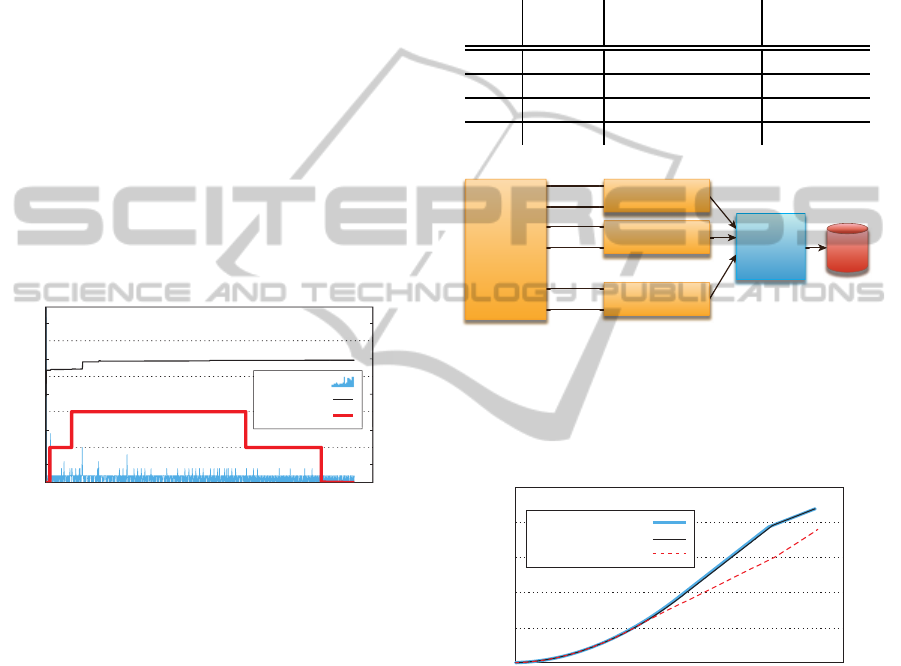
ric by the Implementation based model as it has to
be monitored by a separate measuring mechanism.
However,since FFmpeg does not nativelyprovide this
metric, we implemented it by changing the source
code of the application. This clearly shows that spe-
cific metrics cannot be measured if an application
does not provide an interface for it. Monitored data
of this metric is stored into a local text file. Figure 9
shows how the CPU usage affects the render time per
frame metric by creating high peeks where the CPU
usage slightly drops down.
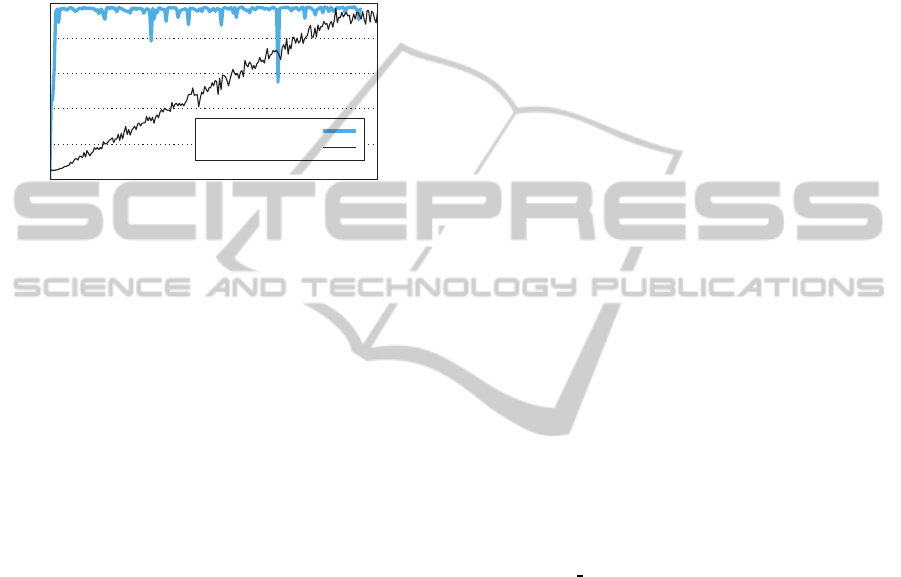
Finally, we monitor the performance of the Agent.
Figure 11 shows the CPU and memory usage of the
Agent in relation with the number of applications be-
ing monitored at certain time step. As seen from the
results, the Agent does not affect overall VM perfor-
mance since it is using a small percentage of the CPU,
as well as a small amount of memory. Since the ALM
component aims only on application level metrics, its
hardware requirements are considerably below simi-
lar tools like Hyperic HQ (Hyperic, 2011).
time [sec]
cpu usage [%]
memory usage [mb]
number of applications
mb
er
o
f
ap
pl
ic
at
io
ns
Memory
Applications
CPU usage
0 150 300 450 600 750 900
25
20
15
10
5
5
4
3
2
1
0
45
35
25
15
5
Figure 11: Agent’s resource consumption in comparison
with a number of monitored applications.
6.2 Server Evaluation Results
In this section we present evaluation results for the
Server side tests, as well as the evaluation approach.
The tests are performed in an emulation like en-
vironment with one Server application on a single
M4Cloud Branch. The Server application is started
on a separate node/VM, while the remote Agents are
simulated using SimAgent Deployer. SimAgent De-
ployer is an application that starts dozens of threads
called SimAgents as shown in Figure 12. Every Sim-
Agent simulates one Agent by sending predetermined
metric values to the Server without performing any
real monitoring, thus, creating a realistic communi-
cation load on the Server. We measure three points
of interest during test runtime: (1) number of pack-
ages sent by the SimAgents, (2) number of pack-
ages received by the Server and (3) number of pack-
ages stored into the database. After several minutes
of execution, SimAgents are stopped, as well as the
Server. We run these tests with 13 metrics per simu-
lated application, and the increasing number of Sim-
Agents/simulated applications (Table 3). A SimAgent
simulates deployment of a new application every one
second with a random measuring interval between 5
and 20 seconds for a metric. Tests are performed until
a throughput limit is detected.
Table 3: Server side test configurations.
Test
no.
Sim
Agents
SimApplications
per SimAgent
Total no.
of Metrics
3.1 1*200 10 26000
3.2 1*100 50 65000
3.4 3*100 25 97500
3.5 2*100 50 130000
thread
thread
thread
SimAgent
deployer
SimAgent #1
SimAgent #2
SimAgent #n
Server
DB
. . .
Figure 12: Server’s scalability testbed using SimAgents.
Test 3: Figure 13 shows a cumulative number
of packages on three monitoring points defined above
that are measured on the test 3.5 from Table 3.
time [sec]
cumulative number of packages
received by Server
stored into DB
sent by SimAgents
0 50 100 150 200 250 300 350 400
2.5
2.0
1.5
1.0
0.5
0
x 105
Figure 13: Packages transmitted during test 3.5 runtime.
As seen from the Figure 13, the Server is able to
receive all packages being sent by these 200 SimA-
gents. However, stagnation in the number of pack-
ages being stored into the DB is due to a large num-
ber of concurrent threads trying to access the DB con-
nection component of the Server application. This
represents the throughput limit for a single M4Cloud
Branch and is slightly below 1000 packages per sec-
ond as seen in Figure 14. Although, the Server can
continue working, it cannot catch up with the increas-
ing number of received packages, unless the receiv-
ing speed decreases below the limit. Using the clus-
tering approach described in Section 5.1 solves this
CLOSER2012-2ndInternationalConferenceonCloudComputingandServicesScience
530
problem, by distributing a load to multiple Servers.
However, our goal is to increase this limit in order to
provide greater scalability. This way, we would re-
quire fewer M4Cloud Branches for large Clouds. By
implementing multi-threaded queues and utilizing a
database connection pool, this limit can be distinctly
increased (Chamness, 2000). However, a database
limitation still remains a bottleneck.
time [sec]
number of packages per second
Test 3.5 conguration
MySQL benchmark
0 20 40 60 80 100 120 140 160 180 200 220
1000
800
600
400
200
0
Figure 14: MySQL benchmark.
Test 4 includes the evaluation of the MySQL
database itself to determine its limitations. We use
our benchmark tool described in Section 6 to evalu-
ate the database. Figure 14 shows that MySQL can
store almost 1000 packages per second. This equals
to 13.000 insert queries since there are 13 metrics per
package, and one metric requires one insert query.
Configuration from the Test 3 represents a marginal
use case where 1000 packages per second is reached,
as seen in Figure 14. Increasing this limit could be
done by utilizing a non-relation database like Hadoop,
or by filtering the data being stored into a database.
7 CONCLUSIONS AND FUTURE
WORK
After virtualization, resource-sharing on a System
layer represents a next step for improving usage ef-
ficiency of Cloud resources. This is why mecha-
nisms like application level monitoring represent one
of the core management components. In this paper,
we presented our CMC approach for classifying ap-
plication level metrics, which indicate an importance
of different metric characteristics. We demonstrated
that while implementing Cloud mechanisms, which
use metric data as an input (e.g. scheduling mecha-
nism), one cannot choose an arbitrary metric without
considering its implementation, calculation method,
SLA definition or applications to which this metric
can be applied. However, we used our CMC ap-
proach to build M4Cloud - a generic application level
monitoring model for resource-shared Cloud environ-
ments, which overcomes these shortages. M4Cloud
provides a generic approach for acquiring any metric
data, thus, providing an interface for other CMS com-
ponents.
Implementing Application Deployer and Metric
Plugin Container is part of our ongoing research
work. We also intend to integrate our model with
other Cloud Management System components to pro-
vide full support for scheduling and SLA violation de-
tection mechanisms. Additionally, we are working on
introducing new metrics using our CMC approach, as
well as extending it to include Security, Performance
and other metric types. Our future work will be fo-
cused on resource sharing itself in order to provide
a generic, secure and flexible resource-shared Cloud
environment.
REFERENCES
Alhamad, M., Dillon, T., and Chang, E. (2010). Conceptual
SLA framework for cloud computing. In 4th IEEE
International Conference on Digital Ecosystems and
Technologies (DEST). IEEE.
Brandic, I. (2009). Towards Self-Manageable cloud ser-
vices. In Computer Software and Applications Con-
ference, 2009. COMPSAC ’09. 33rd Annual IEEE In-
ternational, volume 2. IEEE.
Cao, Q., Wei, Z., and Gong, W. (2009). An optimized algo-
rithm for task scheduling based on activity based cost-
ing in cloud computing. In 3rd International Confer-
ence on Bioinformatics and Biomedical Engineering ,
2009. ICBBE. IEEE.
Chamness, M. (2000). Performance tuning for the
JDBC API. http://alumnus.caltech.edu/ cham-
ness/JDBC
Tuning.pdf.
Cheng, X., Shi, Y., and Li, Q. (2009). A multi-tenant ori-
ented performance monitoring, detecting and schedul-
ing architecture based on SLA. In Joint Conferences
on Pervasive Computing (JCPC). IEEE.
Duy, T. V. T., Sato, Y., and Inoguchi, Y. (2010). Perfor-
mance evaluation of a green scheduling algorithm for
energy savings in cloud computing. In IEEE Interna-
tional Symposium on Parallel & Distributed Process-
ing, Workshops and Phd Forum (IPDPSW). IEEE.
Emeakaroha, V. C., Brandic, I., Maurer, M., and Breskovic,
I. (2011a). SLA-Aware application deployment and
resource allocation in clouds. In Computer Software
and Applications Conference Workshops (COMP-
SACW), IEEE 35th Annual. IEEE.
Emeakaroha, V. C., Brandic, I., Maurer, M., and Dustdar,
S. (2010). Low level metrics to high level SLAs
- LoM2HiS framework: Bridging the gap between
monitored metrics and SLA parameters in cloud envi-
ronments. In International Conference on High Per-
formance Computing and Simulation (HPCS). IEEE.
Emeakaroha, V. C., Netto, M. A. S., Calheiros, R. N.,
Brandic, I., Buyya, R., and De Rose, C. A. F. (2011b).
M4CLOUD-GENERICAPPLICATIONLEVELMONITORINGFORRESOURCE-SHAREDCLOUD
ENVIRONMENTS
531

Towards autonomic detection of SLA violations in
cloud infrastructures. Future Generation Computer
Systems.
FoSII (2011). FOSII - foundations of
Self-Governing ICT infrastructures.
http://www.infosys.tuwien.ac.at/linksites/FOSII/.
Hyperic (2010). SIGAR - system in-
formation gatherer and reporter.
http://support.hyperic.com/display/SIGAR/Home.
Hyperic (2011). Hyperic hq - documentation.
http://support.hyperic.com/display/DOC/Installation+
Requirements.
Lee, J. and Hur, S. J. (2011). Level 2 SaaS platform and
platform management framework. In 13th Interna-
tional Conference on Advanced Communication Tech-
nology (ICACT). IEEE.
Linfo (2011). The linux information project: PID definition.
http://www.linfo.org/pid.html.
Ludwig, H., Keller, A., Dan, A., King, R. P., and Franck, R.
(2003). Web service level agreement ( WSLA ) lan-
guage specification. Specification, IBM Corporation,
USA.
Maurer, M., Brandic, I., and Sakellariou, R. (2011). Enact-
ing SLAs in clouds using rules. In Proceedings of the
17th international conference on Parallel processing -
Volume Part I. Springer-Verlag.
Mehta, A., Menaria, M., Dangi, S., and Rao, S. (2011). En-
ergy conservation in cloud infrastructures. In Systems
Conference (SysCon). IEEE.
MSDN (2011). Windows development center: Pro-
cesses and threads. http://msdn.microsoft.com/en-
us/library/windows/desktop/ms684841(v=VS.85).aspx.
Norton, T. R. and Solutions, S. (1999). End-To-End
Response-Time: where to measure? CMGCONFER-
ENCE.
Patel, P., Ranabahu, A., and Sheth, A. (2009). Service
level agreement in cloud computing. Technical report,
Knoesis Center, Wright State University, USA.
Rak, M., Venticinque, S., Mhr, T., Echevarria, G., and Es-
nal, G. (2011). Cloud application monitoring: The
mOSAIC approach. In IEEE Third International Con-
ference on Cloud Computing Technology and Science
(CloudCom). IEEE.
Shao, J. and Wang, Q. (2011). A performance guarantee
approach for cloud applications based on monitoring.
In Computer Software and Applications Conference
Workshops (COMPSACW), IEEE 35th Annual. IEEE.
Shao, J., Wei, H., Wang, Q., and Mei, H. (2010). A
runtime model based monitoring approach for cloud.
In 3rd International Conference on Cloud Computing
(CLOUD). IEEE.
CLOSER2012-2ndInternationalConferenceonCloudComputingandServicesScience
532
