
IMPROVING WEB SERVICES PERFORMANCE,
ONE STEP AT A TIME
Miguel L. Pardal, Joana Paulo Pardal and Jos
´
e Alves Marques
Department of Computer Science and Engineering, Instituto Superior T
´
ecnico, Technical University of Lisbon,
Lisbon, Portugal
Keywords:
Web Services, Performance, Measurement.
Abstract:
Web Services were designed for Enterprise systems. They are a flexible but complex technology, with
numerous performance pitfalls for developers. They also have significant overhead when compared with
platform-specific solutions (e.g. Java RMI). The end solutions have to combine (virtualized) platform, appli-
cation framework, and application-specific code. As a result of this complexity, the performance of the final
application is often disappointing and requires improvement. This paper describes the implementation of
performance tools for an open-source application framework based on the Java platform and presents the find-
ings of a detailed assessment of Web Services performance using the newly developed tools. The challenges,
techniques, and lessons learned are relevant beyond the scope of the used framework because widely used
open-source libraries were studied as well, namely: Hibernate, JAX-WS, and Log4J.
1 INTRODUCTION
Enterprise applications have many demanding
requirements (Fowler et al., 2002), and some of the
most important are related to performance such as
transaction response time and throughput. To verify if
an implementation is performing as expected, appro-
priate runtime data must be collected and analyzed to
compare design and configuration alternatives.
Web Services (Alonso et al., 2004) are a middle-
ware technology based on eXtensible Markup Lan-
guage (XML) and common Web protocols such as
HyperText Transport Protocol (HTTP) that have great
interoperability capabilities that are very useful when
connecting heterogeneous information systems, de-
veloped in different (virtualized) platforms. However
Web Services have significant overheads when com-
pared with platform-specific technologies such as
Java Remote Method Invocation (RMI). (Juric et al.,
2006) measured such overheads and reported that
a Web Service message is, on average, 4.3 times
larger than an RMI message, and that a Web Service
response time is, also on average, 9 times larger than
RMI. Performance is thus a critical concern in any
Web Services application framework.
The Simple, Extensible, and for Teaching Pur-
poses (STEP) Framework
1
is an open-source, multi-
layer, Java-based enterprise application framework
for developing Web Applications (Servlet/JSP) and
Web Services. Its source code is intended to be small
and simple enough to allow any developer to read and
understand it thoroughly, learning how the architec-
tural layers are implemented in practice. The frame-
work was used for 3 years in ‘Software Engineer-
ing’ and ‘Distributed Systems’ courses lectured at our
University by over 600 students, to teach Computer
Science and Engineering undergrads how to develop
Web Services (WS) with enterprise-like requirements.
Before the work described in this paper, the STEP
framework did not provide any means to collect run-
time data for later analysis. With this work the
framework was extended with monitoring and anal-
ysis tools that enable developers to collect actual per-
formance data and to use it to understand and compare
the actual cost of different solutions, leading to more
informed development and deployment decisions.
In the next section, a brief overview of the STEP
framework architecture is presented followed by the
introduction of the new tools. The results are pre-
sented and discussed in detail, and the paper ends with
the conclusions.
1
http://stepframework.sourceforge.net/
542
L. Pardal M., Paulo Pardal J. and Alves Marques J..
IMPROVING WEB SERVICES PERFORMANCE, ONE STEP AT A TIME.
DOI: 10.5220/0003929505420551
In Proceedings of the 2nd International Conference on Cloud Computing and Services Science (CLOSER-2012), pages 542-551
ISBN: 978-989-8565-05-1
Copyright
c
2012 SCITEPRESS (Science and Technology Publications, Lda.)
2 STEP FRAMEWORK
OVERVIEW
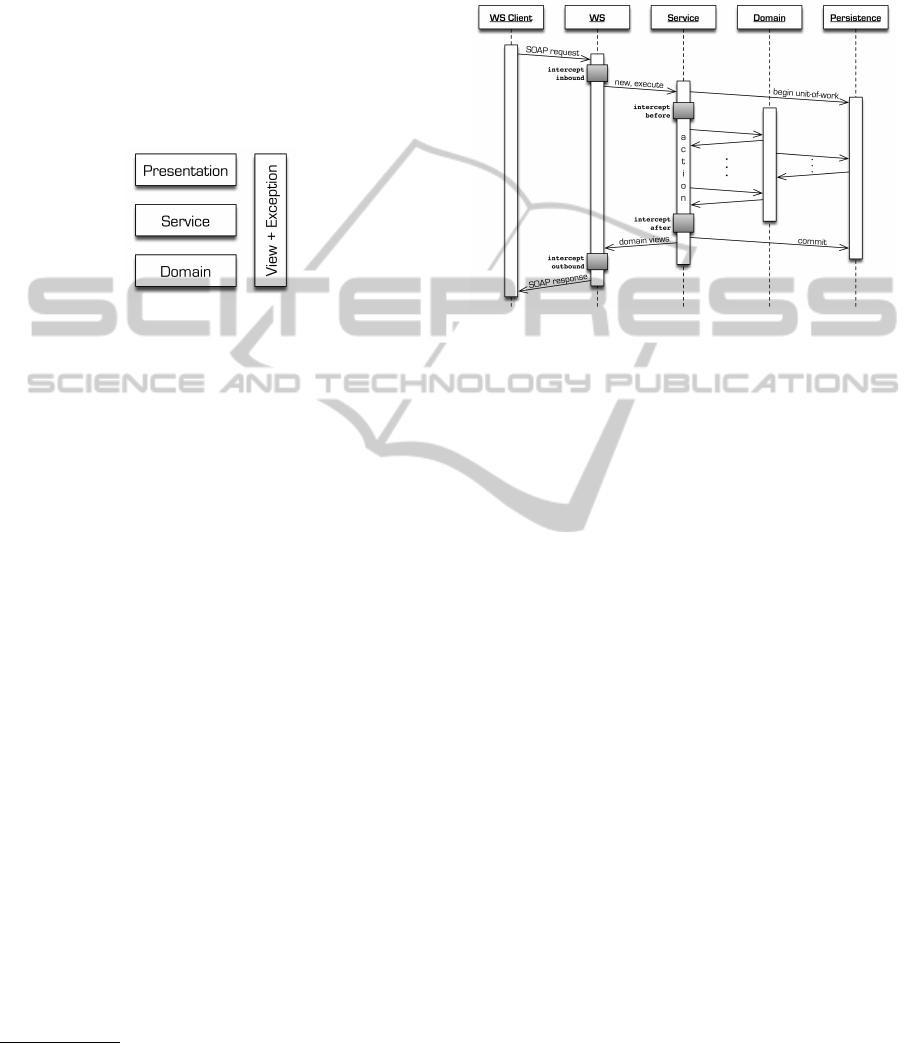
2.1 Architecture
The STEP Framework defines a typical layered archi-
tecture (Fowler et al., 2002), to separate the imple-
mentation of different concerns. The main layers are
Domain and Service. There are also Presentation and
View layers, as depicted in figure 1.
Figure 1: Architectural layers of a STEP application.
The Domain layer is where an object-oriented so-
lution for the application functional requirements are
described and implemented. Domain objects are per-
sisted to a database using object-relational mappings.
The Service layer provides access to the appli-
cation’s functionalities through service objects, that
control access to the domain objects, isolating them
from upper layers, and managing transactions in the
database to ensure atomic, consistent, isolated, and
durable (ACID) persistence.
The Presentation layer is responsible for user in-
teraction through a Web interface, implemented with
Servlets and Java Server Pages (JSP). There is also
a Web Services layer that provides remote access to
services using XML messages.
The View + Exception layer provides Data Trans-
fer Objects (DTO) that are used as input and output
(including exceptions) for service objects.
STEP relies on other open-source libraries to im-
plement some of its layers, namely: Hibernate
2
for
the Domain persistence, JAX-B
3
for the View
layer, JAX-WS
4
for the Web Services layer, and
Stripes
5
for the Web layer.
STEP also supports Extensions (Pardal et al.,
2008), a mechanism for intercepting the Service and
Web Service layers that eases the implementation of
cross-cutting concerns.
2
http://www.hibernate.org/
3
https://jaxb.dev.java.net/
4
https://jax-ws.dev.java.net/
5
http://www.stripesframework.org/
2.2 Request Processing
A request processing sequence for a STEP Web Ser-
vice is represented in figure 2.
Figure 2: Sequence diagram of STEP web service.
A request begins in the client application that
sends a SOAP envelope in an HTTP request to the
server. The application container at the server assigns
a thread to execute the request from start to finish.
The HTTP request is interpreted and dispatched to an
instance of the JAX-WS servlet.
The Web Service layer parses the SOAP envelope.
The payload is deserialized from XML messages to
Java objects.
The Service layer receives the view objects, starts
an implicit database transaction, and invokes the
needed domain objects.
The Domain layer implements business logic
using entity and relationship objects. The data per-
sistence library maps entities and relationships to
database tables and vice-versa. The mappings are
specified using code annotations. SQL queries are
generated and executed automatically.
When the application-specific logic is complete,
if no error is reported, the Service layer commits the
database transaction. Otherwise, the transaction is
aborted and an error is returned.
The resulting views are created and returned to the
Web Service layer.
The response payload is serialized from Java
objects to XML. The JAX-WS servlet sends the
SOAP envelope back to the client in the HTTP
response.
The request thread is typically returned to a thread
pool, for later reuse. Several requests can be executed
in parallel.
IMPROVINGWEBSERVICESPERFORMANCE,ONESTEPATATIME
543
3 PERFORMANCE TOOLS
The goal of performance assessment tools is to iden-
tify parts of the application that can be improved. Per-
formance measurement tools can be broadly classified
as tracers and profilers (Jain, 1991).
A tracer (Roza et al., 2009) is a component
that intercepts application code to record typed time-
stamped events. Examples of tracing tools include li-
braries like Perf4J
6
. A profiler (Shankar and Lysecky,
2009) is a program that monitors an application to de-
termine the frequency of execution in specific code
regions. A profiler can operate using sampling (appli-
cation is interrupted periodically and measurements
are taken), hardware counters (processor stores appli-
cation performance data), or instrumentation (appli-
cation source or binary code is augmented). Overall,
sampling is faster but less accurate. There are several
profiling tools available, like Eclipse TPTP
7
, JProbe
8
,
and YourKit
9
. A tracer is more lightweight than a
profiler because a profiler requires more complex in-
teractions with the application (Pearce et al., 2007).
A profiler is harder to use for server-side applications
that have to handle multiple concurrent requests.
3.1 Our Approach
The performance tools for the STEP Framework
follow the tracer approach. The goal was to collect
runtime data, to analyze it, and to test performance
improvement hypothesis. The main metric used to
measure performance was request processing time.
The performance of Java programs is affected by
application, input, virtual machine, garbage collec-
tor, heap size, and underlying operating system. All
these factors produce random errors in measurements
that are unpredictable, non-deterministic, and unbia-
sed (Georges et al., 2007).
To quantify the random errors in measurements,
the program runs had to be repeated several times.
The presented values are the mean of the samples with
a confidence interval (margin of error) computed with
a confidence level of 90%, 95%, or 99%. At least
30 runs were executed for each program variation,
so that the calculation of the confidence level could
assume a normal distribution of the samples, accord-
ing to the Central Limit Theorem (Montgomery and
Runger, 2010). Only changes in values greater than
the error margin were considered statistically relevant
and not the effect of random errors.
6
http://perf4j.codehaus.org/
7
http://www.eclipse.org/tptp/
8
http://www.quest.com/jprobe/
9
http://www.yourkit.com/
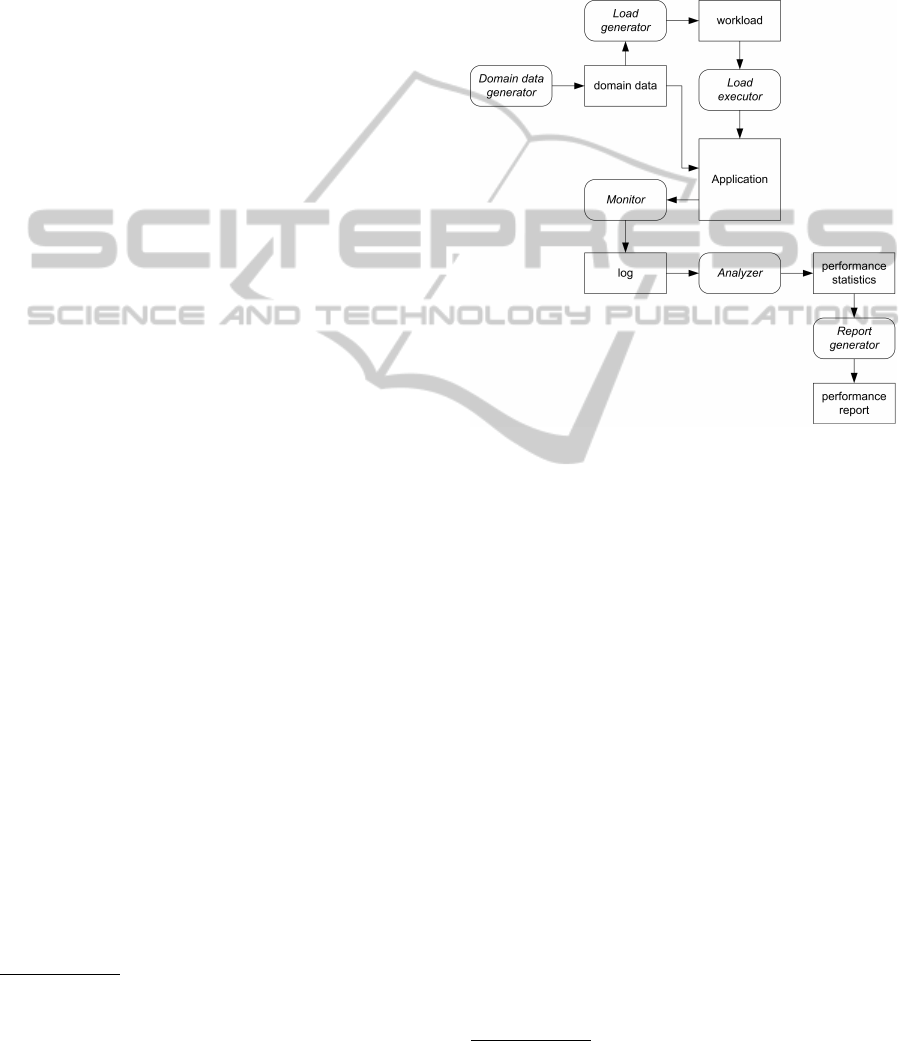
The performance analysis process encompasses
all activities necessary to generate, collect, and ana-
lyze performance-related data. Figure 3 presents the
data-flow diagram of our approach. Each activity is
performed by a specific tool: Domain Data Generator,
Load Generator, Load Executor, Monitor, Analyzer,
and Report Generator.
Figure 3: Performance tool chain data flow diagram.
3.2 Domain Data Generator
The Domain Data Generator tool populates the Flight
WS database with realistic data, both in values and
in size. The data population was realized using
Groovy
10
scripts that parsed data files and accessed
the database. The flights were generated by making
random picks (with uniform distribution), of airports
and airplanes. For each picked pair of origin and des-
tination, a set with a random number of flights was
generated, so that search flight requests would have
more than one result. The system was loaded with
2820 flight records corresponding to 15 days worth of
flights (assuming an 80% use rate in the aircraft fleet).
The random numbers required for record diversity
were generated using the default Java pseudo-random
number generator and the MySQL rand() function.
The initial database population was kept the same for
the duration of the study. Whenever it was necessary
to revert the database back to the initial state, the
generation script was run again with the same input
data files and the same random number seeds.
10
http://groovy.codehaus.org/
CLOSER2012-2ndInternationalConferenceonCloudComputingandServicesScience
544

3.3 Load Generator
The Load Generator tool produces files with seria-
lized request objects. The generated user sessions use
the following template:
1. Search flights from random existing airports;
2. Randomize user ‘think’ time;
3. Randomize passenger group size;
• If size is 0, no reservation request is created;
• If it is 1, a single reservation request is created;
• If size is greater than 1, a multiple reservation
request is created.
The default workload “SizeMedium” uses the
following settings: 50 users sessions (pairs of search
and create reservation requests), maximum reserva-
tion group size of 100 persons, no user ‘think’ time,
and 12.5% chance of (simulated) input errors. These
values were selected ad hoc. The user think times are
random millisecond values, with an upper bound. The
decision of generating requests off-line was made be-
cause the queries to pick data for the requests from the
Flight WS database would contend with the service’s
queries.
3.4 Load Executor
The Load Executor tool was programmed to send
requests to Flight WS. The script opens an object
stream, reads request objects from it, and executes
the operations: ‘think’ (thread sleep), search flights,
create single reservation, and create multiple reserva-
tions.
The requests are sent to the specified Web Service
endpoint. If an error is caught, the output message is
logged, and the processing continues.
The test run procedure is the following:
1. Drop database;
2. Create database (using hibernatetool);
3. Populate database;
4. Reset Tomcat server (remove applications and
delete temporary files);
5. Start Tomcat server;
6. Apply configuration and source file changes;
7. Compile modified Flight WS application;
8. Deploy Flight WS in Tomcat server;
9. Start virtual user(s);
10. Stop Tomcat server;
11. Collect log files.
The procedure is fully automated, allowing
unattended execution of multiple test runs in se-
quence. The tool uses a thread pool of fixed size
implemented using classes in the java.util.concurrent
package to run simultaneous virtual users. There is
one thread for each simulated user.
3.5 Monitor
The Monitor is the core component of performance
analysis. It is a new component of the STEP frame-
work that, when enabled, collects request processing
times for each architectural layer. Its two most impor-
tant features are the interception and the data logging.
3.5.1 Interception
The monitor intercepts request processing at interest-
ing points represented in Figure 2.
The JAX-WS servlet is intercepted using a Servlet
Filter component, configured in the web appli-
cation descriptor (web.xml) file. The inbound and
outbound SOAP messages are intercepted using a
JAX-WS Handler, configured in the JAX-WS code
generation configuration file (jaxws-server-custom-
binding.xml). A similar interception is also achieved
using a STEP Web Service Interceptor, config-
ured in a STEP extension configuration (exten-
sions.properties) file. The services (business logic
objects) are intercepted using a STEP Service Inter-
ceptor, also configured in the STEP extension config-
uration file. The persistence loads and stores, for each
object, are intercepted using an Hibernate Event Lis-
tener, configured in the persistence configuration (hi-
bernate.cfg.xml) file. The persistence engine objects
- SessionFactory, Session, Transaction, Criteria - are
wrapped with performance monitoring objects imple-
menting the same interfaces.
The monitor interface records the timestamps
for entries and exits in each layer using the en-
ter(Object tag) and exit(Object tag) methods. Ad-
ditional data can be recorded as key-value pairs
using the context(Object tag, String key, String value)
method. When all the described interceptors are en-
abled, one Web Service request is intercepted once by
the Servlet Filter, JAX-WS Handler, and STEP Web
Service Interceptor, and multiple times by the STEP
Service Interceptor (once for each invoked service),
and Hibernate Event Listener and Wrappers (once for
each load or store access, and once for each engine
object method call). These multiple interceptions at
the same layer mean that the total time spent inside a
layer is the sum of all elapsed times between entries
and exits and that nesting must be tracked properly.
IMPROVINGWEBSERVICESPERFORMANCE,ONESTEPATATIME
545

thread[7] tag[filter] accTime[1558494253ns]
thread[7] tag[hibernate] accTime[294309343ns]
thread[7] tag[si] accTime[441975142ns]
thread[7] tag[soap] accTime[1506191620ns]
thread[7] tag[wsi] accTime[1504073613ns]
Figure 4: Monitor request record. Context key-value pairs
are omitted.
The elapsed time is computed by subtracting the
timestamp of the first entry from the timestamp of the
last exit.
3.5.2 Data Logging
For each monitored request, a single request record
(shown in Figure 4) is logged. A record contains the
total time spent in each layer, but not the individual
entries and exits.
A request record contains one line for each used
layer. Each layer record contains the following fields:
“thread” to identify the thread, “tag” to identify the
layer, “accTime” with the accumulated time inside
the layer in a given time unit, and “context” with
key-value pairs, separated by commas. The request
record is ended by a blank line. The monitor stores
the performance data to a thread-specific log file to
avoid contention between threads. The request data is
logged after the final timestamp is recorded. At the
end of the run, all related log files are merged and the
“thread” field is added.
3.6 Analyzer
At this stage all samples of execution data, resulting
from multiple runs using the same settings, have been
collected and await processing. The Analyzer tool
applies a sequence of processing steps to the sample
data and outputs statistics. The statistics calculations
are done with the Apache Commons Math
11
library.
The first processing step converts the request records
from monitor format (figure 4) to Comma-Separated
Values (CSV) format (figure 5), with one request per
line. All context key-value pairs are converted to
fields. All time units are normalized to milliseconds.
At this stage, the following conditions regarding time
values are verified:
web
t
> ws
t
>
∑
service
t
>
∑
hibernate
t
Next there is a filter that can be used to select a
subset of records satisfying a specific condition (e.g.
the request must be a flight reservation). Then, the
sample statistics are computed. A complete records
file is summarized in a single row. For each numeric
field, the mean, standard deviation, upper quartile,
11
http://commons.apache.org/math/
filter_t,soap_t,soap_name,soap_request_len,...
1558.493,1506.191,searchFlights,204,...
413.227,406.875,createReservations,2254,...
...
Figure 5: Two request records in CSV format. Only the first
four columns are displayed.
median, and lower quartile are determined. Finally,
the overall statistics are computed. For each numeric
mean field, the margin of error is calculated for confi-
dence levels of 90%, 95%, and 99%. A similar proce-
dure is applied to the virtual user output logs to pro-
duce error statistics, from the WS client perspective.
3.7 Report Generator
The Report Generator uses the statistical data pro-
duced by the Analyzer and uses it to produce cus-
tom reports. The data required for a specific report is
fetched with a script, and then visualization tools are
used to produce graphical representations. The gnu-
plot (Janert, 2009) tool was used to produce the plots
like the ones presented in the next section.
4 EXPERIMENTS
After the performance analysis tool chain was assem-
bled, several experiments were conducted. The test
platform and the results are presented and discussed
in this section.
4.1 Hardware and Software Platform
The following machines and networks were used for
the test runs.
Machine A with a Quad-core
12
CPU running at
2.50 GHz, 3.25 GB of usable RAM, and 1 TiB
hard disk. It ran 32-bit Windows 7 (version
6.1.7600), MySQL 5.1.43, Java Developer Kit
1.6.0 18, Groovy 1.7.3, Apache Tomcat 6.0.14
and STEP 1.3.3 (includes Hibernate 3.3.2.GA,
JAX-B 2.1.10, JAX-WS 2.1.7, Stripes 1.5.1).
Machine B with a Dual-core
13
CPU running at 2.53
GHz, 3 GB of RAM, and 500 GiB of hard disk
storage. It ran the same software.
The machines were connected either by a 100
Megabit LAN or by a 10 Megabit LAN. The ma-
chines were configured to either disable or post-
pone all system maintenance activities (file system
12
Intel Core 2 Quad CPU Q8300.
13
Intel Core 2 Duo CPU P9500.
CLOSER2012-2ndInternationalConferenceonCloudComputingandServicesScience
546
indexing, software updates, screen savers, etc). The
SysInternals
14
tools AutoRuns and ProcMon were
used to disable and assert the deactivation, respec-
tively. Power management settings were set for max-
imum performance. The measurements were taken
for the application’s steady-state performance (and
not for start-up performance). Gargage collection and
object finalization were not forced for the test runs,
because they were considered as part of the steady-
state server workload (Boyer, 2008). Unless stated
otherwise, all presented results were produced by the
Web Service running in Machine A.
The analyzed system was the “Flight reservation
Web Service” (Flight WS) that is the example appli-
cation included in the STEP Framework source code.
The initial Flight WS had only one operation:
“create low price reservation”. Additional operations
were developed: “search flights”, “create single reser-
vation”, and “create multiple reservations”. The rea-
son for adding new operations was to allow more di-
verse kinds of requests using all of the most common
data types (text, numeric, date, currency, and collec-
tions) and producing different message sizes.
With the new operations it became possible to
instantiate all the message archetypes defined in the
IWS Web Service benchmark (Machado and Ferraz,
2006), making Flight WS a typical Web Service. All
operations were implemented following the guide-
lines in the STEP Framework “cookbook”, making
Flight WS a typical STEP Web Service. If both these
assumptions hold true, conclusions drawn for Flight
WS can be applied to similar Web Services.
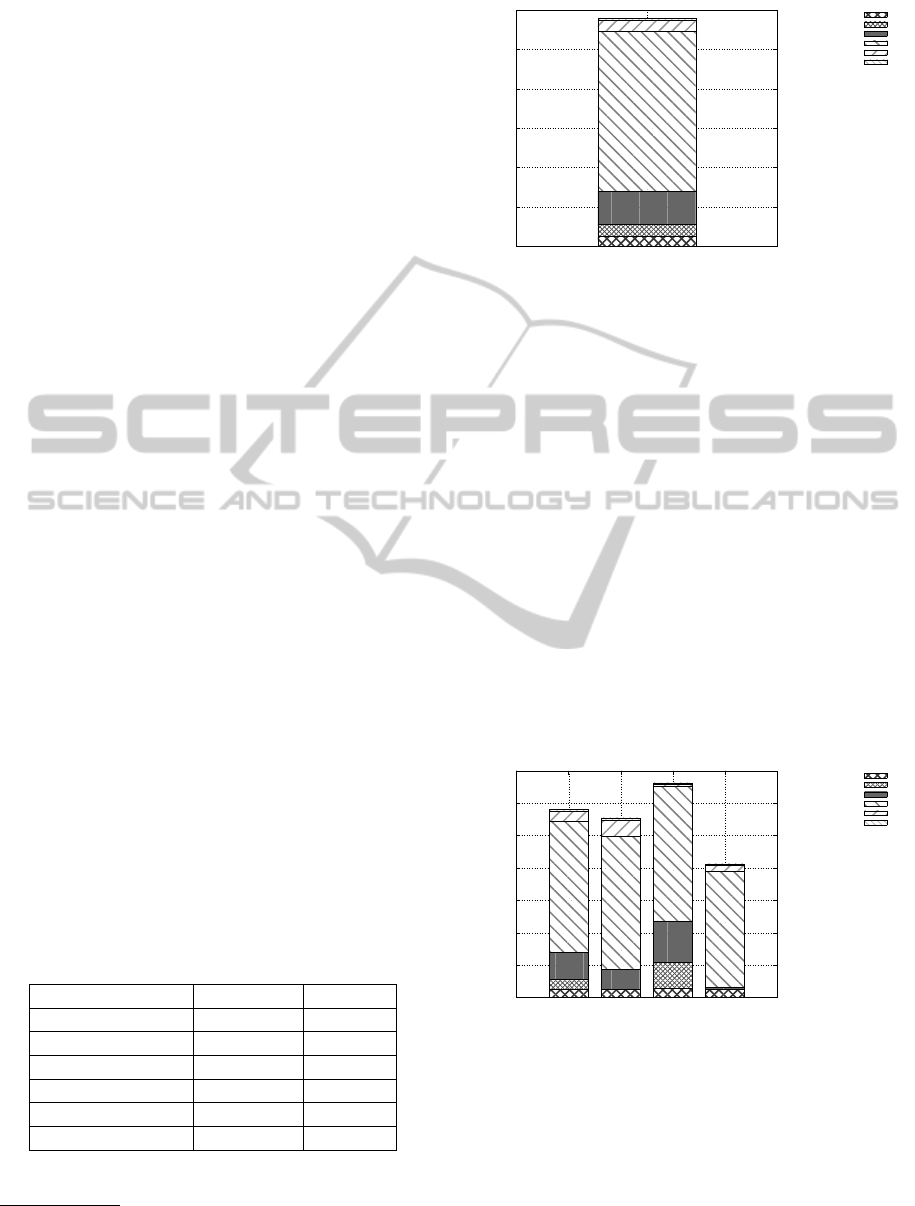
4.2 Results
4.2.1 Request Time Breakdown
Table 1 presents the request processing time break-
down. Figure 6 represents the same data visually.
Table 1: Request processing time breakdown.
Slice Time (ms) Time %
Web 2.83 0.98
Web Service 14.33 4.94
Service 203.14 70.07
Hibernate Engine 40.97 14.13
Hibernate Writes 15.52 5.35
Hibernate Reads 13.10 4.52
14
http://technet.microsoft.com/en-
us/sysinternals/default.aspx
0
50
100
150
200
250
300
Average request processing time (ms)
Hibernate Reads
Hibernate Writes
Hibernate Engine
Service
Web Service
Web
Figure 6: Request processing time breakdown.
The largest time slice is Service (70%). This re-
sult makes sense not only because it encompasses all
the application-specific logic, but also because it is
the slice where the bulk of “other” processing time
is accounted for. The second largest slice is the sum
of Hibernates (24%). Hibernate manages the domain
objects in the database. The Hibernate engine slice is
significant (14%) because it includes the transaction
commit when data is actually written to the database.
The absolute value of roughly 300 milliseconds
average processing time is only meaningful for com-
paring with other results obtained from the same ma-
chine.
4.2.2 Request Types
In this experiment request types are filtered and analy-
zed separately. Table 2 (shown in the last page) and
Figure 7 present the results.
0
50
100
150
200
250
300
350
all searches reservations faults
Average request processing time (ms)
Hibernate Reads
Hibernate Writes
Hibernate Engine
Service
Web Service
Web
Figure 7: Request processing breakdown for different re-
quest types.
Searches are read-only, reservations are read-
write. Faults were mostly produced by invalid input,
so no data was written. Notice that the Hibernate
Writes slices are empty on searches and faults. The
framework handling of failed transactions is efficient
because significant time savings are achieved when
there are database rollbacks.
IMPROVINGWEBSERVICESPERFORMANCE,ONESTEPATATIME
547

Table 2: Request processing breakdown for different request types.
Request Web (%) WS (%) Service (%) Hib. Eng. (%) Hib. W (%) Hib. R (%)
All 0.98 4.94 70.07 14.13 5.35 4.52
Searches 1.25 8.75 74.15 11.31 0.00 4.55
Reservations 0.71 0.83 62.69 19.37 12.17 4.23
Faults 0.83 4.60 86.73 1.96 0.00 5.89
4.2.3 Web Service Message Size
In this experiment, the SOAP message size is in-
creased by making flight reservation requests with
more passengers. Figure 8 and Table 3 present a
comparison of the different workloads with increas-
ing average XML length. XML logical length is mea-
sured in characters and is the sum of the length of all
tag names, attribute names, and text nodes.
0
500
1000
1500
2000
2500
3000
3500
4000
3215 5190 28348 142145 222281
Average request processing time (ms)
Average total XML logical length (characters)
Hibernate Reads
Hibernate Writes
Hibernate Engine
Service
Web Service
Web
Figure 8: Request processing breakdown for increasing
SOAP size.
The dominant slices are still Service and Hiber-
nate and the impact on request time is very significant.
Figure 9 shows the detail only for the Web and SOAP
slices.
0
20
40
60
80
100
120
3215 5190 28348 142145 222281
Average request processing time (ms)
Average total XML logical length (characters)
Web Service
Web
Figure 9: Web and web service layers detail of request pro-
cessing breakdown with increasing SOAP size.
Increasing XML size has less impact than ex-
pected, providing evidence that XML parsers have
been greatly optimized since the early versions
where the performance degradation was more signif-
icant (Machado and Ferraz, 2006). However, there
are still practical limits for the message sizes. Figure
10 shows that for messages above 150 000 charac-
ters (roughly 150 KiB assuming UTF-8 encoding) the
server starts to fail with java.lang.OutOfMemoryError
due to lack of Java heap space. This explains why
the percentage of time spent in the service layer (see
‘Service’ column in Table 3) actually decreases with
increasing XML length.
Percentage of requests %
Average total XML logical length (characters)
Successful
App. Exceptions
System Errors
0
20
40
60
80
100
50000 100000 150000 200000
Figure 10: Outcome of requests for with increasing SOAP
size.
4.2.4 Hibernate Second-level Cache
The goal of this experiment was to measure the im-
provement of performance by using the out-of-the-
box Hibernate second-level caching implementation
EHCache (Bauer and King, 2008).
The first-level cache is turned on by default and is
managed at the Hibernate Session object. Since each
request has its own Session, the cache is not shared
between them. The second-level cache is mana-
ged at the Session Factory object and allows sharing
between sessions.
The results were disappointing for performance
enthusiasts (author included), as can be seen on Ta-
ble 4 and Figure 11.
When running Tomcat and MySQL in the same
machine, using the second level cache actually did not
improve performance (see first 3 rows of Table 4 and
and first 3 bars of Figure 11). The read-only cache
CLOSER2012-2ndInternationalConferenceonCloudComputingandServicesScience
548
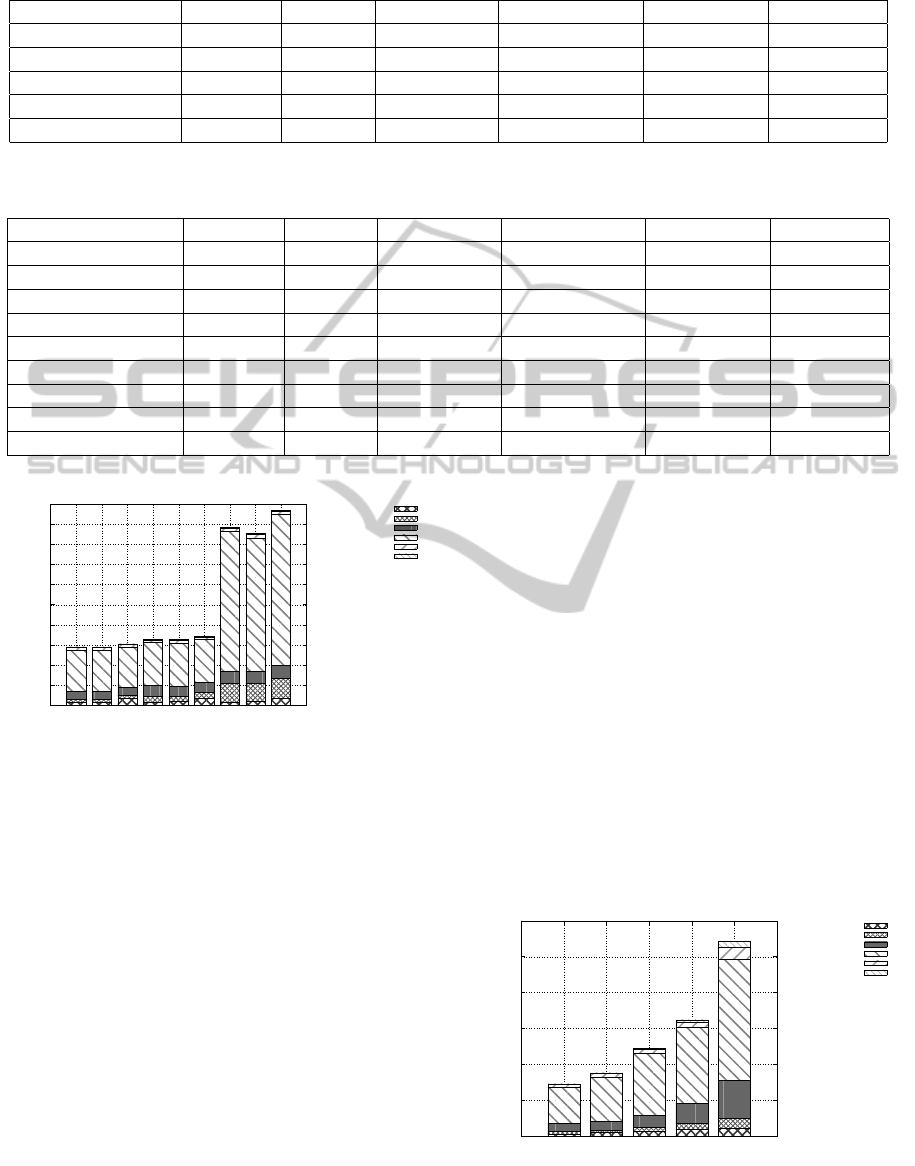
Table 3: Request processing breakdown for increasing SOAP size.
Avg. XML length Web (%) WS (%) Service (%) Hib. Eng. (%) Hib. W (%) Hib. R (%)
3215 0.96 5.26 73.93 14.33 0.80 4.73
5190 0.98 4.94 70.07 14.13 5.35 4.52
28348 1.53 3.93 55.69 11.78 23.57 3.51
142145 1.60 2.35 45.16 8.95 39.35 2.59
222281 1.50 1.64 50.62 7.28 36.88 2.08
Table 4: Request processing breakdown for different cache settings.
Configuration Web (%) WS (%) Service (%) Hib. Eng. (%) Hib. W (%) Hib. R (%)
Local DB 0.98 4.94 70.07 14.13 5.35 4.52
w r-only cache 0.95 5.28 70.46 13.63 4.81 4.88
w r-w cache 0.91 5.05 65.32 13.40 4.67 10.65
100 Mbit LAN DB 0.72 4.06 65.20 16.01 8.96 5.06
w r-only cache 0.75 4.42 65.74 14.93 8.61 5.54
w r-w cache 0.68 4.19 62.33 14.76 8.16 9.88
10 Mbit LAN DB 0.28 1.88 78.50 6.83 10.64 1.88
w r-only cache 0.32 2.53 77.66 6.55 10.86 2.08
w r-w cache 0.25 1.90 77.28 6.80 10.26 3.51
0
100
200
300
400
500
600
700
800
900
1000
Local DB
w/ r-only cache
w/ r-w cache
100 Mbit LAN DB
w/ r-only cache
w/ r-w cache
10 Mbit LAN DB
w/ r-only cache
w/ r-w cache
Average request processing time (ms)
Hibernate Reads
Hibernate Writes
Hibernate Engine
Service
Web Service
Web
Figure 11: Request processing breakdown for different
cache settings.
has negligible effect (see next 3 rows and 3 bars). The
read-write cache actually decreases performance (see
last 3 rows and 3 bars).
When running Tomcat in Machine A and MySQL
in Machine B, connected by a 100 Megabit LAN,
the results were only marginally worse, despite the
network traffic. Only when running Tomcat in Ma-
chine A and MySQL in Machine B, connected by a
more constricted 10 Megabit LAN, did the read-only
cache prove beneficial. However, the request process-
ing time for this configuration was roughly 3 times
slower than the others.
The bandwidth of the LANs was measured to
verify claimed performance. The 100 Megabit had
an actual performance of 94.402 ± 0.157 Mbit/s and
the 10 Megabit had a performance of 7.312 ± 0.262
Mbit/s, both measured with 95% confidence. These
measurements are close to the nominal values.
All things considered, the best solution for this
application is to leave the second-level cache turned
off. Most caching benefits are achieved with the first-
level cache. This conclusion might be different for
other applications with other data usage patterns.
4.2.5 Concurrent Users
The performance of an application in a production en-
vironment heavily depends on the number of users,
making it hard to properly test the implementation in
a development environment where only a single user
is available. In this experiment several virtual users
were running at the same time. Table 5 and Figure 12
present the results.
0
200
400
600
800
1000
1200
1 2 4 8 16
Average request processing time (ms)
Number of concurrent users
Hibernate Reads
Hibernate Writes
Hibernate Engine
Service
Web Service
Web
Figure 12: Request processing breakdown for increasing
concurrent users.
IMPROVINGWEBSERVICESPERFORMANCE,ONESTEPATATIME
549
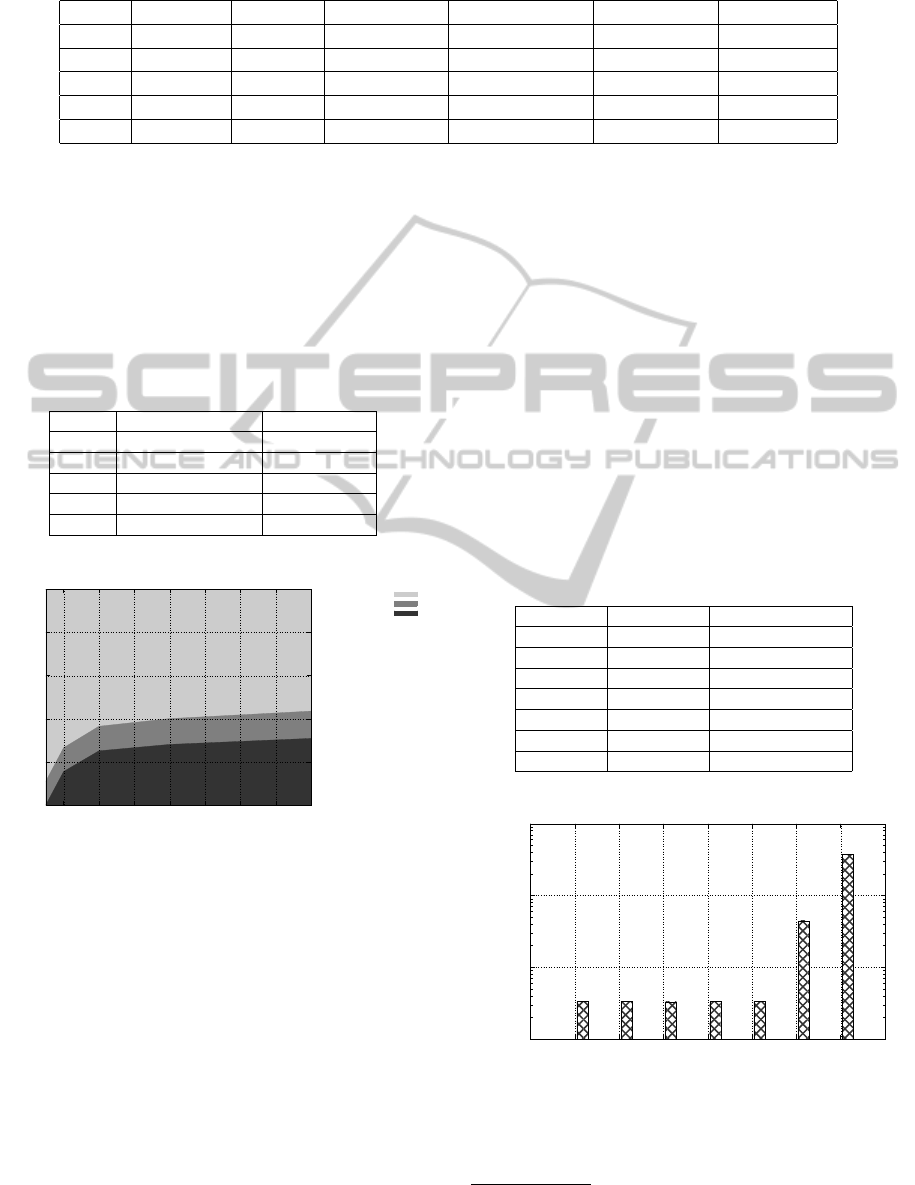
Table 5: Request processing breakdown for increasing concurrent users.
Users Web (%) WS (%) Service (%) Hib. Eng. (%) Hib. W (%) Hib. R (%)
1 0.98 4.94 70.07 14.13 5.35 4.52
2 1.10 4.89 70.06 14.08 4.08 5.80
4 1.21 4.04 71.09 13.58 3.97 6.11
8 2.04 4.62 65.06 17.07 5.47 5.74
16 2.75 6.07 62.55 19.56 4.80 4.26
The server scales fairly well for the tested num-
ber of users. The request processing time stays in
the same order of magnitude for a ten-fold increase in
load (when the number of users changes from 1 to 10,
the processing time stays below 1000 milliseconds).
However, there is a problem that is only evidenced by
Table 6 and Figure 13.
Table 6: Failed requests for increasing concurrent users.
Users Exceptions (%) Errors (%)
1 11.04 0.00
2 11.04 15.45
4 11.39 25.06
8 11.98 28.06
16 12.66 30.85
Percentage of requests %
Number of concurrent users
Successful
App. Exceptions
System Errors
0
20
40
60
80
100
2 4 6 8 10 12 14 16
Figure 13: Outcome of requests for increasing concurrent
users.
The number of Application Exceptions stays the
same (as expected in a simulated workload) but the
number of System Errors steadily increases, from 0%
for 1 user, to 30% for 16 users.
A thorough study shows that the prob-
lem is caused by Hibernate’s optimistic
cache (Bauer and King, 2008) approach that
throws org.hibernate.StaleObjectStateException
when it detects concurrent modifications of the
same objects. This happens not only for entity data
modifications, but also for relationship modifications.
The impact of this issue is magnified because the
STEP Framework “cookbook” advocates the use of a
“Domain Root” object that connects to all the main
domain entities. This guideline has a measurable
impact on the scalability of STEP applications and
should be reconsidered in future versions.
4.2.6 Logging Cost
Log libraries are very important for server-side ap-
plications as a debug and diagnostic tool. The STEP
Framework and the libraries it uses rely on Apache
Log4J
15
to log program messages. In this experiment,
the functional log level was changed from no messa-
ges (”off”) up to the most detailed level (”trace”). Ta-
ble 7 presents the values along with Figure 14 in loga-
rithmic scale.
Table 7: Log level average processing time and average
functional log size.
Log level Time (ms) Log size (bytes)
Off 332.52 0
Fatal 332.10 0
Error 331.69 1792
Warn 333.70 1792
Info 332.91 13978
Debug 4431.41 296059571
Trace 37430.76 2029488189
100
1000
10000
100000
off fatal error warn info debug trace
Average request processing time (ms)
Logging level
Figure 14: Request processing times for log level settings.
The y axis is in logarithmic scale.
The cost of logging beyond “info” level makes the
15
http://logging.apache.org/log4j/
CLOSER2012-2ndInternationalConferenceonCloudComputingandServicesScience
550

“debug” and “trace” levels impractical for production
environments.
5 CONCLUSIONS
This paper presented the performance tools developed
for the STEP Framework, a Java-based framework for
Web Services and applications, but most importantly,
it presented trade-off discussions and lessons learned
that can be applied to other Web Service frameworks
dealing with performance-related issues, especially
when using the Hibernate, JAX-WS, and Log4J li-
braries.
The performance assessment used a representative
Web Service to perform experiments on: time slice
breakdown, request types, SOAP size, caching, con-
current users, and logging. Assembling a tool chain
to collect, process, and visualize the data was an ex-
tensive work, but the benefits of having it in place
are greatly valuable for developers in a learning en-
vironment and beyond. The detailed description of
the performance analysis process provides insight to
how similar techniques can be used. Some pitfalls
are stated and explained for others to avoid. With the
new framework capabilities, future work can compare
application implementation alternatives, but can also
compare diverse platforms, both physical and virtua-
lized, and providing means to compare performance
in different cloud providers. The developed perfor-
mance tool chain assists in finding solutions for per-
formance problems, one step at a time.
ACKNOWLEDGEMENTS
Miguel L. Pardal is supported by a PhD fellow-
ship from the Portuguese Foundation for Science and
Technology FCT (SFRH/BD/45289/2008).
REFERENCES
Alonso, G., Casati, F., Kuno, H., and Machiraju, V. (2004).
Web Services: Concepts, Architectures and Applica-
tions. Springer Verlag.
Bauer, C. and King, G. (2008). Java Persistence with Hi-
bernate. Manning.
Boyer, B. (2008). Robust Java benchmarking. IBM Devel-
oper Works.
Fowler, M., Rice, D., Foemmel, M., Hieatt, E., Mee, R.,
and Stafford, R. (2002). Patterns of Enterprise Appli-
cation Architecture. Addison Wesley.
Georges, A., Buytaert, D., and Eeckhout, L. (2007).
Statistically rigorous Java performance evaluation.
In 22nd annual ACM SIGPLAN conference on
Object-oriented programming systems and applica-
tions (OOPSLA), pages 57–76, New York, NY, USA.
ACM.
Jain, R. (1991). The Art of Computer Systems Performance
Analysis - Techniques for Experimental Design, Mea-
surement, Simulation, and Modeling. Wiley.
Janert, P. K. (2009). Gnuplot in Action - Understanding
Data with Graphs. Manning.
Juric, M. B., Rozman, I., Brumen, B., Colnaric, M., and
Hericko, M. (2006). Comparison of performance
of Web Services, WS-Security, RMI, and RMISSL.
Journal of Systems and Software, 79(5):689 – 700.
Machado, A. and Ferraz, C. (2006). JWSPerf: A perfor-
mance benchmarking utility with support to multiple
web services implementations. In International Con-
ference on Internet and Web Applications and Services
(ICIW), pages 159 – 159.
Montgomery, D. C. and Runger, G. C. (2010). Applied
Statistics and Probability for Engineers. Wiley.
Pardal, M., Fernandes, S., Martins, J., and Pardal, J. P.
(2008). Customizing web services with extensions in
the STEP Framework. International Journal of Web
Services Practices, 3. Issue 1.
Pearce, D. J., Webster, M., Berry, R., and Kelly, P. H. J.
(2007). Profiling with aspectj. Softw. Pract. Exper.,
37(7):747–777.
Roza, M., Schroders, M., and van de Wetering, H. (2009).
A high performance visual profiler for games. In ACM
SIGGRAPH Symposium on Video Games (Sandbox
’09), pages 103–110, New York, NY, USA. ACM.
Shankar, K. and Lysecky, R. (2009). Non-intrusive dynamic
application profiling for multitasked applications. In
46th Annual Design Automation Conference (DAC),
pages 130–135, New York, NY, USA. ACM.
IMPROVINGWEBSERVICESPERFORMANCE,ONESTEPATATIME
551
